CPI Inflation Slows but Some Data Are Missing from Latest Report

Image generated by ChatGPT

On Thursday (December 18) the Bureau of Labor Statistics (BLS) released its latest report on the consumer price index (CPI). The federal government shutdown, which lasted from October 1 to November 12, is still affecting the macroeconomic statistics being gathered by the BLS and other agencies. The BLS notes in the report:

“BLS did not collect survey data for October 2025 due to a lapse in appropriations. BLS was unable to retroactively collect these data. For a few indexes, BLS uses nonsurvey data sources instead of survey data to make the index calculations. BLS was able to retroactively acquire most of the nonsurvey data for October. CPI data collection resumed on November 14, 2025.”

The following table from the CPI report gives an indication of how much data that is normally collected wasn’t collected in October or November.

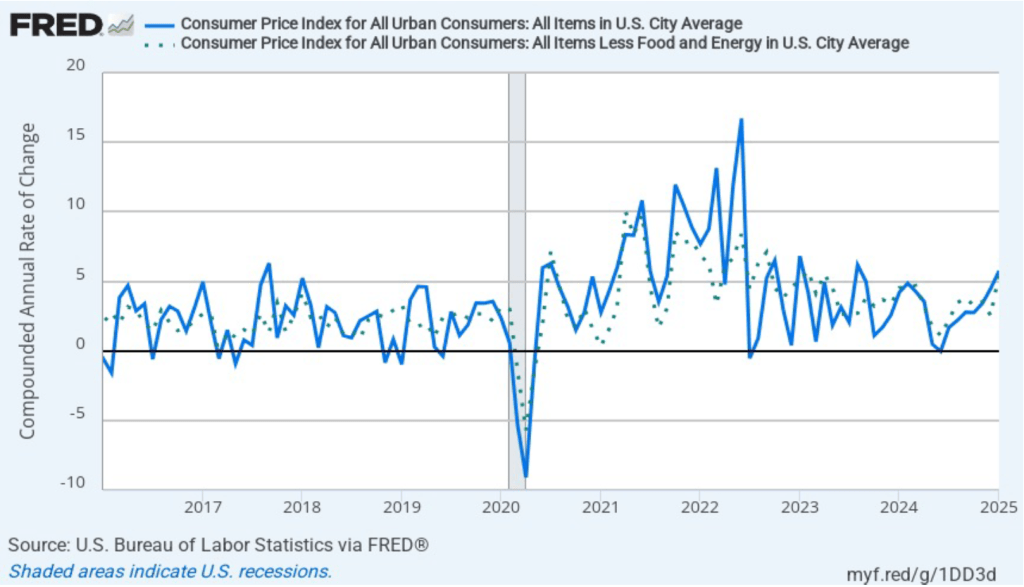
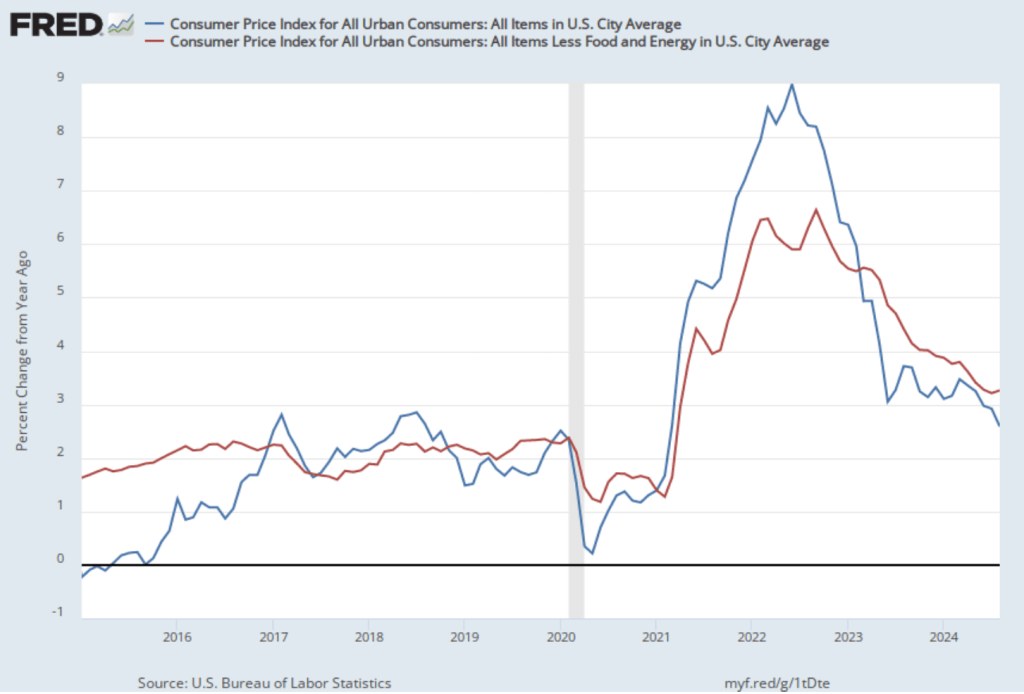
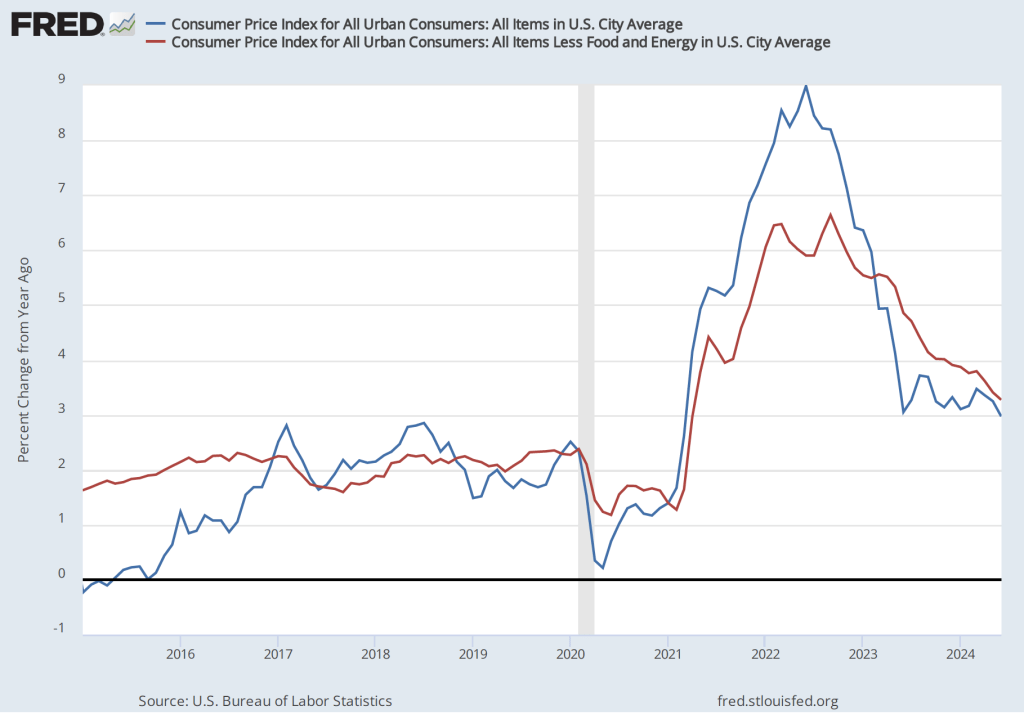
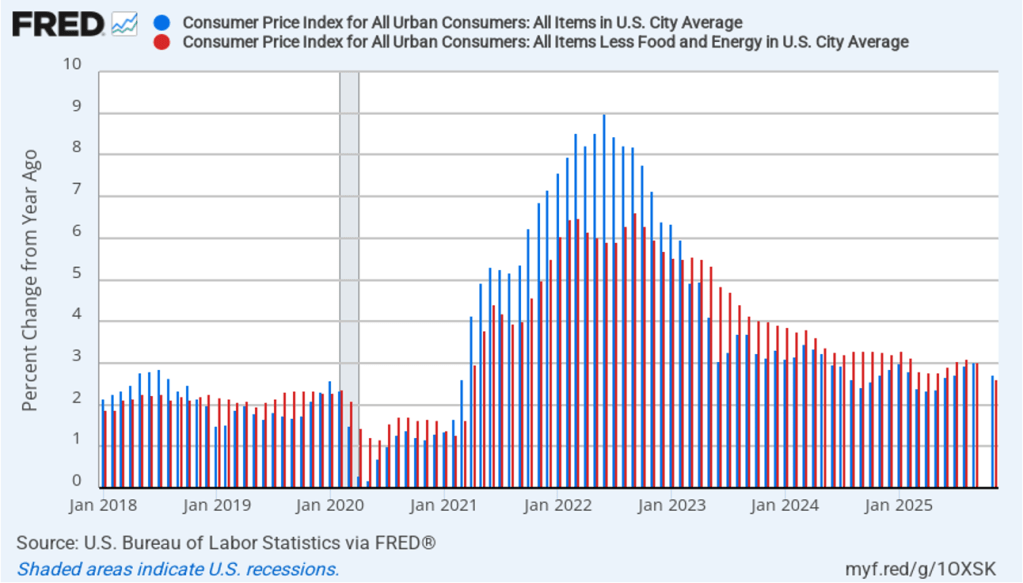
Bearing in mind the missing data, the following figure compares headline CPI inflation (the blue bar) and core CPI inflation (the red bar) as reported in this month’s CPI report.

  • The headline inflation rate, which is measured by the percentage change in the CPI from the same month in the previous year, was 2.7 percent in November, down from 3.0 in September. 
  • The core inflation rate, which excludes the prices of food and energy, was 2.6 percent in November, down from 3.0 percent in September. 

Economists who were surveyed by Fact Set had forecast that both headline inflation and core inflation would rise to 3.1 percent in November. Economists surveyed by the Wall Street Journal also forecast that headline inflation would rise to 3.1 percent in November, but forecast that core inflation would rise slightly less to 3.0 percent. It’s unclear whether the economists were aware at the time they were surveyed how much data for October and November would be missing from this month’s report.

Because of how much data that is normally collected was missing from the calculations of November’s inflation rate, the results should be treated with caution. The Wall Street Journal quoted an economist at the investment bank UBS as advising: “I think you largely just put this one to the side. Maybe this report gives a minor downward sign for overall inflation, but the vast, vast majority of this is just noise and should be ignored.”

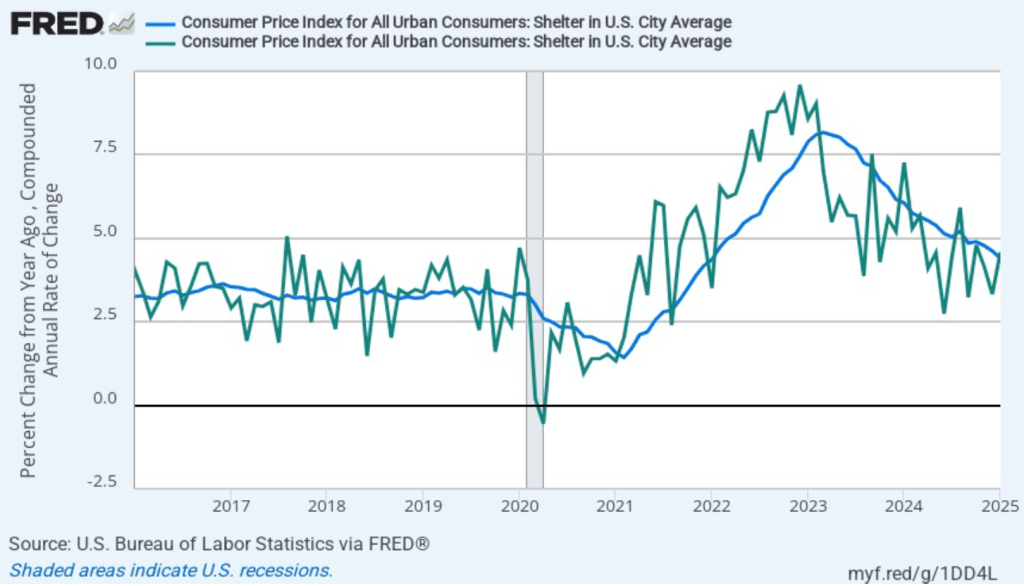
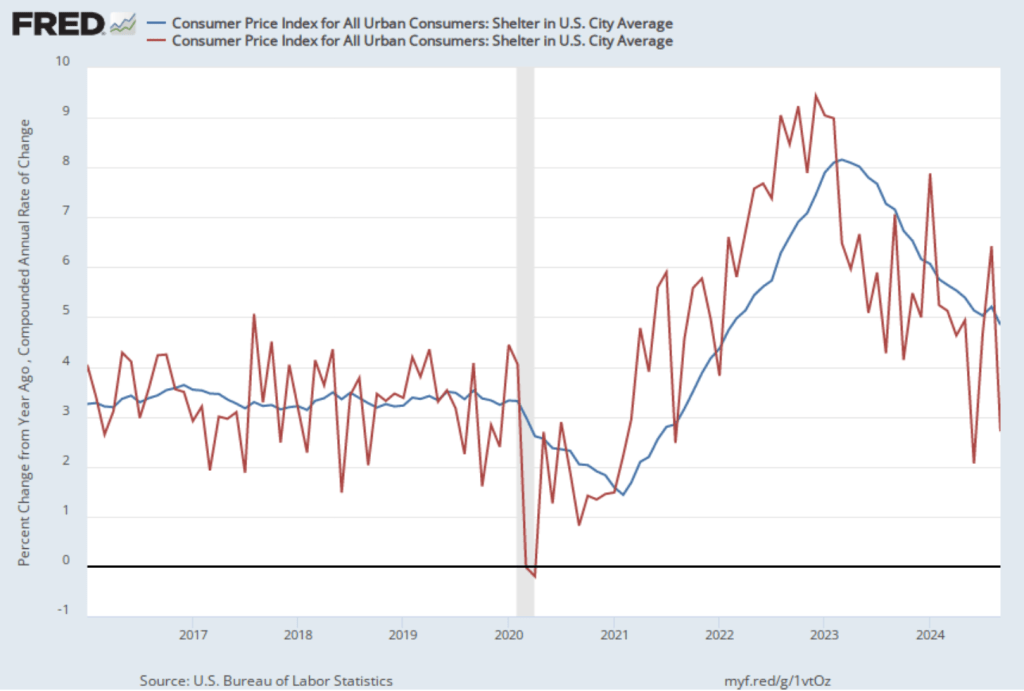
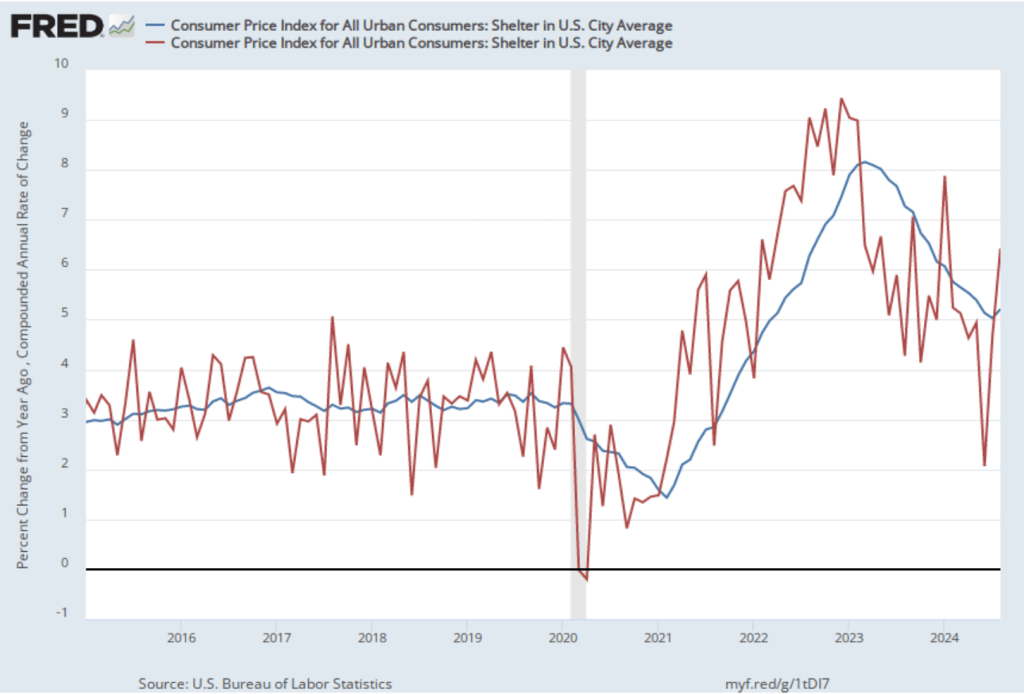
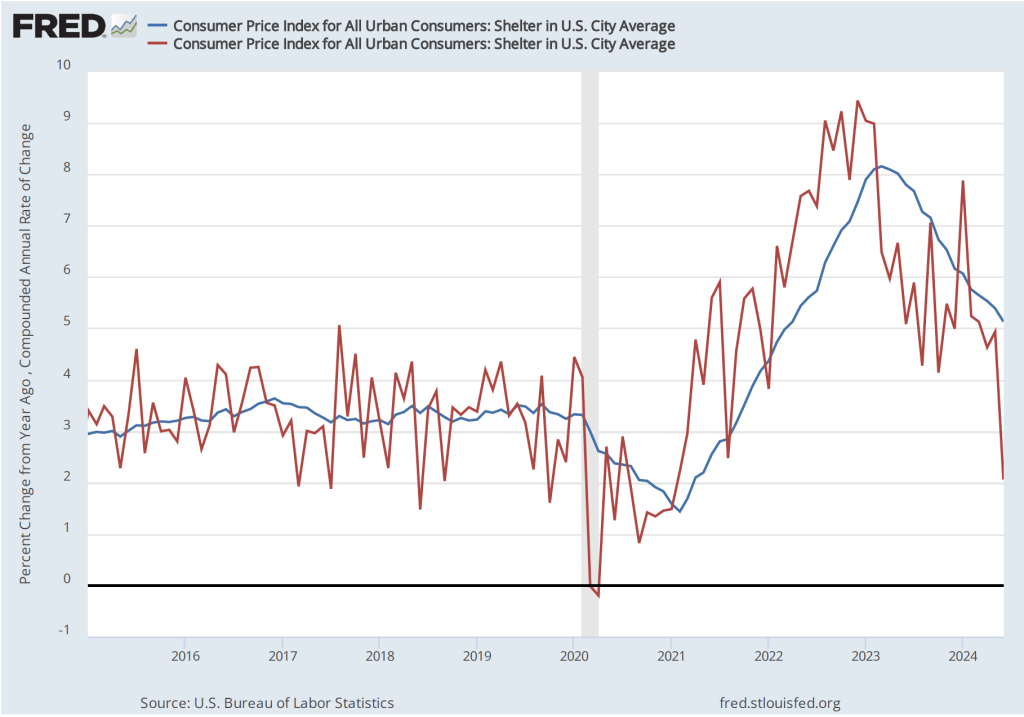
Several economists were concerned about the computation the BLS had to make to deal with the lack of direct data on the price of “shelter.” The price of shelter in the CPI, as explained here, includes both rent paid for an apartment or a house and “owners’ equivalent rent of residences (OER),” which is an estimate of what a house (or apartment) would rent for if the owner were renting it out. OER is included in the CPI to account for the value of the services an owner receives from living in an apartment or house. The following figure shows CPI inflation, measured as the percentage change since the same month in the previous year, leaving out the price of shelter. Measured this way, inflation was 2.6 percent in November, which is slightly lower than the 2.7 percent inflation rate the BLS reported when including all items.

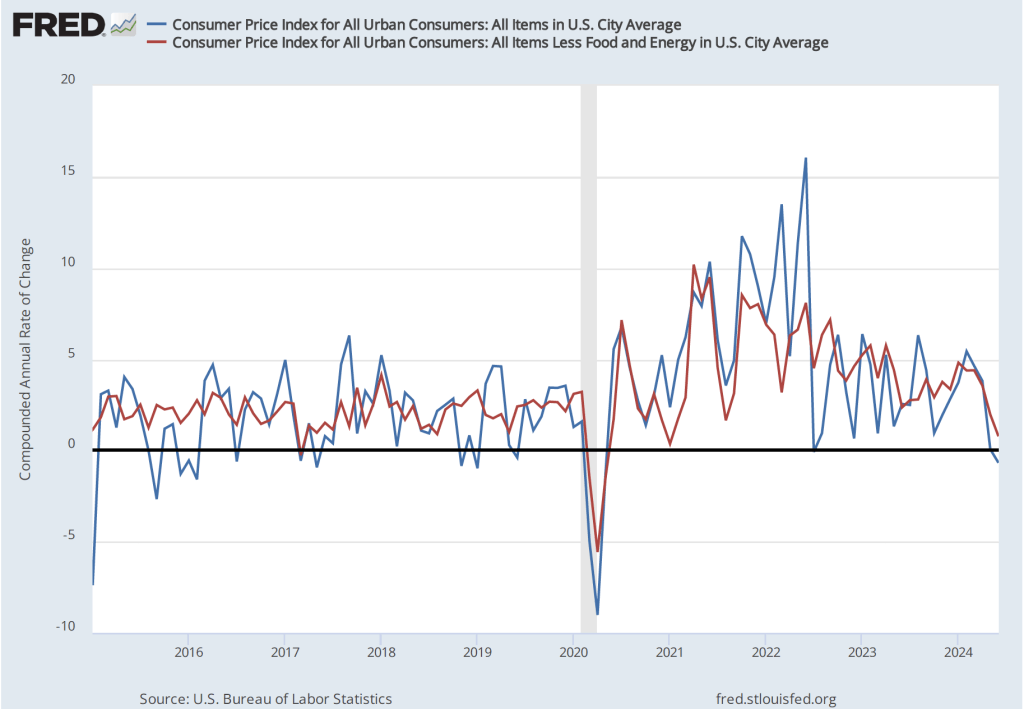
What effect have the tariffs that the Trump administration announced on April 2 had on inflation? (Note that many of the tariff increases announced on April 2 have since been reduced.) The following figure shows 12-month inflation in durable goods—such as furniture, appliances, and cars—which are likely to be affected directly by tariffs, and services, which are less likely to be affected by tariffs. To make recent changes clearer, we look only at the months since January 2022. In November, inflation in durable goods decreased to 1.8 percent from 2.2 percent in September. Inflation in services in November was 3.2 percent, down from 3.6 percent in September. So the upward pressure on goods prices from the tariffs seems to be declining. But, again, missing data makes it’s unclear to what extent November inflation numbers are representative of what’s actually happening currently to prices.

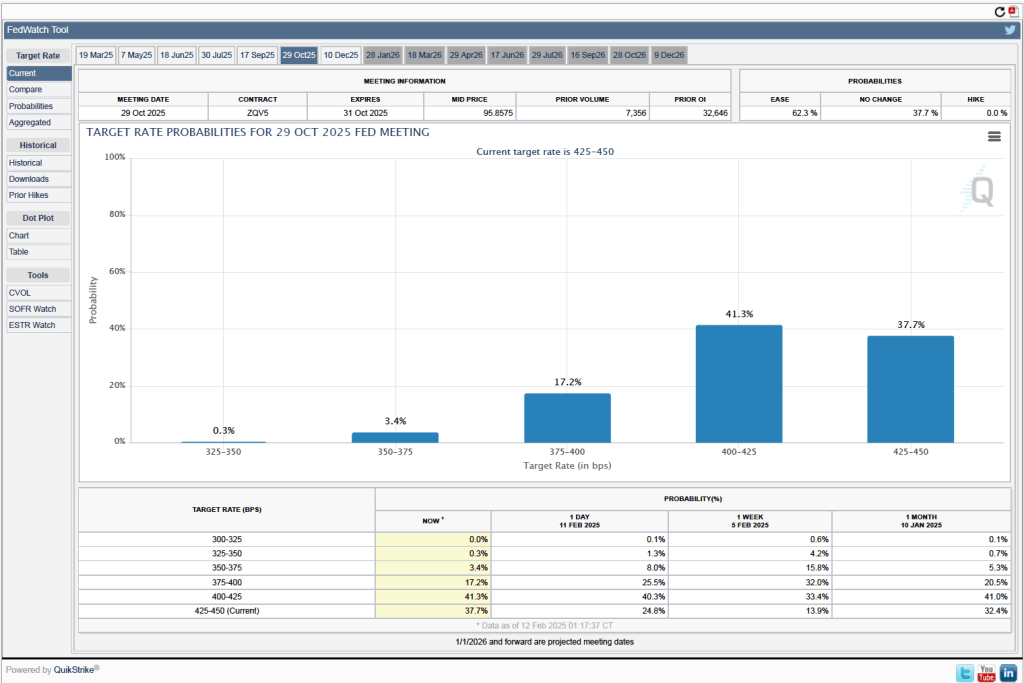
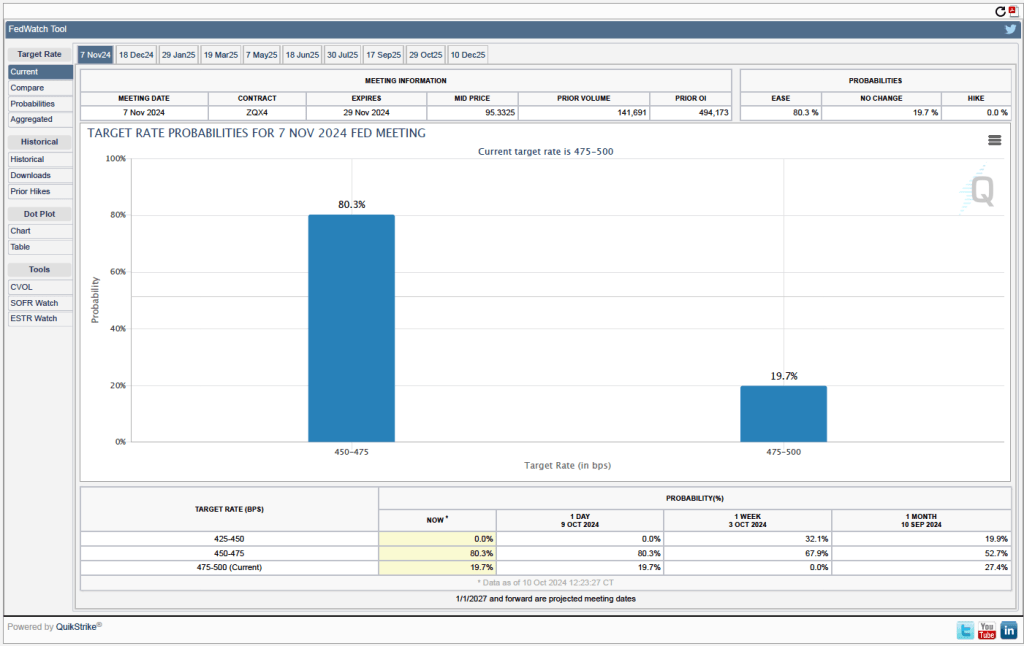
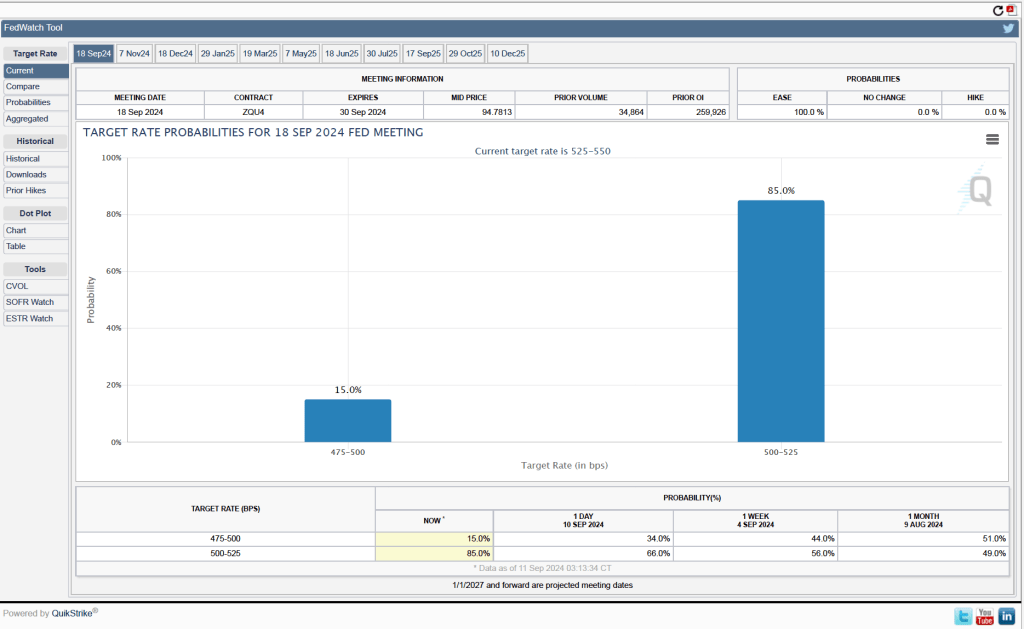
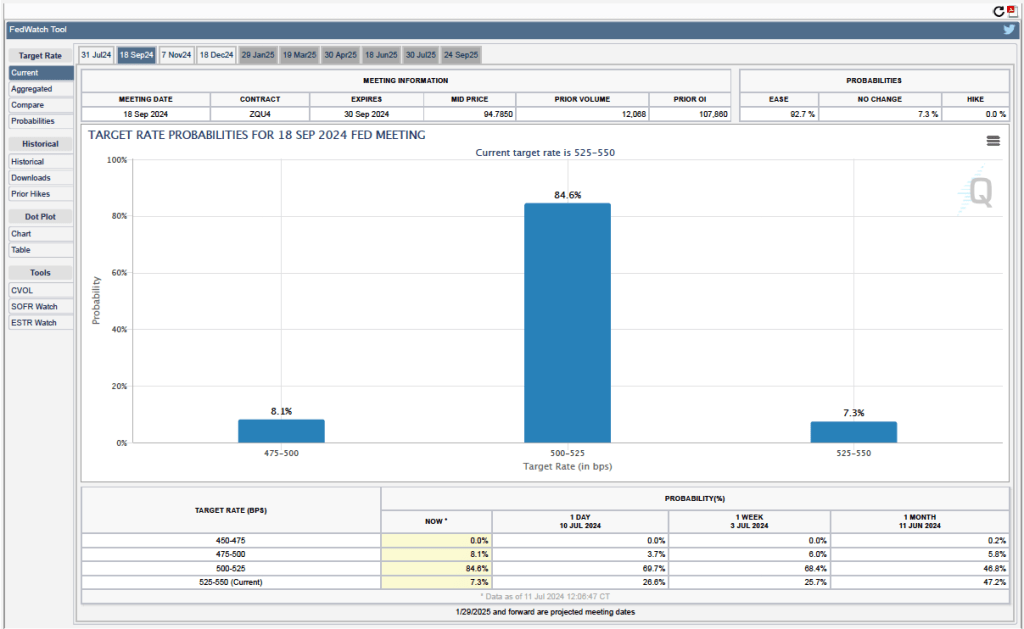
It’s unlikely that this inflation report will have much effect on the views of the members of the Federal Reserve’s policymaking Federal Open Market Committee. In a press conference after the committee’s most recent meeting, Fed Chair Jerome Powell cautioned against drawing firm conclusions from data for October and November:

“I should mention on the data, as long as I’m talking about it, that we’re going to need to be careful in assessing particularly the household survey data. There are very technical reasons about the way data are collected in some of these measures, both in, you know, inflation and in labor—in the  labor market so that the data may be distorted. And not just sort of more volatile, but distorted. And that—it’s—and  that’s really because data was not collected in October and half of November. So we’re going to get data, but we’re going to have to look at it carefully and with a somewhat skeptical eye by the time of the January meeting ….”

CPI Inflation in January Is Higher than Expected

Image generated by GTP-4o illustrating inflation

On February 12, the Bureau of Labor Statistics (BLS) released its monthly report on the consumer price index (CPI). The following figure compares headline inflation (the blue line) and core inflation (the dotted green line).

  • The headline inflation rate, which is measured by the percentage change in the CPI from the same month in the previous month, was 3.0 percent in January—up from 2.9 percent in December. 
  • The core inflation rate, which excludes the prices of food and energy, was 3.3 percent in January—up from 3.2 percent in December. 

Headline inflation and core inflation were both above what economists surveyed had expected.

In the following figure, we look at the 1-month inflation rate for headline and core inflation—that is the annual inflation rate calculated by compounding the current month’s rate over an entire year. Calculated as the 1-month inflation rate, headline inflation (the blue line) jumped from 4.5 percent in December to 5.7 percent in January—following a large jump in inflation from November to December. Core inflation (the dotted green line) more than doubled from 2.5 percent in December to 5.5 percent in January.

Overall, considering 1-month and 12-month inflation together, today’s data are concerning. One-month headline inflation is the highest it’s been since August 2023. One-month core inflation is the highest it’s been since April 2023. This month’s CPI report reinforces the conclusion from other recent inflation reports that progress on lowering inflation appears to have stalled. So, the probability of a “no landing” outcome, with inflation remaining above the Fed’s target for an indefinite period, seems to have increased. 

Of course, it’s important not to overinterpret the data from a single month. The figure shows that 1-month inflation is particularly volatile. Also note that the Fed uses the personal consumption expenditures (PCE) price index, rather than the CPI, to evaluate whether it is hitting its 2 percent annual inflation target.

As we’ve discussed in previous blog posts, Federal Reserve Chair Jerome Powell and his colleagues on the Fed’s policymaking Federal Open Market Committee (FOMC) have been closely following inflation in the price of shelter. The price of “shelter” in the CPI, as explained here, includes both rent paid for an apartment or a house and “owners’ equivalent rent of residences (OER),” which is an estimate of what a house (or apartment) would rent for if the owner were renting it out. OER is included in the CPI to account for the value of the services an owner receives from living in an apartment or house.

As the following figure shows, inflation in the price of shelter has been a significant contributor to headline inflation. The blue line shows 12-month inflation in shelter, and the green line shows 1-month inflation in shelter. Twelve-month inflation in shelter has been declining since the spring of 2023, but in January it was still relatively high at 4.4 percent. One-month inflation in shelter—which is much more volatile than 12-month inflation in shelter—rose sharply from 3.3 percent in December to 4.6 percent in January. Clearly a worrying sign given that many economists were expecting that shelter inflation would continue to slow.

To better estimate of the underlying trend in inflation, some economists look at median inflation and trimmed mean inflation.

  • Median inflation is calculated by economists at the Federal Reserve Bank of Cleveland and at Ohio State University. If we listed the inflation rate in each individual good or service in the CPI, median inflation is the inflation rate of the good or service that is in the middle of the list—that is, the inflation rate in the price of the good or service that has an equal number of higher and lower inflation rates. 
  • Trimmed-mean inflation drops the 8 percent of goods and services with the highest inflation rates and the 8 percent of goods and services with the lowest inflation rates. 

The following figure shows that 12-month trimmed-mean inflation (the blue line) jumped from 3.1 percent in December to 5.2 percent in January. Median inflation (the green line), which had been stable over the past five months, increased from 3.2 percent in December to 3.9 percent in January.

The following figure shows 1-month median and trimmed-mean inflation. One-month trimmed-mean inflation jumped from 3.1 percent in December to 5.1 percent in January. One-month median inflation rose from 3.2 percent in December to 3.9 percent in January. These data provide confirmation that (1) CPI inflation at this point is running higher than a rate that would be consistent with the Fed achieving its inflation target, and (2) that progress toward the target has slowed.

Looking at the futures market for federal funds, investors who buy and sell federal funds futures contracts are not expecting that the Fed’s policymaking Federal Open Market Committee (FOMC) will cut its target for the federal funds until this fall. (We discuss the futures market for federal funds in this blog post.) Investors assign a higher probability to the FOMC leaving its target range for the federal funds rate unchanged at 4.25 percent to 4.50 percent at its January, March, June, July, and September meetings. It’s not until the FOMC’s meeting on October 28-29 that, as shown below, investors assign a higher probability to a rate cut than to the committee leaving the rate unchanged.

CPI Inflation Running Slightly Higher than Expected

Image illustrating inflation generated by GTP-4o.

This morning (October 10), the Bureau of Labor Statistics (BLS) released its monthly report on the consumer price index (CPI). As the following figure shows, the inflation rate for September measured by the percentage change in the CPI from the same month in the previous month—headline inflation (the blue line)—was 2.4 percent down from 2.6 percent in August. That was the lowest headline inflation rate since February 2021. Core inflation (the red line)—which excludes the prices of food and energy—was unchanged at 3.3 prcent. Both headline inflation and core inflation were slightly higher than economists surveyed by the Wall Street Journal had expected.  

As the following figure shows, if we look at the 1-month inflation rate for headline and core inflation—that is the annual inflation rate calculated by compounding the current month’s rate over an entire year—we see that headline inflation (the blue line) decreased from 2.3 percent in August to 2.2 percent in September. Core inflation (the red line) increased from 3.4 percent in August to 3.8 percent in September.

Overall, we can say that, taking 1-month and 12 month inflation together, the U.S. economy may still be on course for a soft landing—with the annual inflation rate returning to the Fed’s 2 percent target without the economy being pushed into a recession—but the increase in 1-month core inflation is concerning because most economists believe that core inflation is a better indicator of the underlying inflation rate than is headline inflation. Of course, as always, it’s important not to overinterpret the data from a single month, although this is the second month in a row that core inflation has been well above 3 percent. (Note, also, that the Fed uses the personal consumption expenditures (PCE) price index, rather than the CPI in evaluating whether it is hitting its 2 percent inflation target.)

As we’ve discussed in previous blog posts, Federal Reserve Chair Jerome Powell and his colleagues on the FOMC have been closely following inflation in the price of shelter. The price of “shelter” in the CPI, as explained here, includes both rent paid for an apartment or house and “owners’ equivalent rent of residences (OER),” which is an estimate of what a house (or apartment) would rent for if the owner were renting it out. OER is included to account for the value of the services an owner receives from living in an apartment or house.

As the following figure shows, inflation in the price of shelter has been a significant contributor to headline inflation. The blue line shows 12-month inflation in shelter and the red line shows 1-month inflation in shelter. After rising in August, 12-month inflation in shelter resumed the decline that began in the spring of 2023, falling from 5.2 percent in August to 4.8 percent September. One-month inflation in shelter—which is much more volatile than 12-month inflation in shelter—declined sharply from 6.4 percent in August to 2.7 percent in September. The members of the FOMC are likely to find the decline in inflation in shelter reassuring as they consider another cut to the target for the federal funds rate at the committee’s next meeting on November 6-7. Shelter has a smaller weight of 15 percent in the PCE price index that the Fed uses to gauge whether it is hitting its 2 percent inflation target in contrast with the 33 percent weight that shelter has in the CPI.

Finally, in order to get a better estimate of the underlying trend in inflation, some economists look at median inflation and trimmed mean inflation. Median inflation is calculated by economists at the Federal Reserve Bank of Cleveland and Ohio State University. If we listed the inflation rate in each individual good or service in the CPI, median inflation is the inflation rate of the good or service that is in the middle of the list—that is, the inflation rate in the price of the good or service that has an equal number of higher and lower inflation rates. Trimmed mean inflation drops the 8 percent of good and services with the higherst inflation rates and the 8 percent of goods and services with the lowest inflation rates. 

As the following figure (from the Federal Reserve Bank of Cleveland) shows, median inflation (the orange line) declined slightly from 4.2 percent in August to 4.1 percent in September. Trimmed mean inflation (the blue line) was unchanged at 3.2 percent. These data provide confirmation that core CPI inflation at this point is likely running at least slightly higher than a rate that would be consistent with the Fed achieving its inflation target.

The FOMC cut its target for the federal funds rate by 0.50 percentage point (50 basis points) from 5.50 percent to 5.25 percent to 5.00 percent to 4.75 percent at its last meeting on September 17-18. Some economists and investors believed that the FOMC might cut its target by another 50 basis points at its next meeting on November 6-7. This inflation report makes that outcome less likely. In addition, the release of the minutes from the September 17-18 meeting revealed that a significant number of committee members may have preferred a 25 basis point cut rather than a 50 basis point cut at that meeting:

“However, noting that inflation was still somewhat elevated while economic growth remained solid and unemployment remained low, some participants observed that they would have preferred a 25 basis point reduction of the target range at this meeting, and a few others indicated that they could have supported such a decision.”

Investors who buy and sell federal funds futures contracts expect that the FOMC will cut its target for the federal funds rate by 0.25 percentage point at its November meeting. (We discuss the futures market for federal funds in this blog post.) As shown in the following figure, today these investors assign a probability of 80.3 percent to the FOMC cutting its target for the federal funds rate by 0.25 percentage point and a probability of 19.7 percent to the committee leaving its target unchanged.

Mixed CPI Inflation Report Sets the Stage for Fed Rate Cut

Image illustrating inflation generated by GTP-4o.

Today (September 11), the Bureau of Labor Statistics (BLS) released its monthly report on the consumer price index (CPI). This report is the last one that will be released before the Fed’s policy-making Federal Open Market Committee (FOMC) holds its next meeting on September 17-18.

As the following figure shows, the inflation rate for August measured by the percentage change in the CPI from the same month in the previous month—headline inflation (the blue line)—was 2.6 percent down from 2.9 percent in July. Core inflation (the red line)—which excludes the prices of food and energy—increased slightly to 3.3 percent in August from 3.2 percent in July. Headline inflation was slightly below what economists surveyed by the Wall Street Journal had expected, while core inflation was slightly higher.

As the following figure shows, if we look at the 1-month inflation rate for headline and core inflation—that is the annual inflation rate calculated by compounding the current month’s rate over an entire year—we see that both headline and core inflation increased. Headline inflation (the blue line) increased from 1.8 percent in July to 2.3 percent in August. Core inflation (the red line) jumped from 2.0 percent in July to 3.4 percent in August. Overall, we can say that, taking 1-month and 12 month inflation together, the U.S. economy may still be on course for a soft landing—with the annual inflation rate returning to the Fed’s 2 percent target without the economy being pushed into a recession—but the increase in 1-month inflation is concerning. Of course, as always, it’s important not to overinterpret the data from a single month. (Note, also, that the Fed uses the personal consumption expenditures (PCE) price index, rather than the CPI in evaluating whether it is hitting its 2 percent inflation target.)

As we’ve discussed in previous blog posts, Federal Reserve Chair Jerome Powell and his colleagues on the FOMC have been closely following inflation in the price of shelter. The price of “shelter” in the CPI, as explained here, includes both rent paid for an apartment or house and “owners’ equivalent rent of residences (OER),” which is an estimate of what a house (or apartment) would rent for if the owner were renting it out. OER is included to account for the value of the services an owner receives from living in an apartment or house.

As the following figure shows, inflation in the price of shelter has been a significant contributor to headline inflation. The blue line shows 12-month inflation in shelter and the red line shows 1-month inflation in shelter. Twelve-month inflation in shelter reversed the decline that began in the spring of 2023, rising from 5.0 percent in July to 5.2 percent August. One-month inflation in shelter—which is much more volatile than 12-month inflation in shelter—increased from 4.6 percent in July to 5.2 percent in August, continuing an increase that began in June. The increase in 1-month inflation in shelter may concern the members of the FOMC, as may, to a lesser extent, the increase in 12-month inflation in shelter. Shelter has a smaller weight of 15 percent in the PCE price index that the Fed uses to gauge whether it is hitting its 2 percent inflation target in contrast with the 33 percent weight that shelter has in the CPI. But persistent shelter inflation in the 5 percent range would make a soft landing more difficult.

Finally, in order to get a better estimate of the underlying trend in inflation, some economists look at median inflation and trimmed mean inflation. Median inflation is calculated by economists at the Federal Reserve Bank of Cleveland and Ohio State University. If we listed the inflation rate in each individual good or service in the CPI, median inflation is the inflation rate of the good or service that is in the middle of the list—that is, the inflation rate in the price of the good or service that has an equal number of higher and lower inflation rates. Trimmed mean inflation drops the 8 percent of good and services with the higherst inflation rates and the 8 percent of goods and services with the lowest inflation rates. 

As the following figure (from the Federal Reserve Bank of Cleveland) shows, median inflation (the orange line) declined slightly from 4.3 percent in July to 4.2 percent in August. Trimmed mean inflation (the blue line) also declined slightly from 3.3 in July to 3.2 percent in August. These data provide confirmation that core CPI inflation is likely running higher than a rate that would be consistent with the Fed achieving its inflation target.

For the past few weeks Fed officials have been indicating that the FOMC is likely to cut its target for the federal funds at its next meeting on Septembe 17-18. Investors who buy and sell federal funds futures contracts expect that the FOMC will cut its target for the federal funds rate by 0.25 percentage point from the current range of 5.50 percent to 5.25 percent. (We discuss the futures market for federal funds in this blog post.) As shown in the following figure, today these investors assign a probability of 85.0 percent to the FOMC cutting its target for the federal funds rate by 0.25 percentage point at its next meeting and a probability of only 15.0 percent that the cut will be 0.50 percentage point.

The FOMC has to balance the risk of leaving its target for the federal funds rate at its current level for too long—increasing the risk of slowing demand so much that the economy slips into recession—against the risk of cutting its target too soon—increasing the risk that inflation persists above the Fed’s 2 percent target. We’ll see at the committee’s next meeting how Fed Chair Jerome Powell and the other members assess the current state of the economy as they consider when and by how much to cut their target for the federal funds rate.

Latest CPI Report Shows Inflation Continuing to Slow

Image of “a family shopping in a supermarket” generated by ChatGTP 4o.

In testifying before Congress this week, Federal Reserve Chair Jerome Powell indicated that the Fed’s policy-making Federal Open Market Committee (FOMC) was becoming more concerned that it not be too late in reducing its target for the federal funds rate:

“[I]n light of the progress made both in lowering inflation and in cooling the labor market over the past two years, elevated inflation is not the only risk we face. Reducing policy restraint too late or too little could unduly weaken economic activity and employment.”

Powell also noted that: “more good data would strengthen our confidence that inflation is moving sustainably toward 2 percent.” Today (July 11), Powell received more good data as the Bureau of Labor Statistics (BLS) released its monthly report on the consumer price index (CPI), which showed a further slowing in inflation.

As the following figure shows, the inflation rate for June measured by the percentage change in the CPI from the same month in the previous month—headline inflation (the blue line)—was 3.o percent down from 3.3 percent in May. Core inflation (the red line)—which excludes the prices of food and energy—was 3.3 percent in June, down from 3.4 percent in May.

As the following figure shows, if we look at the 1-month inflation rate for headline and core inflation—that is the annual inflation rate calculated by compounding the current month’s rate over an entire year—the declines in the inflation rate are much larger. Headline inflation (the blue line) declined from 0.1 percent in May to –0.7 in June—consumer prices fell during June. Core inflation (the red line) declined from 2.0 percent in May to 0.8 percent in June. Overall, we can say that inflation has cooled further in June, bringing the U.S. economy closer to a soft landing—with the annual inflation rate returning to the Fed’s 2 percent target without the economy being pushed into a recession.  (Note, though, that the Fed uses the personal consumption expenditures (PCE) price index, rather than the CPI in evaluating whether it is hitting its 2 percent inflation target.)

The FOMC has been looking closely at inflation in the price of shelter. The price of “shelter” in the CPI, as explained here, includes both rent paid for an apartment or house and “owners’ equivalent rent of residences (OER),” which is an estimate of what a house (or apartment) would rent for if the owner were renting it out. OER is included to account for the value of the services an owner receives from living in an apartment or house.

As the following figure shows, inflation in the price of shelter has been a significant contributor to headline inflation. The blue line shows 12-month inflation in shelter and the red line shows 1-month inflation in shelter. Twelve-month inflation in shelter continued its decline that began in the spring of 2023. One-month inflation in shelter declined substantially from 4.9 percent in May to 2.1 percent in June. These values indicate that the price of shelter may no longer be a significant driver of headline inflation.

Finally, in order to get a better estimate of the underlying trend in inflation, some economists look at median inflation and trimmed mean inflation. Meadin inflation is calculated by economists at the Federal Reserve Bank of Cleveland and Ohio State University. If we listed the inflation rate in each individual good or service in the CPI, median inflation is the inflation rate of the good or service that is in the middle of the list—that is, the inflation rate in the price of the good or service that has an equal number of higher and lower inflation rates. Trimmed mean inflation drops the 8 percent of good and services with the higherst inflation rates and the 8 percent of goods and services with the lowest inflation rates.

As the following figure (from the Federal Reserve Bank of Cleveland) shows, both median inflation (the brown line) and trimmed mean inflation (the blue line) were somewhat higher than either headline CPI inflation or core CPI inflation. One conclusion from these data is that headline and core inflation may be somewhat understating the underlying rate of inflation.

Financial markets are interpreting the most inflation and employment data as indicating that at its meeting on Septembe 17-18 the FOMC is likely to cut its target range for the federal funds rate from the current 5.25 percent to 5.50 to 5.00 percent to 5.25 percent.

Futures markets allow investors to buy and sell futures contracts on commodities–such as wheat and oil–and on financial assets. Investors can use futures contracts both to hedge against risk—such as a sudden increase in oil prices or in interest rates—and to speculate by, in effect, betting on whether the price of a commodity or financial asset is likely to rise or fall. (We discuss the mechanics of futures markets in Chapter 7, Section 7.3 of Money, Banking, and the Financial System.) The CME Group was formed from several futures markets, including the Chicago Mercantile Exchange, and allows investors to trade federal funds futures contracts. The data that result from trading on the CME indicate what investors in financial markets expect future values of the federal funds rate to be. The following chart from the CME’s FedWatch Tool shows the current values from trading of federal funds futures.

The probabilities in the chart reflect investors’ predictions of what the FOMC’s target for the federal funds rate will be after the committee’s September meeting. The chart indicates that investors assign a probability of only 8.1 percent to the FOMC leaving its federal funds rate target unchanged at its September meeting, but a 84.6 percent probability of the committee cutting its target by 0.25 percentage point (and a 7.3 percent probability of the committee cutting its target by 0.50 percent age point).