
Join authors Glenn Hubbard and Tony O’Brien as they discuss how core economic principles illuminate two of the most pressing policy debates facing the economy today: tariffs and artificial intelligence. Drawing on a recent Supreme Court decision striking down broad tariff increases, Hubbard and O’Brien explain why economists view tariffs as taxes, who ultimately bears their burden, and how trade policy uncertainty shapes business decisions, inflation, and economic growth—bringing textbook concepts like tax incidence, intermediate goods, and GDP measurement vividly to life. The conversation then turns to AI, where they cut through market hype and dire predictions to place generative AI in historical context as a general‑purpose technology, comparing it to past innovations that transformed jobs without eliminating work. Along the way, they explore how AI can both substitute for and complement labor, why fears of mass unemployment are likely overstated, and what economists can—and cannot yet—say about AI’s long‑run effects on productivity, profits, and the labor market.
Tag: Microeconomics
Is the iPhone Air Apple’s “New Coke”?
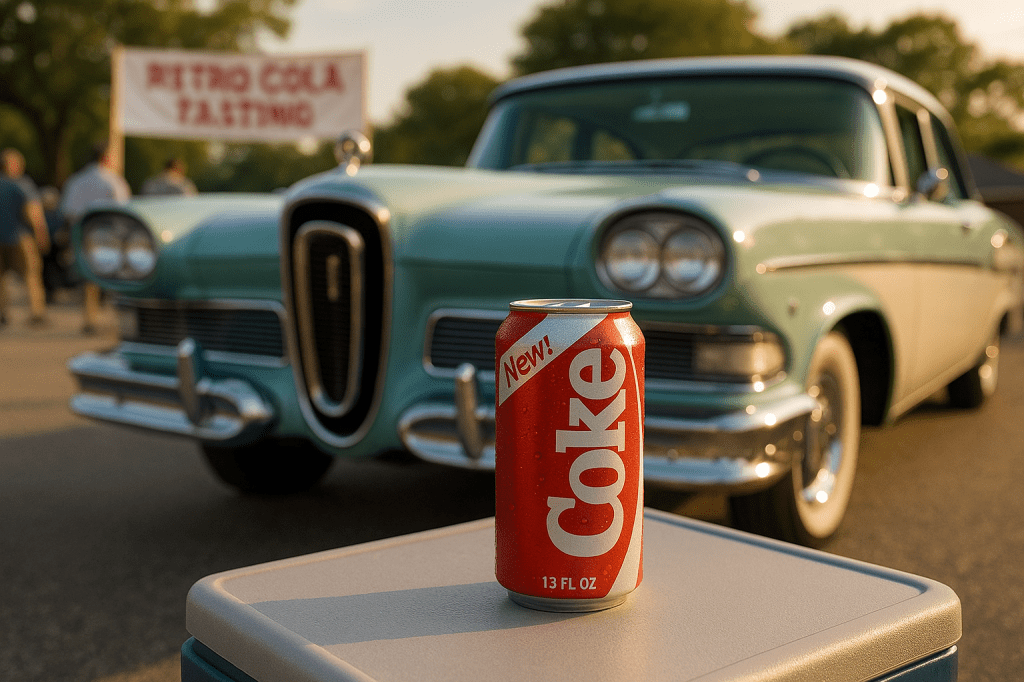
Image created by GPT
Most large firms selling consumer goods continually evaluate which new products they should introduce. Managers of these firms are aware that if they fail to fill a market niche, their competitors or a new firm may develop a product to fill the niche. Similarly, firms search for ways to improve their existing products.
For example, Ferrara Candy, had introduced Nerds in 1983. Although Nerds experienced steady sales over the following years, company managers decided to devote resources to improving the brand. In 2020, they introduced Nerds Gummy Clusters, which an article in the Wall Street Journal describes as being “crunchy outside and gummy inside.” Over five years, sales of Nerds increased from $50 millions to $500 million. Although the company’s market research “suggested that Nerds Gummy Clusters would be a dud … executives at Ferrara Candy went with their guts—and the product became a smash.”

Image of Nerds Gummy Clusters from nerdscandy.com
Firms differ on the extent to which they rely on market research—such as focus groups or polls of consumers—when introducing a new product or overhauling an existing product. Henry Ford became the richest man in the United States by introducing the Model T, the first low-priced and reliable mass-produced automobile. But Ford once remarked that if before introducing the Model T he had asked people the best way to improve transportation they would probably have told him to develop a faster horse. (Note that there’s a debate as to whether Ford ever actually made this observation.) Apple co-founder Steve Jobs took a similar view, once remaking in an interview that “it’s really hard to design products by focus groups. A lot of times, people don’t know what they want until you show it to them.” In another interview, Jobs stated: “We do no market research. We don’t hire consultants.”
Unsurprisingly, not all new products large firms introduce are successful—whether the products were developed as a result of market research or relied on the hunches of a company’s managers. To take two famous examples, consider the products shown in image at the beginning of this post—“New Coke” and the Ford Edsel.
Pepsi and Coke have been in an intense rivalry for decades. In the 1980s, Pepsi began to gain market share at Coke’s expense as a result of television commercials showcasing the “Pepsi Challenge.” The Pepsi Challenge had consumers choose from colas in two unlabeled cups. Consumers overwhelming chose the cup containing Pepsi. Coke’s management came to believe that Pepsi was winning the blind taste tests because Pepsi was sweeter than Coke and consumers tend to favor sweeter colas. In 1985, Coke’s managers decided to replace the existing Coke formula—which had been largely unchanged for almost 100 years—with New Coke, which had a sweeter taste. Unfortunately for Coke’s managers, consumers’ reaction to New Coke was strongly negative. Less than three months later, the company reintroduced the original Coke, now labeled “Coke Classic.” Although Coke produced both versions of the cola for a number of years, eventually they stopped selling New Coke.
Through the 1920s, the Ford Motor Company produced only two car models—the low-priced Model T and the high-priced Lincoln. That strategy left an opening for General Motors during the 1920s to introduce a variety of car models at a number of price levels. Ford scrambled during the 1930s and after the end of World War II in 1945 to add new models that would compete directly with some of GM’s models. After a major investment in new capacity and an elaborate marketing campaign, Ford introduced the Edsel in September 1957 to compete against GM’s mid-priced models: Pontiac, Oldsmobile, and Buick.
Unfortunately, the Edsel was introduced during a sharp, although relatively short, economic recession. As we discuss in Macroeconomics, Chapter 13 (Economics, Chapter 23), consumers typically cut back on purchases of consumer durables like automobiles during a recession. In addition, the Edsel suffered from reliability problems and many consumers disliked the unusual design, particularly of the front of the car. Consumers were also puzzled by the name Edsel. Ford CEO Henry Ford II was the grandson of Henry Ford and the son of Edsel Ford, who had died in 1943. Henry Ford II named in the car in honor of his father but the unusual name didn’t appeal to consumers. Ford ceased production of the car in November 1959 after losing $250 million, which was one of the largest losses in business history to that point. The name “Edsel” has lived on as a synonym for a disastrous product launch.

Image of iPhone Air from apple.com
Apple earns about half of its revenue and more than half of its profit from iPhone sales. Making sure that it is able to match or exceed the smartphone features offered by competitors is a top priority for CEO Tim Cook and other Apple managers. Because Apple’s iPhones are higher-priced than many other smartphones, Apple has tried various approaches to competing in the market for lower-priced smartphones.
In 2013, Apple was successful in introducing the iPad Air, a thinner, lower-priced version of its popular iPad. Apple introduced the iPhone Air in September 2025, hoping to duplicate the success of the iPad Air. The iPhone Air has a titanium frame and is lighter than the regular iPhone model. The Air is also thinner, which means that its camera, speaker, and its battery are all a step down from the regular iPhone 17 model. In addition, while the iPhone Air’s price is $100 lower than the iPhone 17 Pro, it’s $200 higher than the base model iPhone 17.
Unlike with the iPad Air, Apple doesn’t seem to have aimed the iPhone Air at consumers looking for a lower-priced alternative. Instead, Apple appears to have targeted consumers who value a thinner, lighter phone that appears more stylish, because of its titanium frame, and who are willing to sacrifice some camera and sound quality, as well as battery life. An article in the Wall Street Journal declared that: “The Air is the company’s most innovative smartphone design since the iPhone X in 2017.” As it has turned out, there are apparently fewer consumers who value this mix of features in a smartphone than Apple had expected.
Sales were sufficiently disappointing that within a month of its introduction, Apple ordered suppliers to cut back production of iPhone Air components by more than 80 percent. Apple was expected to produce 1 million fewer iPhone Airs during 2025 than the company had initially planned. An article in the Wall Street Journal labeled the iPhone Air “a marketing win and a sales flop.” According to a survey by the KeyBanc investment firm there was “virtually no demand for [the] iPhone Air.”
Was Apple having its New Coke moment? There seems little doubt that the iPhone Air has been a very disappointing new product launch. But its very slow sales haven’t inflicted nearly the damage that New Coke caused Coca-Cola or that the Edsel caused Ford. A particularly damaging aspect of New Coke was that was meant as a replacement for the existing Coke, which was being pulled from production. The result was a larger decline in sales than if New Coke had been offered for sale alongside the existing Coke. Similarly, Ford set up a whole new division of the company to produce and sell the Edsel. When Edsel production had to be stopped after only two years, the losses were much greater than they would have been if Edsel production hadn’t been planned to be such a large fraction of Ford’s total production of automobiles.
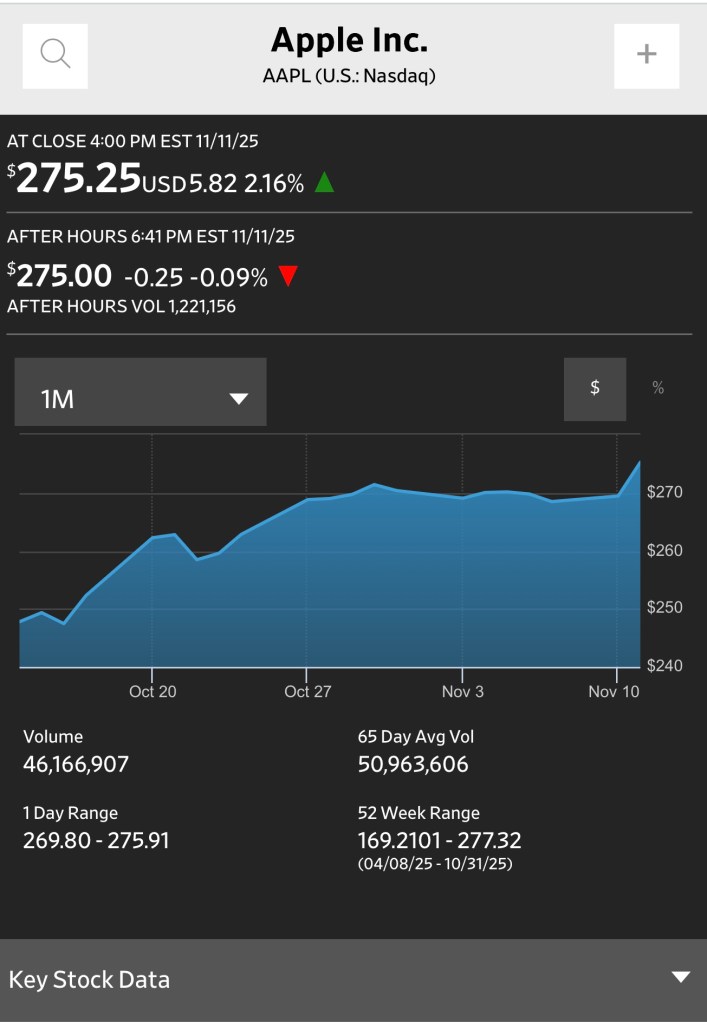
Although very slow iPhone Air sales have caused Apple to incur losses on the model, the Air was meant to be one of several iPhone models and not the only iPhone model. Clearly investors don’t believe that problems with the Air will matter much to Apple’s profits in the long run. The following graphic from the Wall Street Journal shows that Apple’s stock price has kept rising even after news of serious problems with Air sales became public in late October.
So, while the iPhone Air will likely go down as a failed product launch, it won’t achieve the legendary status of New Coke or the Edsel.
Solved Problem: Using the Demand and Supply Model to Analyze the Effects of a Tariff on Televisions
Supports: Microeconomics, Macroeconomics, Economics, and Essentials of Economics, Chapter 4, Section 4.4

Image generated by ChapGPT
The model of demand and supply is useful in analyzing the effects of tariffs. In Chapter 9, Section 9.4 (Macroeconomics, Chapter 7, Section 7.4) we analyze the situation—for instance, the market for sugar—when U.S. demand is a small fraction of total world demand and when the U.S. both produces the good and imports it.
In this problem, we look at the television market and assume that no domestic firms make televisions. (A few U.S. firms assemble limited numbers of televisions from imported components.) As a result, the supply of televisions consists entirely of imports. Beginning in April, the Trump administration increased tariff rates on imports of televisions from Japan, South Korea, China, and other countries. Tariffs are effectively a tax on imports, so we can use the analysis in Chapter 4, Section 4.4, “The Economic Effect of Taxes” to analyze the effect of tariffs on the market for televisions.
- Use a demand and supply graph to illustrate the effect of an increased tariff on imported televisions on the market for televisions in the United States. Be sure that your graph shows any shifts of the curves and the equilibrium price and quantity of televisions before and after the tariff increase.
- An article in the Wall Street Journal discussed the effect of tariffs on the market for used goods. Use a second demand and supply graph to show the effect of a tariff on imports of new televisions on the market in the United States for used televisions. Assume that no used televisions are imported and that the supply curve for used televisions is upward sloping.
Solving the Problem
Step 1: Review the chapter material. This problem is about the effect of a tariff on an imported good on the domestic market for the good. Because a tariff is a like a tax, you may want to review Chapter 4, Section 4.4, “The Economic Effect of Taxes.”
Step 2: Answer part a. by drawing a demand and supply graph of the market for televisions in the United States that illustrates the effect of an increased tariff on imported televisions. The following figure shows that a tariff causes the supply curve of televisions to shift up from S1 to S2. As a result, the equilibrium price increases from P1 to P2, while the equilibrium quantity falls from Q1 to Q2.
Step 2: Answer part b. by drawing a demand and supply graph of the market for used televisions in the United States that illustrates the effect on that market of an increased tariff on imports of new televisions. Although the tariff on imported televisions doesn’t directly affect the market for used televisions, it does so indirectly. As the article from the Wall Street Journal notes, “Today, in the tariff era, demand for used goods is surging.” Because used televisions are substitutes for new televisions, we would expect that an increase in the price of new televisions would cause the demand curve for used televisions to shift to the right, as shown in the following figure. The result will be that the equilibrium price of used televisions will increase from P1 to P2, while the equilibrium quantity of used televisions will increase from Q1 to Q2.
To summarize: A tariff on imports of new televisions increases the price of both new and used televisions. It decreases the quantity of new televisions sold but increases the quantity of used televisions sold.
The Curious Case of the GE Refrigerators
Is the refrigerator above different from the refrigerator below?
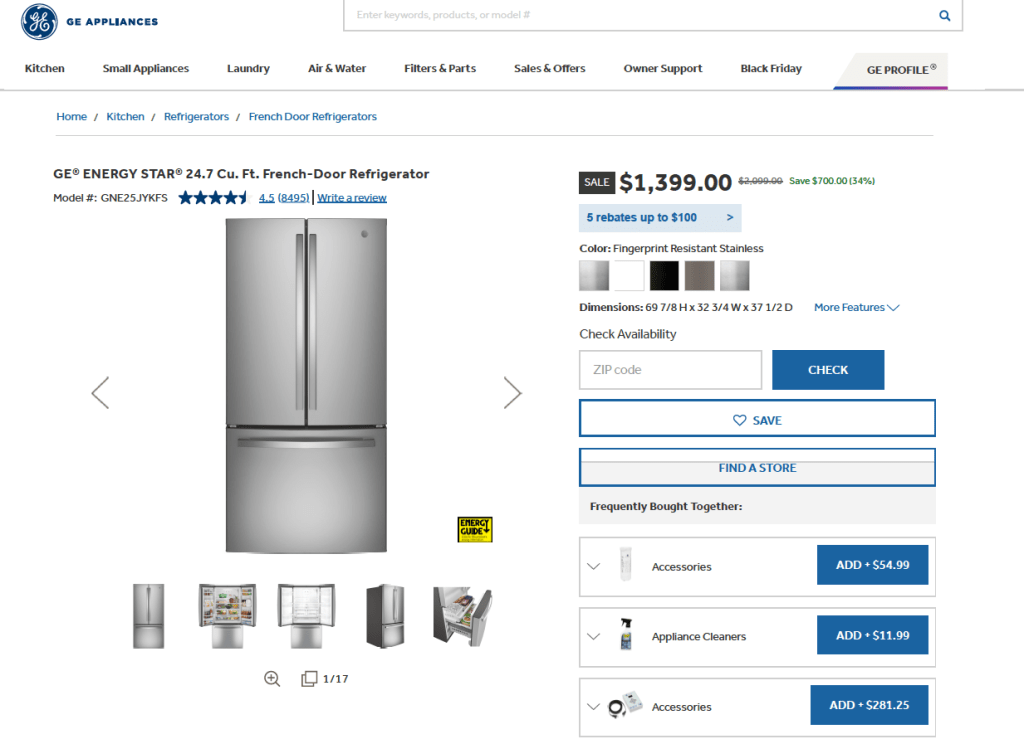
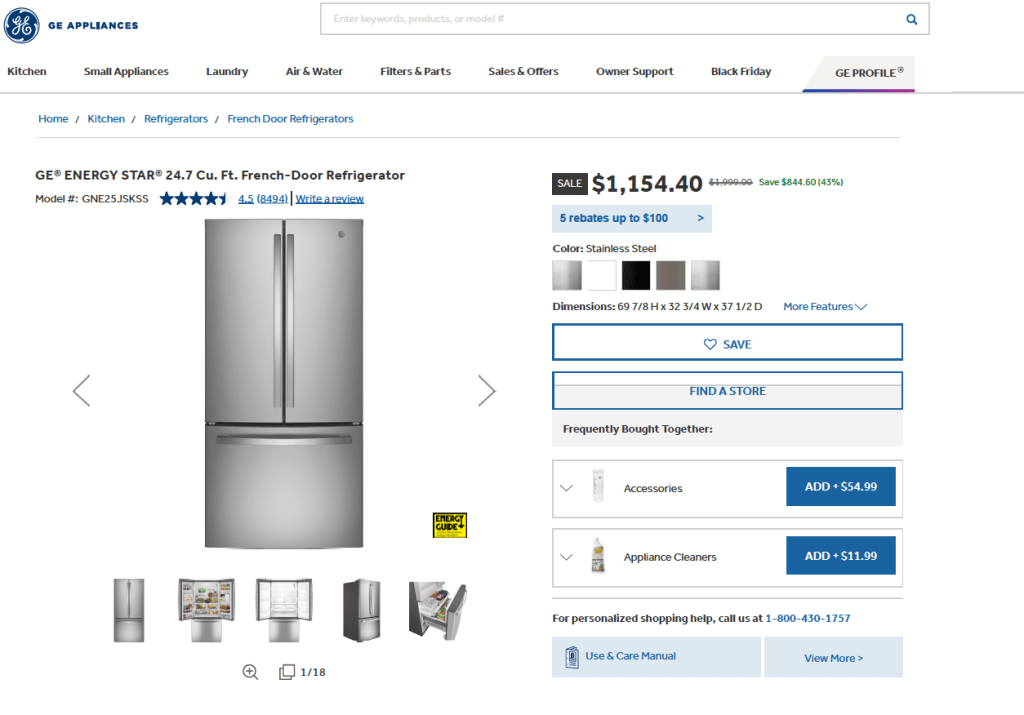
Consumer Reports is a magazine and web site devoted to product reviews. Their November-December 2024 issue noted something unusual about the two GE refrigerators shown above. (The images are from the geappliances.com web site.) At the time the issue was printed, the first refrigator above had a price of $2,300 and the second refrigerator had a price of $1,300: Consumer Reports notes that:
“These look-alike fridges offer equally impressive performance, have the same interior features … and are from the same brand. So why the $1,000 price difference? We don’t know.”
(Note: GE referigators, and many other products branded with the GE name are no longer produced by the General Electric company, which dates back to 1892 and was co-founded by Thomas Edison. Today, GE is primarily an aerospace company and GE appliances are produced by the Chinese-owned Haier Smart Home Company.)
If we assume that Consumer Reports is correct and the two refrigerators are identical, what strategy is the firm pursuing by charging different prices for the same product? As we discuss in Microeconomics, Chapter 15, Section 15.5 firms can increase their profits by practicing price discrimination—charging different prices to different customers. To pursue a strategy of price discrimination the firm needs to be able to divide up—or segment—the market for its refrigerators.
Firms sometimes use a high price to signal quality. The old saying “you get what you pay for” can lead some consumers to expect that when comparing two similar goods, such as two models of refrigerators, the one with the higher price also has higher quality. In the appliance section of a large store, such as Lowe’s or the Home Depot, or online at Amazon or another site, you will have a wide variety of refrigerators to choose from. You may have trouble evaluating the features each model offers and be unable to tell whether a particular model is likely to be more or less reliable. So, if you are choosing between the two GE models shown above, you may decide to choose the one with the higher price because the higher price may indicate that the components used are of higher quality.
In this case, GE may be relying on a segmentation in the market between consumers who carefully research the features and the quality of the refrigerators that different firms offer for sale and those consumers don’t. The consumers who do careful research and are aware of all the features of each model may be more sensitive to the price and, therefore, have a high price elasticity of demand. The consumers who haven’t done the research may be relying on the price as a signal of quality and, therefore, have a lower price elasticty of demand.
If what we have just outlined was the firm’s strategy for increasing profit by charging different prices for two models that are, apparently, either identical or very similar, it doesn’t seem to have worked. Note that the model shown in the first photo above is the one that had a price of $2,300 when Consumer Reports wrote about it, but now has a price of $1,154.40. The model shown in the second photo had a price of $1,300, but now has a price of $1,399.00. In other words, the model that had the lower price now has the higher price and the model that had the higher price now has the lower price.
What happened between the time the issue of Consumer Reports published and now? We might conjecture that there are few consumers who would be likely to pay $1,000 more for a refrigator that seems to have the same features as another model from the same company. In other words, segmenting consumers in this way seems unlikely to succeed. Why, though, the firm decided to make its formerly higher-price model its lower-price model, is difficult to explain without knowing more about the firm’s pricing strategy.
Solved Problem: When to Close a Sandwich Shop
Supports: Microeconomics and Economics, Chapter 12, and Essentials of Economics, Chapter 9.

Photo from the Wall Street Journal.
A recent article in the Los Angeles Times discussed the problems faced by the owners of a sandwich shop in the Chinatown neighborhood of Los Angeles. The owners had closed the shop and then decided to reopen it. The article quoted one of the owners as saying: “After closing [the shop] we realized we still have our lease, we still have our loans from the [federal government’s Small Business Association], from COVID, the bills are still coming in. We can’t even afford to close. We can’t afford to be open, we can’t afford to be closed.”
a. What does the owner of the sandwich shop mean by saying they can’t afford to be open but they also can’t afford to be closed? Answer by explaining what the likely relationship is between the revenue the owners were earning from the shop and the shop’s fixed, variable, and total costs .
b. Are the owners likely to keep the sandwich shop open in the long run? Briefly explain.
Solving the Problem
Step 1: Review the chapter material. This problem is about when a firm should decide to shut down in the short run, so you may want to review the section “Deciding Whether to Produce or to Shut Down in the Shortrun” in Microeconomics (and Economics), Chapter 12, Section 12.4, (Essentials of Economics, Chapter 9, Section 9.4).
Step 2: Answer part a. by explaining what the sandwich shop’s owner meant by her statement, using the likely relationship between the shop’s revenue and its fixed, variable, and total cost in your explanation. That the owner states that “we can’t afford to be open” indicates that the firm is incurring a loss, so the revenue from the shop is less than the toal cost of operating it. But after closing the shop, the owners reopened it because “we can’t afford to be closed.” That statement indicates that the owners will incur a smaller loss by operating the shop than by keeping it closed. If the shop is closed, the owners still have to pay the shop’s fixed costs, such as the rent on the shop and the payments the owners must make on loans. We can infer that the loss from remaining open is less than the loss from being closed. In that situation, the shop’s revenue must be enough to cover the variable cost of operating it, although not enough to cover the total cost.
Step 3: Answer part b. by explaining whether the owners are likely to keep the sandwich shop open in the long run. By definition, in the long run, the owners will no longer have any fixed costs because the period of its lease will have ended and it will have paid off its loans—or possibly defaulted on them. If the revenue from operating the shop remains less than the total cost of operating it in the long run, the owners will permanenly close the shop.
9/16/23 Podcast – Authors Glenn Hubbard & Tony O’Brien discuss inflation, the current status of a soft-landing, and the green economy.
Join authors Glenn Hubbard & Tony O’Brien as they discuss the economic landscape of inflation, soft-landings, and the green economy. This conversation occurred on Saturday, 9/16/23, prior to the FOMC meeting on September 19th-20th.
4/29/23 Podcast – Authors Glenn Hubbard & Tony O’Brien discuss a hard vs. soft landing, the debt ceiling, and an economics view of the CHIPS act passed in 2022.
Join authors Glenn Hubbard & Tony O’Brien as they discuss the state of the landing the economy will achieve – hard vs. soft – or “no landing”. Also, they address the debt ceiling and the barriers it might present to a recovery. We also delve into the Chips Act and what economics has to say about the subsidy of a particular industry. Gain insights into today’s economy through our final podcast of the 2022-2023 academic year! Our discussion covers these points but you can also check for updates on our blog post that can be found HERE .
Card, Angrist, and Imbens Win Nobel Prize in Economics


David Card of the University of California, Berkeley; Joshua Angrist of the Massachusetts Institute of Technology; and Guido Imbens of Stanford University shared the 2021 Nobel Prize in Economics (formally, the Sveriges Riksbank Prize in Economic Sciences in Memory of Alfred Nobel). Card received half of the prize of 10 million Swedish kronor (about 1.14 million U.S. dollars) “for his empirical contributions to labor economics,” and Angrist and Imbens shared the other half “for their methodological contributions to the analysis of causal relationships.” (In the work for which they received the prize, all three had collaborated with the late Alan Krueger of Princeton University. Card was quoted in the Wall Street Journal as stating that: “I’m sure that if Alan was still with us that he would be sharing this prize with me.”)
The work of the three economists is related in that all have used natural experiments to address questions of economic causality. With a natural experiment, economists identify some variable of interest—say, an increase in the minimum wage—that has changed for one group of people—say, fast-food workers in one state—while remaining unchanged for another similar group of people—say, fast-food workers in a neighboring state. Researchers can draw an inference about the effects of the change by looking at the difference between the outcomes for the two groups. In this example, the difference between changes in employment at fast-food restaurants in the two states can be used to measure the effect of an increase in the minimum wage.
Using natural experiments is an alternative to the traditional approach that had dominated empirical economics from the 1940s when the increased availability of modern digital computers made it possible to apply econometric techniques to real-world data. With the traditional approach to empirical work, economists would estimate structural models to answer questions about causality. So, for instance, a labor economist might estimate a model of the demand and supply of labor to predict the effect of an increase in the minimum wage on employment.
Over the years, many economists became dissatisfied with using structural models to address questions of economic causality. They concluded that the information requirements to reliably estimate structural models were too great. For instance, structural models require assumptions about the functional form of relationships, such as the demand for labor, that are not inferable directly from economic theory. Theory also did not always identify all variables that should be included in the model. Gathering data on the relevant variables was sometimes difficult. As a result, answers to empirical questions, such as the employment effects of the minimum wage, differed substantially across studies. In such cases, policymakers began to see empirical economics as an unreliable guide to economic policy.
In a famous study of the effect of the minimum wage on employment published in 1994 in the American Economic Review, Card and Krueger pioneered the use of natural experiments. In that study, Card and Krueger analyzed the effect of the minimum wage on employment in fast-food restaurants by comparing what happened to employment in New Jersey when it raised the state minimum wage from $4.25 to $5.05 per hour with employment in eastern Pennsylvania where the minimum wage remained unchanged. They found that, contrary to the usual analysis that increases in the minimum wage lead to decreases in the employment of unskilled workers, employment of fast-food workers in New Jersey actually increased relative to employment of fast-food workers in Pennsylvania.
The following graphic from Nobel Prize website summarizes the study. (Note that not all economists have accepted the results of Card and Krueger’s study. We briefly summarize the debate over the effects of the minimum wage in Chapter 4, Section 4.3 of our textbook.)

Drawing inferences from natural experiments is not as straightforward as it might seem from our brief description. Angrist and Imbens helped develop the techniques that many economists rely on when analyzing data from natural experiments.
Taken together, the work of these three economists represent a revolution in empirical economics. They have provided economists with an approach and with analytical techniques that have been applied to a wide range of empirical questions.
For the annoucement from the Nobel website click HERE.
For the article in the Wall Street Journal on the prize click HERE (note that a subscription may be required).
For the orignal Card and Krueger paper on the minimum wage click HERE.
For David Card’s website click HERE.
For Joshua Angrist’s website click HERE.
For Guido Imbens’s website click HERE.
4/17/20 Podcast – Glenn Hubbard & Tony O’Brien discuss the Federal Reserve response and toilet paper shortages.
On April 17th, Glenn Hubbard and Tony O’Brien continued their podcast series by spending just under 30 minutes discuss varied topics such as the Federal Reserve’s monetary response, record unemployment numbers, panic buying of toilet paper as compared to bank runs, as well as recent books they’ve been reading with increased downtime from the pandemic.
COVID-19 Update – How Will the Coronavirus Pandemic Affect the Airline Industry?
Supports: Chapter 12 in Economics and Microeconomics – Firms in Perfectly Competitive Markets; Essentials Chapter 9.
SOLVED PROBLEM: HOW WILL THE CORONAVIRUS PANDEMIC AFFECT THE AIRLINE INDUSTRY?
During the coronavirus pandemic, many airlines experienced a sharp decline in ticket sales. Some airlines responded by cutting ticket prices to very low levels. For example, in early March, Frontier Airlines was offering round-trip tickets from New York City to Miami for $51 (compared to over $200 three months earlier). As one columnist in the Wall Street Journal put it, the price of many airline tickets was “cheaper than dinner or what you’ll spend on Ubers or taxis.”
- Briefly explain whether it was likely that the price Frontier was charging was high enough to cover the average total cost of a flying an airplane from New York City to Miami. Why was Frontier willing to accept such a low price? Would the airline be willing to accept such a low price in the long run?
- Some airlines believed that even after the pandemic was over, consumers might not be willing to fly on planes as crowded as they were prior to the pandemic. Accordingly, airlines were considering either flying planes with some rows kept empty or reconfiguring planes to have more space between rows—and therefore fewer seats per plane. Briefly explain what effect having fewer seats per airplane might have on the price of an airline ticket.
Sources: Jonathan Roeder, “NYC to Miami for $51: Coronavirus Slump Leads to Steep Airfare Discounts,” bloomberg.com, March 5, 2020; and Scott McCartney, “There Are Plenty of Coronavirus Flight Deals Out There, But Think Before You Buy,” Wall Street Journal, March 25, 2020.
Solving the Problem
Step 1: Review the chapter material. This problem is about the break-even price for a firm in the short run and in the long run, so you may want to review Chapter 12, Section 12.4 “Deciding Whether to Produce or to Shut Down in the Short Run” and Section 12.5 “‘If Everyone Can Do It, You Can’t Make Money at It’: The Entry and Exit of Firms in the Long Run.”. In Hubbard/O’Brien, Essentials of Economics, it is Chapter 9.
Step 2: Answer part a. by explaining why even though a ticket price of $51 was unlikely to cover the average total cost of the flight, Frontier Airlines was still willing to accept such a low ticket price—but only in the short run. As we’ve seen in Section 12.5, competition among firms drives the price of a good to equal the average total cost of the typical firm. Assuming that ticket prices prior to the pandemic equaled average total cost, then the low ticket prices in the spring of 2020 must have been below average total cost. We have also seen, though, that firms will continue to produce in the short run provided they receive a price equal to or greater than average variable cost. For a particular flight, the fixed cost—primarily the cost of aviation fuel and the salaries of the flight crew—is much greater than the variable cost—additional meals served, somewhat more fuel used because more passengers make the plane heavier, and possibly an additional flight attendant needed to assist additional passengers. So, the $51 ticket price may have been enough for Frontier to cover its average variable cost. The airline would not accept such a low price in the long run, though, because in the long run it would need to cover all of its costs or it would no longer fly the route. (Note: In the short run, an airline might have another reason to continue to fly planes on a route even if it is unable to cover the average total cost of a flight. The contracts that airlines have with airports sometimes require a specified number of flights each day in order for the airline to retain the right to use certain airport gates.)
Step 3: Answer part b. by explaining the effect that having fewer seats per airplane would have on airline ticket prices. For an airline to break even on a flight, its total revenue from the flight must equal its total cost. Flying fewer seats per plane will not greatly reduce the airline’s cost of the flight because, as noted in the answer to part b., most of the cost of a flight is fixed and so the total cost of a flight doesn’t vary much with the number of passengers on the flight. But flying half as many passengers—if every other row is left empty—will significantly decrease the revenue the airline earns from the flight. To increase revenue on the flight, the airline would have to increase the price of a ticket. We can conclude that if airlines decide to fly planes equipped with fewer seats, ticket prices are likely to rise. Note that if on some routes the demand for tickets is price elastic, raising the price will reduce revenue and the airline will be unable to cover its cost of flying the route.
