Photo from federalreserve.gov
Federal Reserve chairs often take the opportunity of the Kansas City Fed’s annual monetary policy symposium held in Jackson Hole, Wyoming to provide a summary of their views on monetary policy and on the state of the economy. In these speeches, Fed chairs are careful not to preempt decisions of the Federal Open Market Committee (FOMC) by stating that policy changes will occur that the committee hasn’t yet agreed to. In his speech at Jackson Hole today (August 22), Powell came about as close as Fed chairs ever do to announcing a policy change in a speech. In addition, Powell announced changes to the Fed’s monetary policy framework that had been in place since 2020.
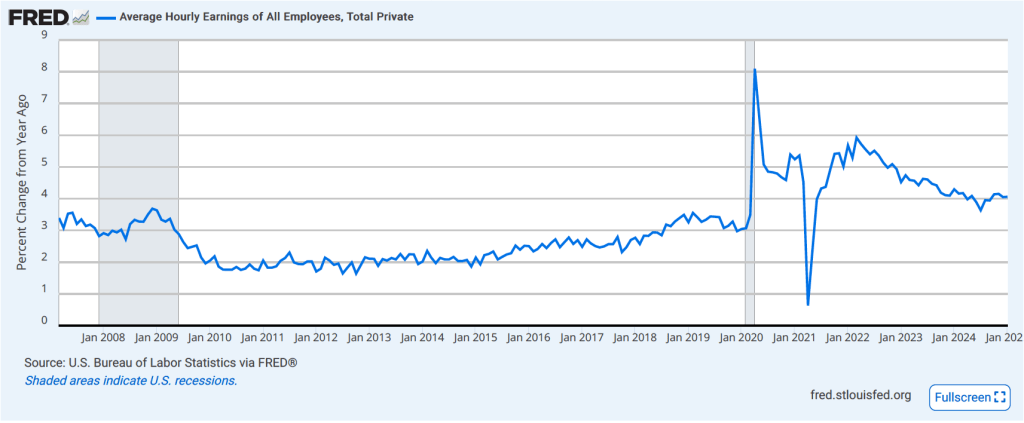
Congress has given the Federal Reserve a dual mandate to achieve price stability and maximum employment. To reach its goal of price stability, the Fed has set an inflation target of 2 percent, with inflation being measured by the percentage change in the personal consumption expenditures (PCE) price index. In the statement that the FOMC releases after each meeting, it generally indicates the current “balance of risks” to meeting its two goals. In a press conference on July 30 following the last meeting of the FOMC, Powell stated that while the labor market appeared to be in balance at close to maximum employment, inflation was still running above the Fed’s 2 percent annual target.
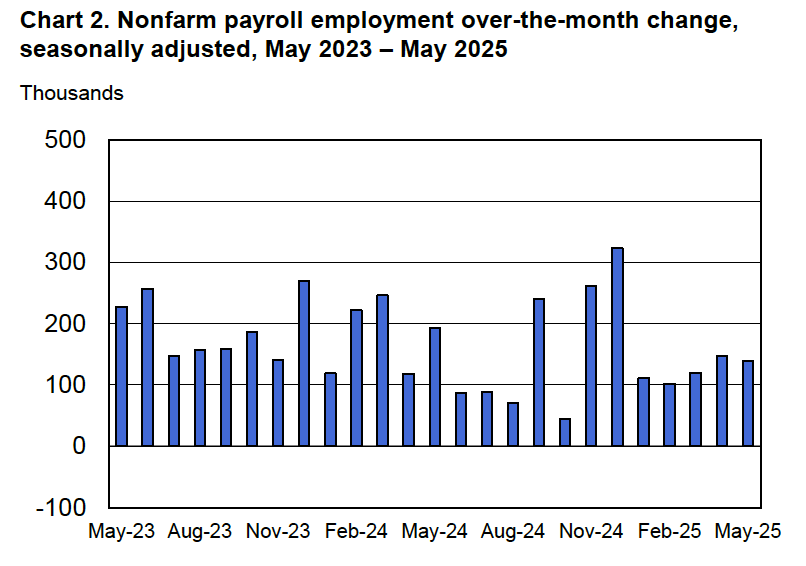
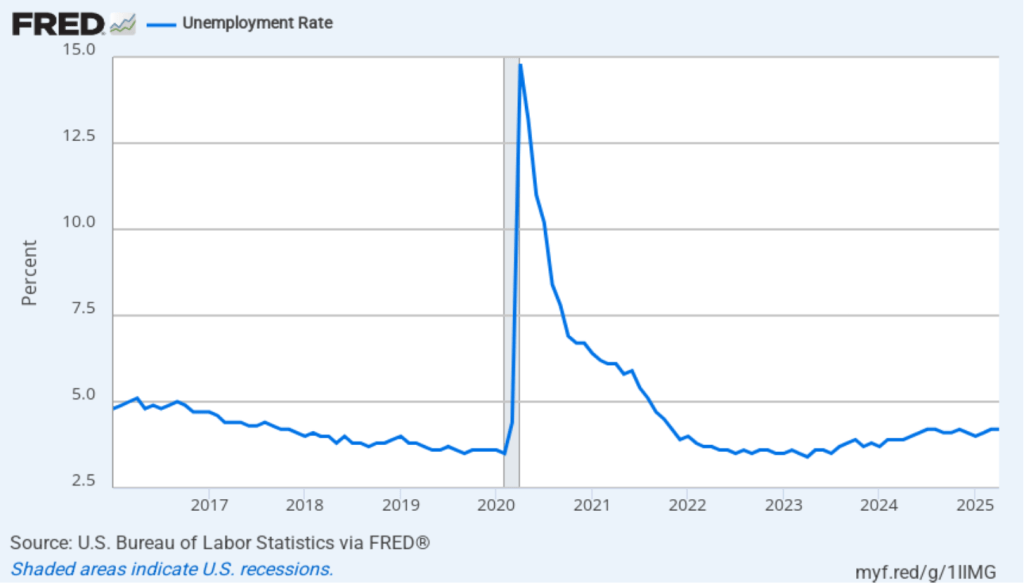
In today’s speech, Powell stated that “the balance of risks appears to be shifting” and “that downside risks to employment are rising. And if those risks materialize, they can do so quickly in the form of sharply higher layoffs and rising unemployment.” These statements seem to signal that he expects that at its next meeting on September 16–17 the FOMC will cut its target for the federal funds rate from its current range of 4.25 percent to 4.50 percent.
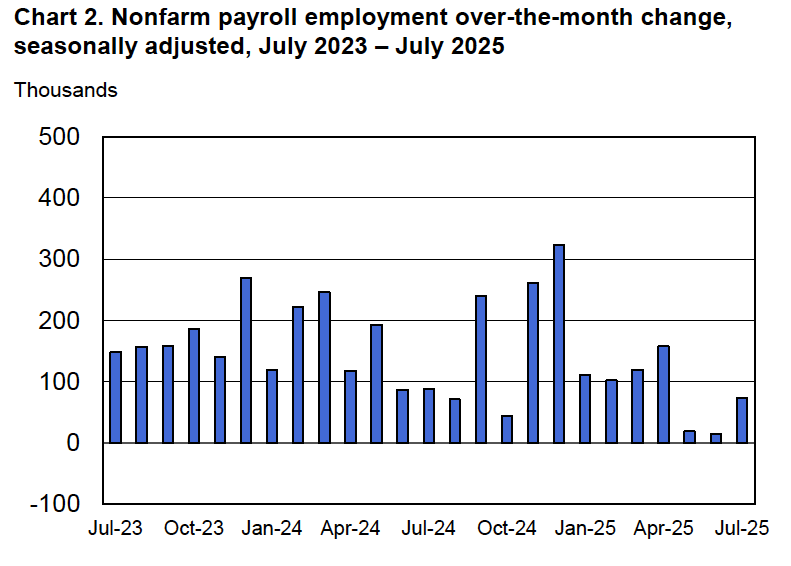
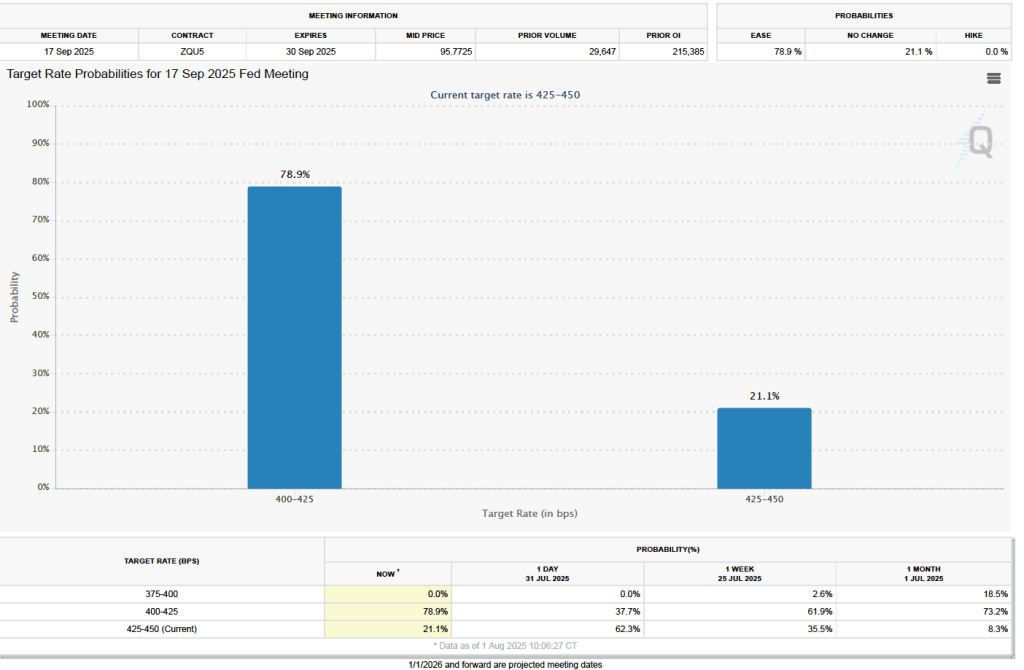
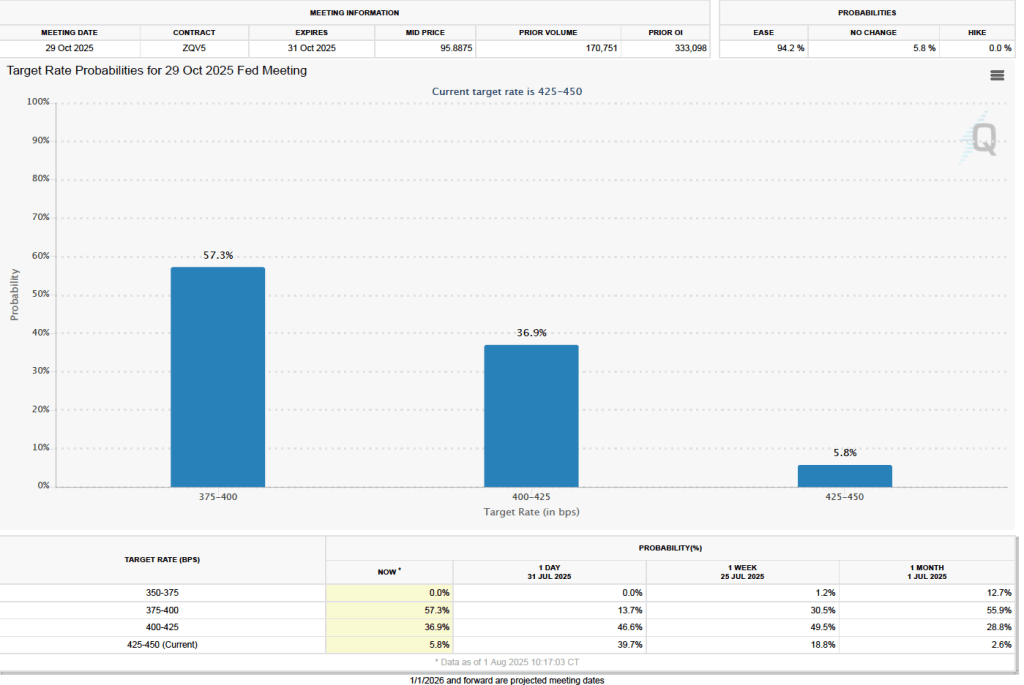
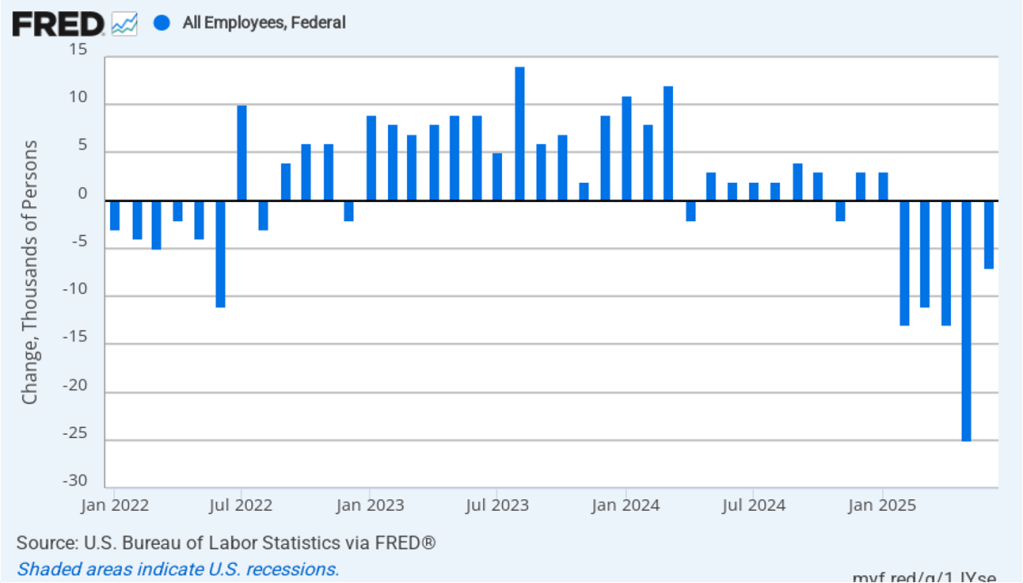
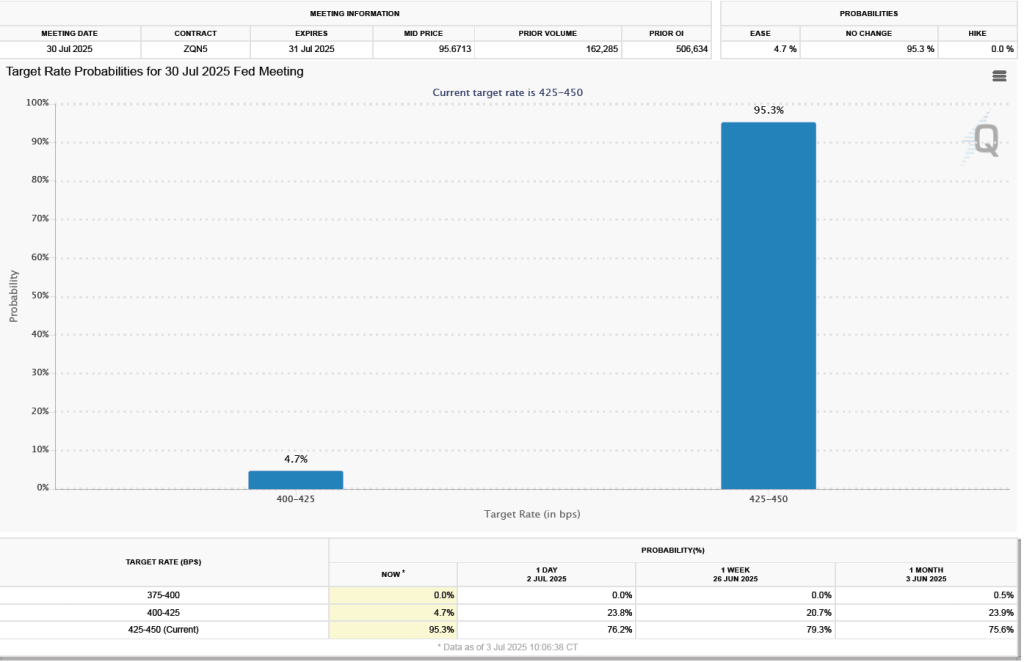
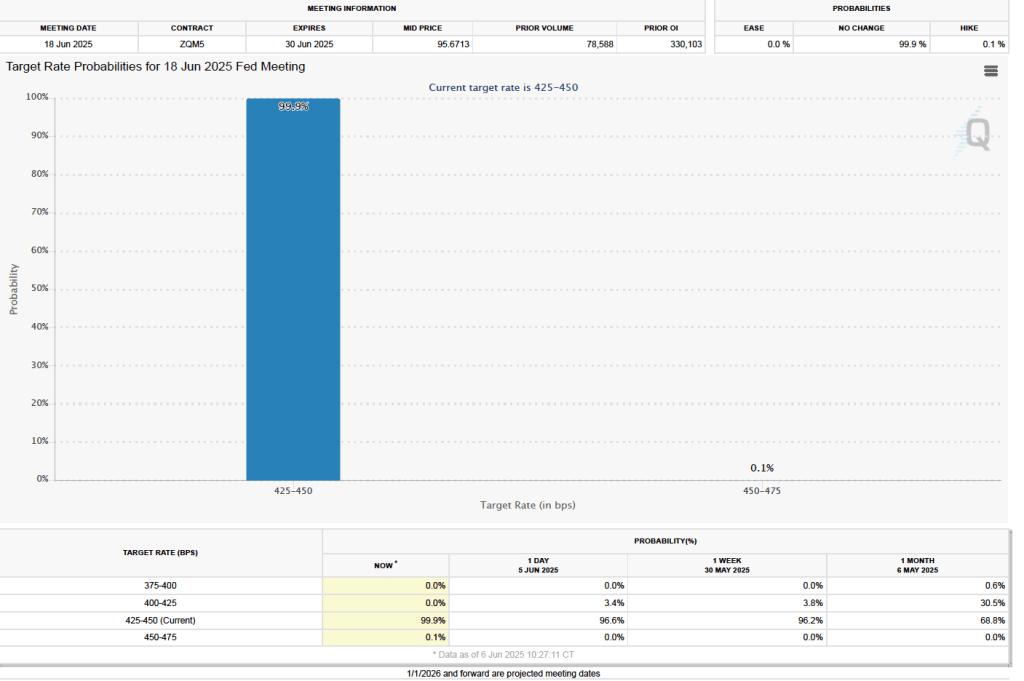
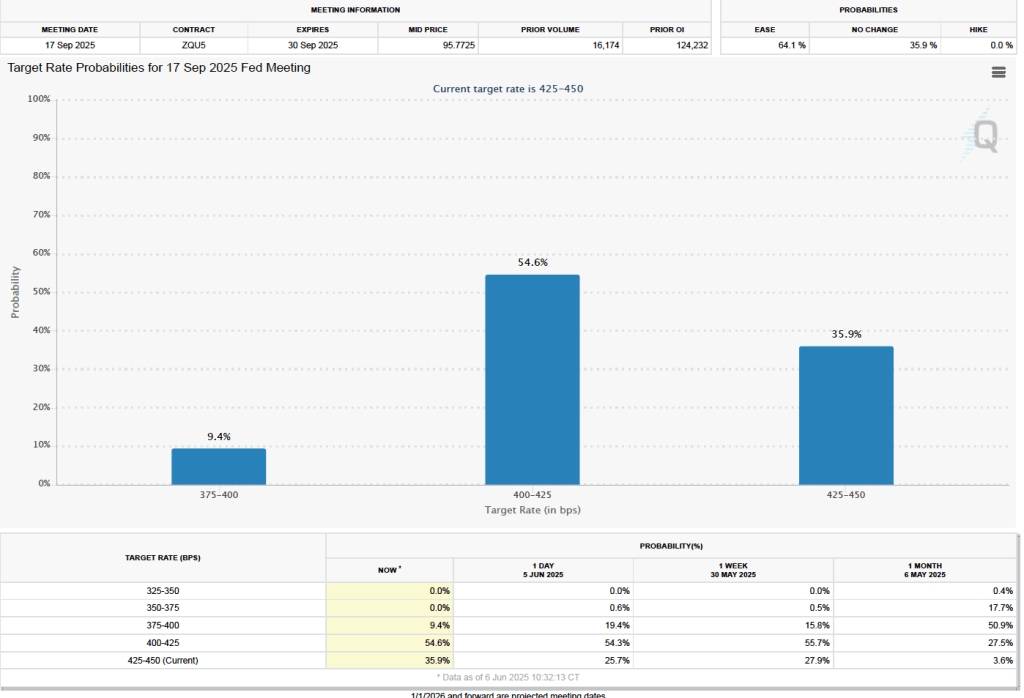
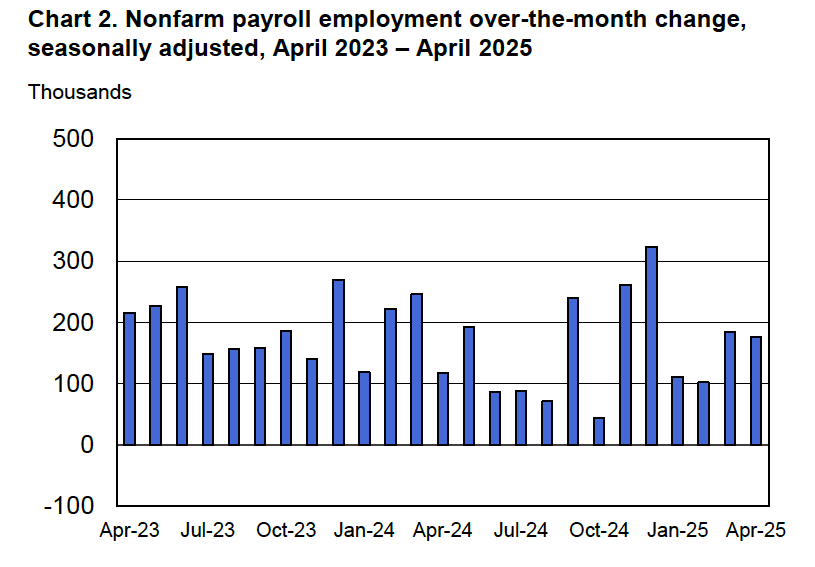
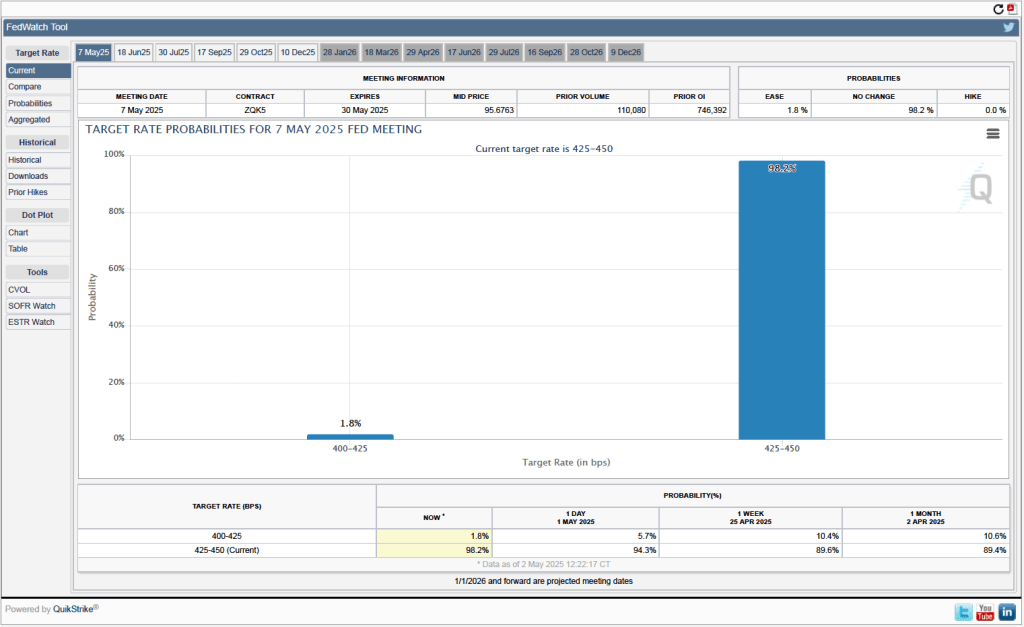
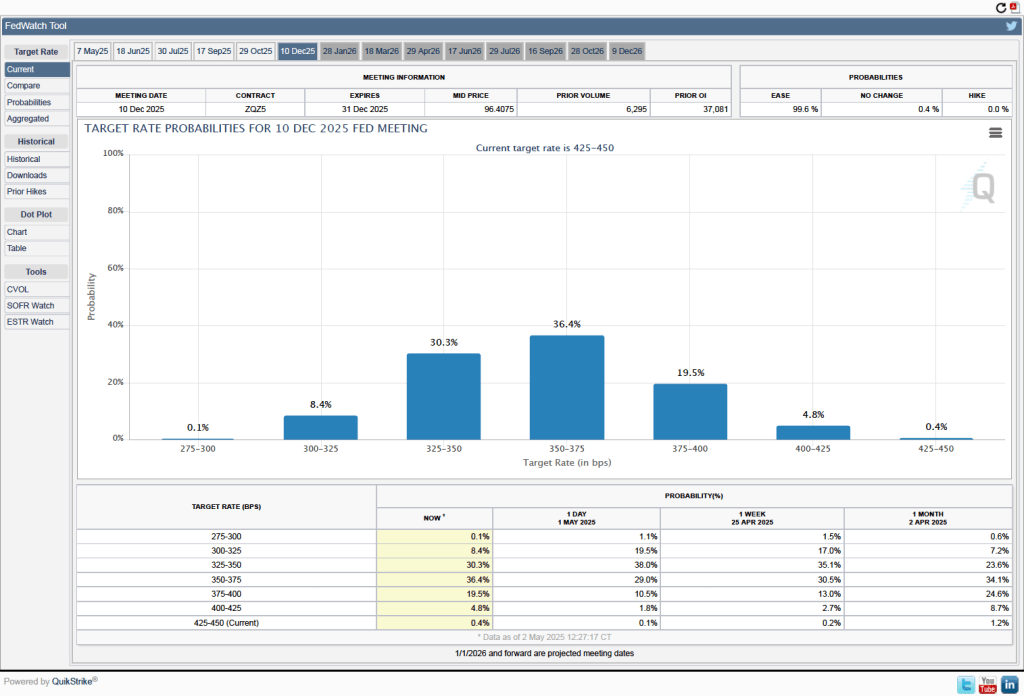
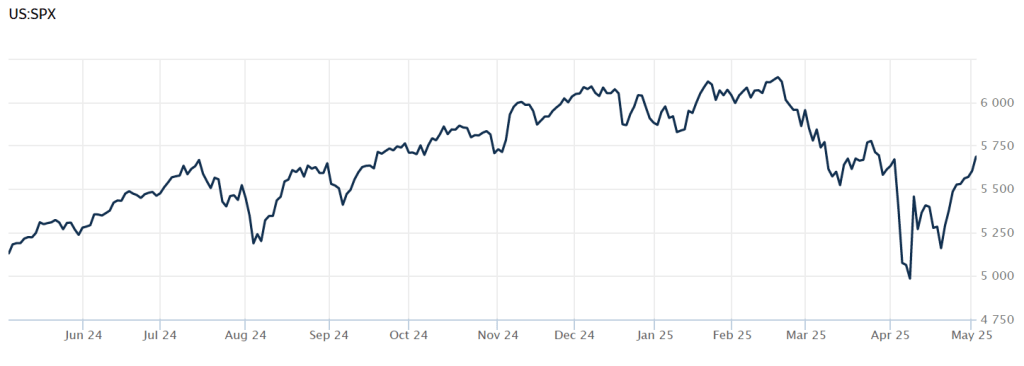
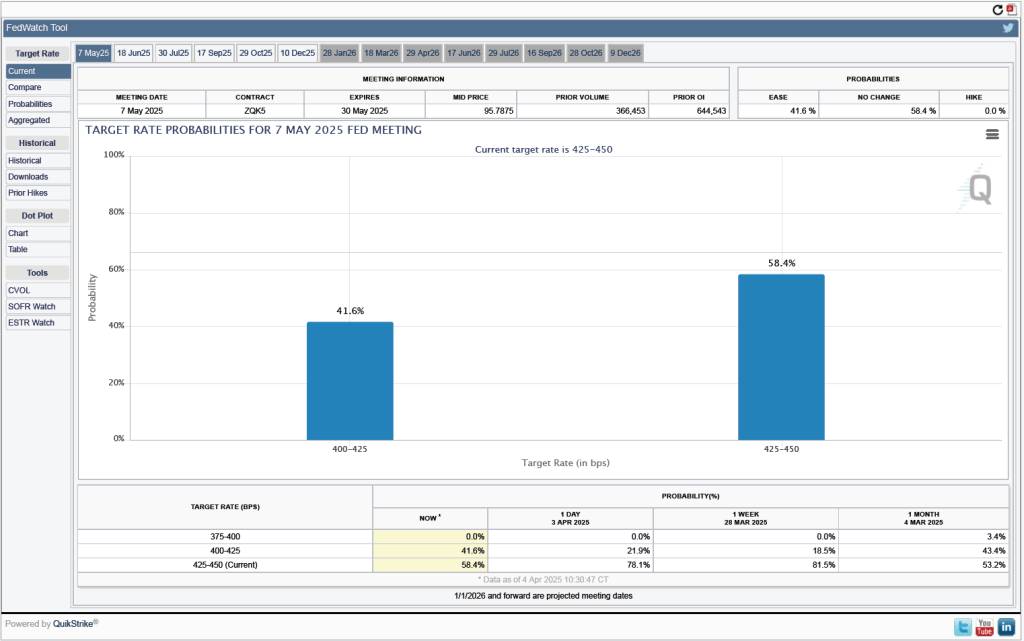
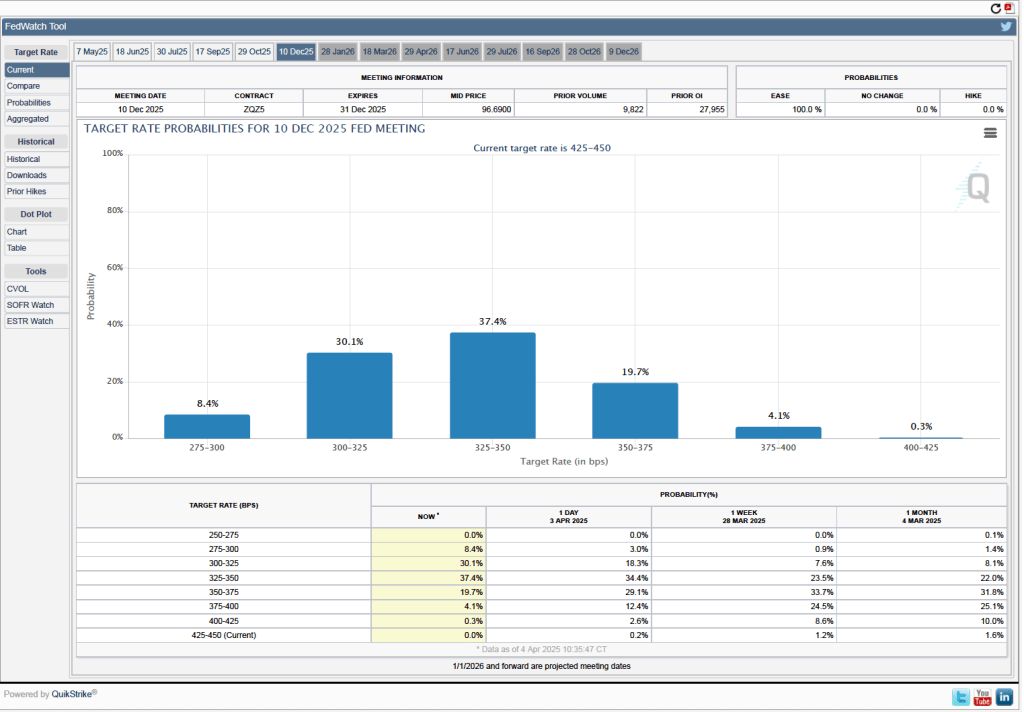
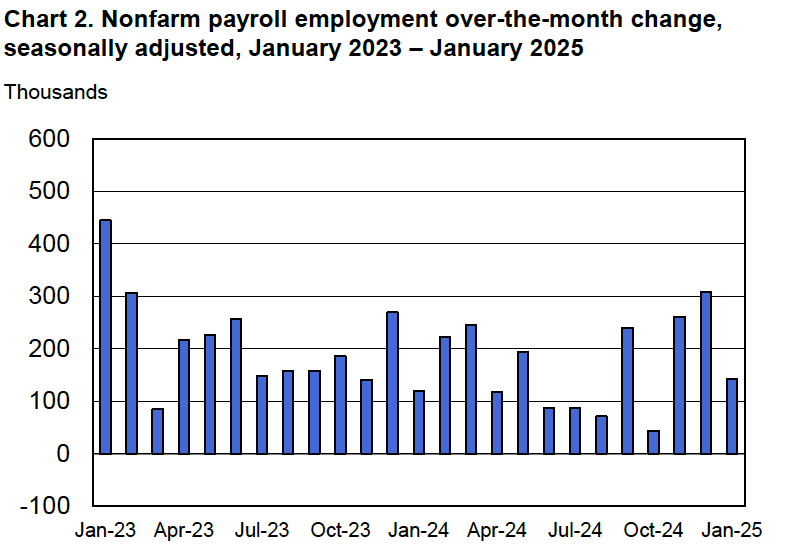
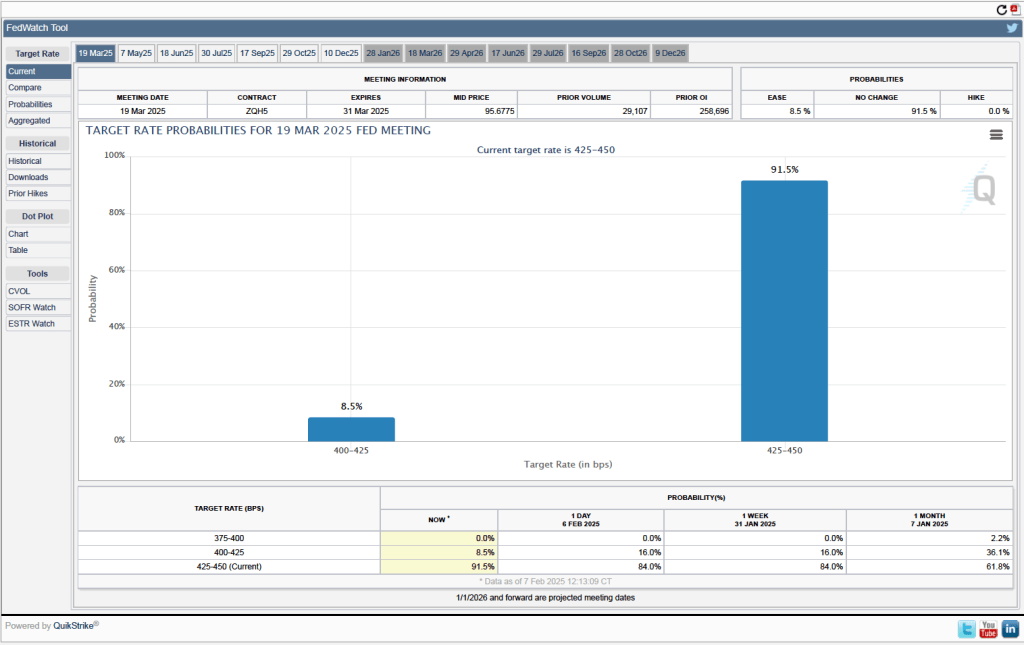
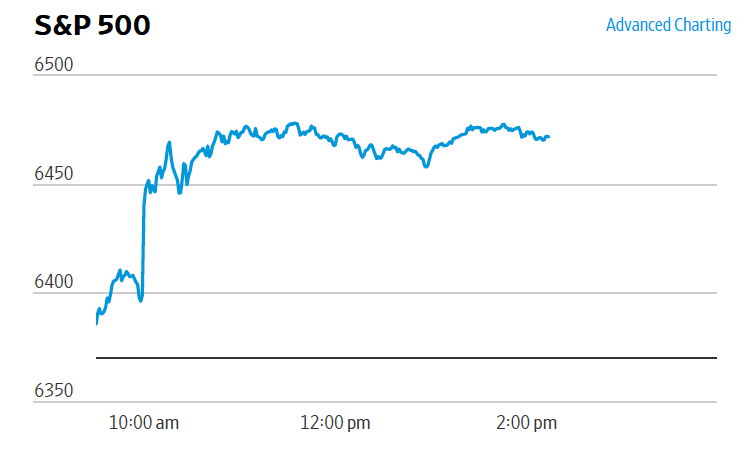
One indication of expectations of future changes in the FOMC’s target for the federal funds rate comes from investors who buy and sell federal funds futures contracts. (We discuss the futures market for federal funds in this blog post.) Yesterday, investors assigned a 75.0 percent probability to the committee cutting its target by 0.25 percentage point (25 basis points) to a range of 4.00 percent to 4.25 percent at its September meeting. After Powell’s speech at 10 a.m. eastern time, the probability of a 25 basis point cut increased to 85.3 percent. As the following figure from the Wall Street Journa shows, the stock market also jumped, with the S&P 500 stock index having increased about 1.5 percent at 2:00 p.m. Investors were presumably expecting that by cutting its federal funds rate target, the FOMC would help to offset some of the current weakness in the labor market. (We discussed the weakness in the latest jobs report in this blog post.)
Powell also announced that the Fed had revised its monetary policy framework, which had been in place since 2020. The previous framework was called flexible average-inflation targeting (FAIT). The policy was intended to automatically make monetary policy expansionary during recessions and contractionary during periods of unexpectedly high inflation. If households and firms accept that the Fed is following this policy, then during a recession when the inflation rate falls below the target, they would expect that the Fed would take action to increase the inflation rate. If a higher inflation rate results in a lower real interest rate, there will be an expansionary effect on the economy. Similarly, if the inflation rate were above the target, households and firms would expect future inflation rates to be lower, raising the real interest rate, which would have a contractionary effect on the economy.
An important point to note is that with a FAIT policy, after a period in which inflation is below 2%, the Fed would aim to keep inflation above 2% for a time to “make up” for the period of low inflation. But the converse would not be true—if inflation runs above 2%, the Fed would attempt to bring the inflation back to 2%, but would not push inflation below 2% for a time to make up for the period of low inflation. The result is that, on average, the economy would run “hotter,” lowering the average unemployment rate over time. Many policymakers at the Fed believed that, in the years before 2019, the unemployment could have been lower without causing the inflation rate to be persistently above the Fed’s target.
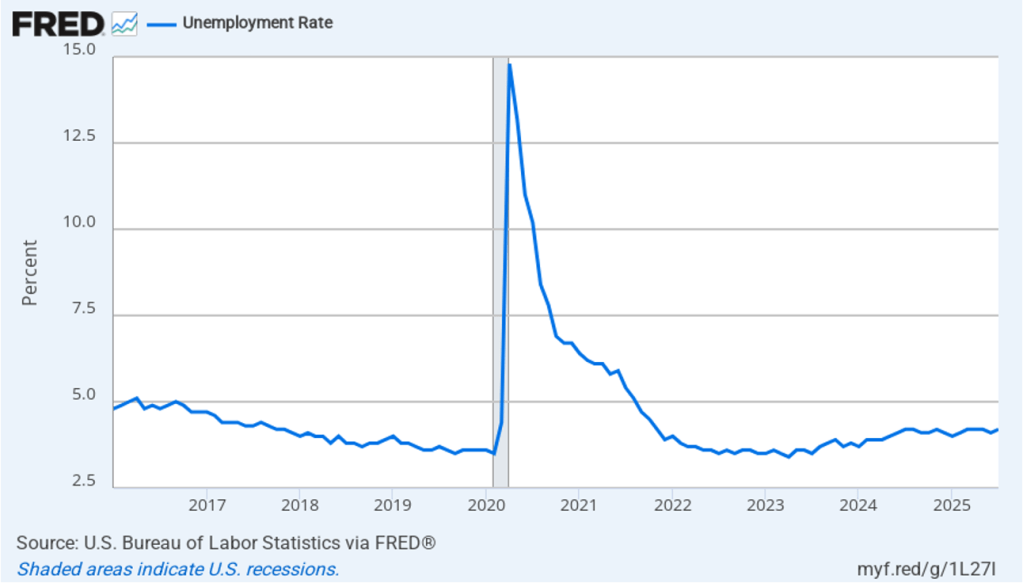
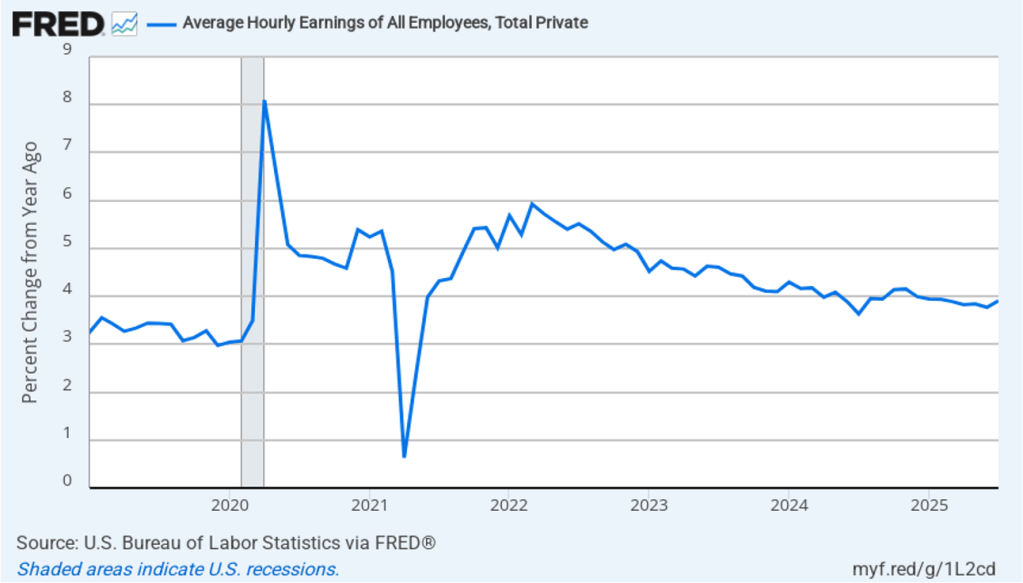
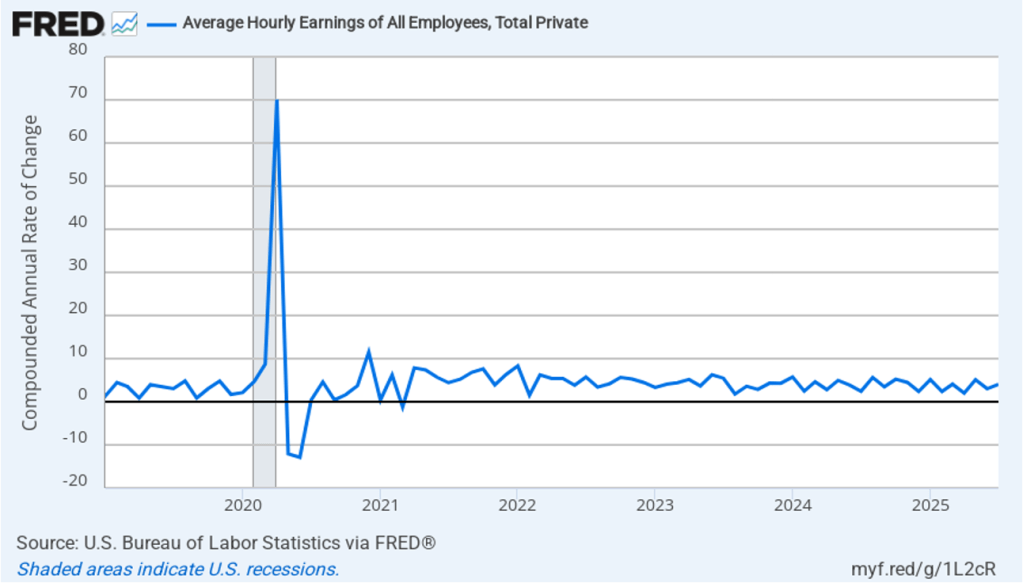
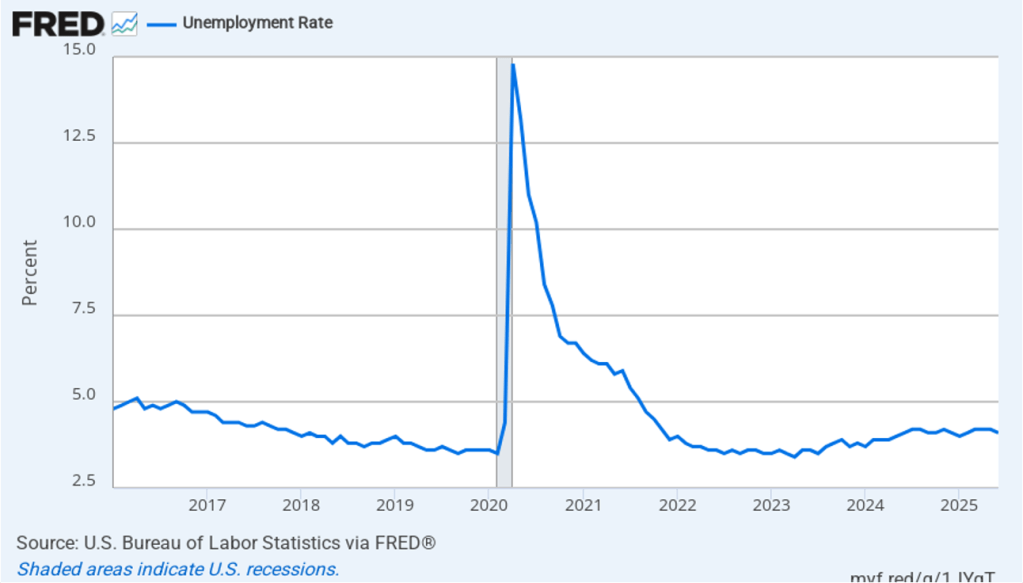
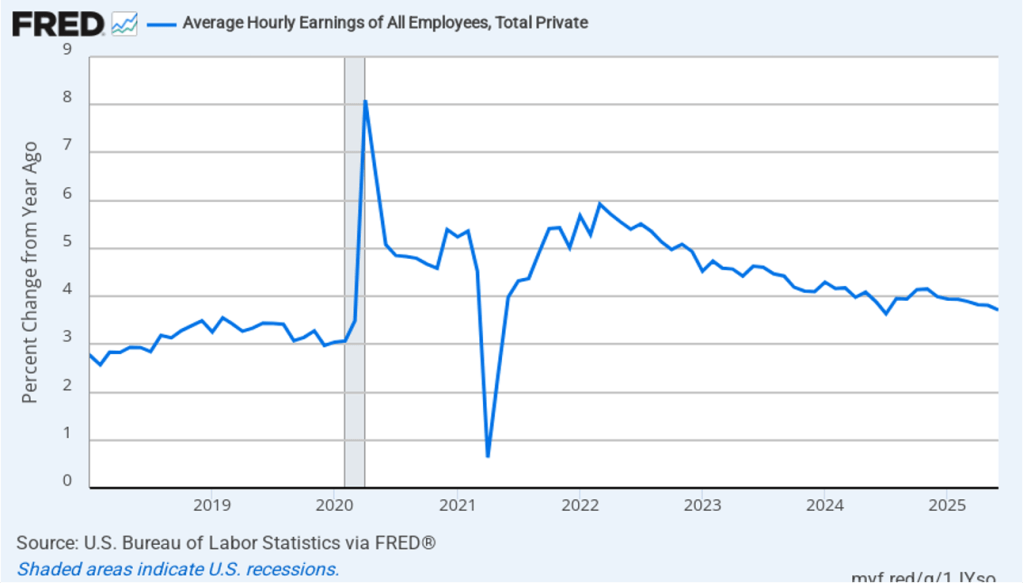
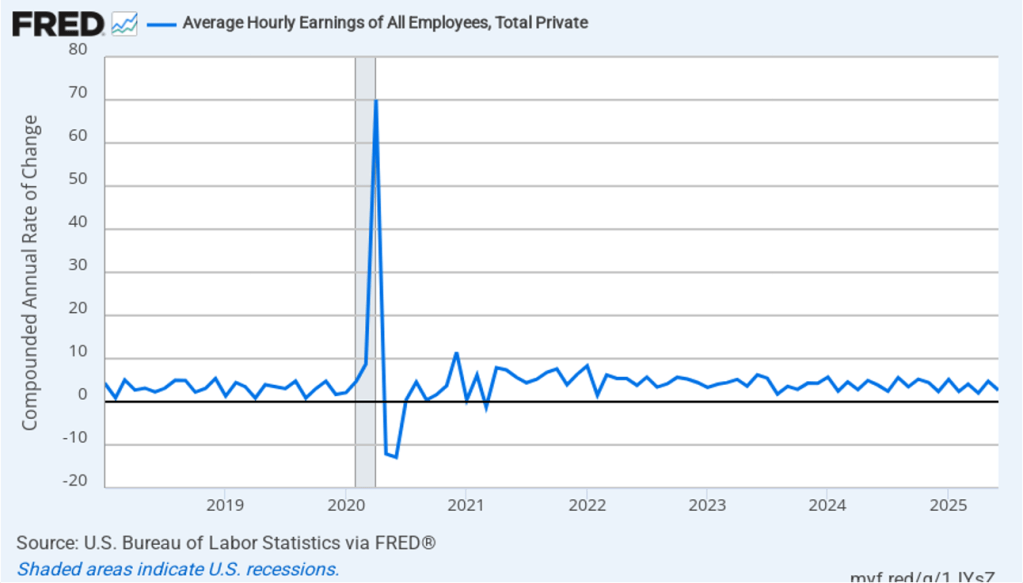
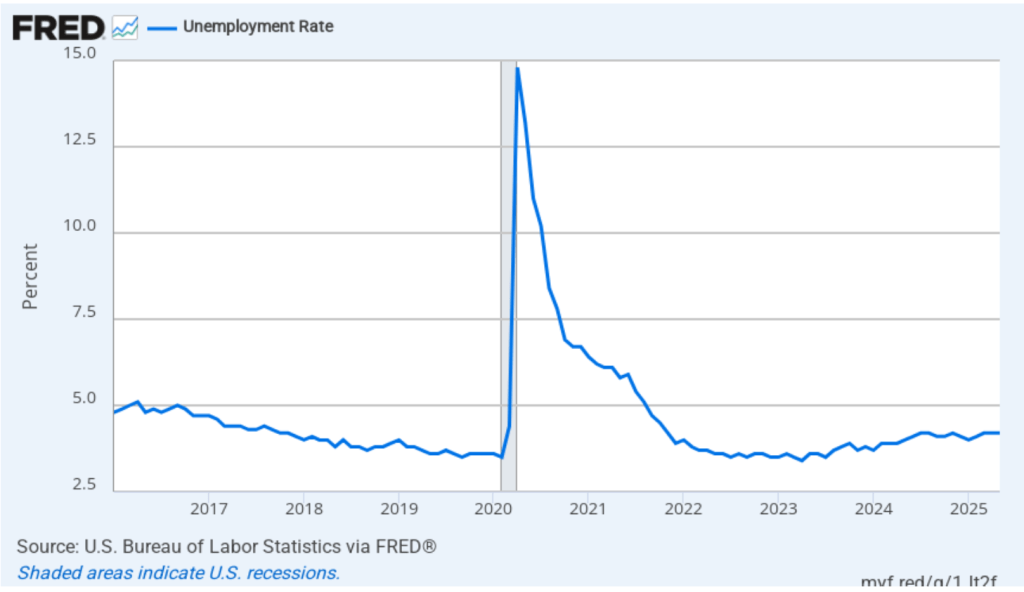
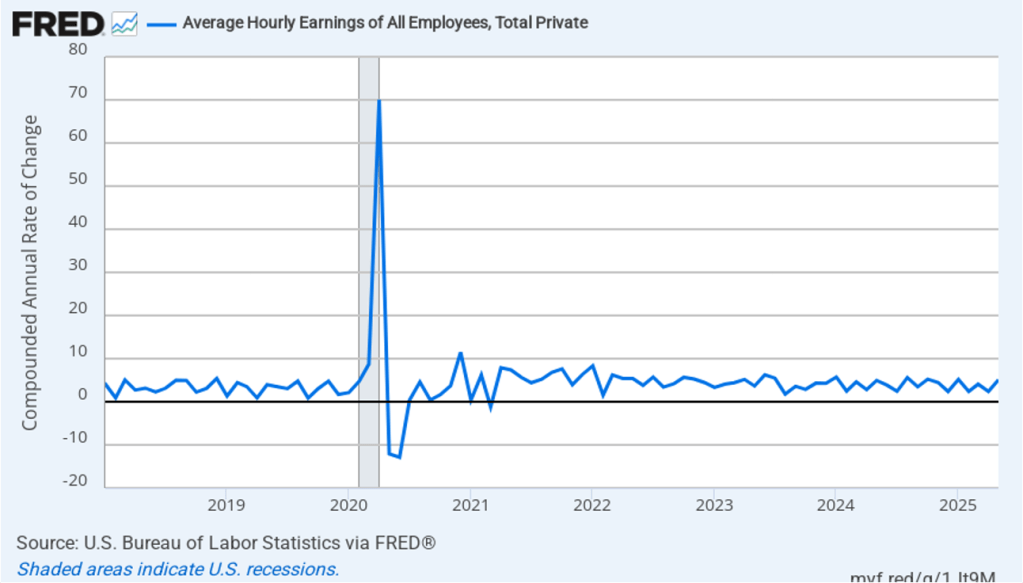
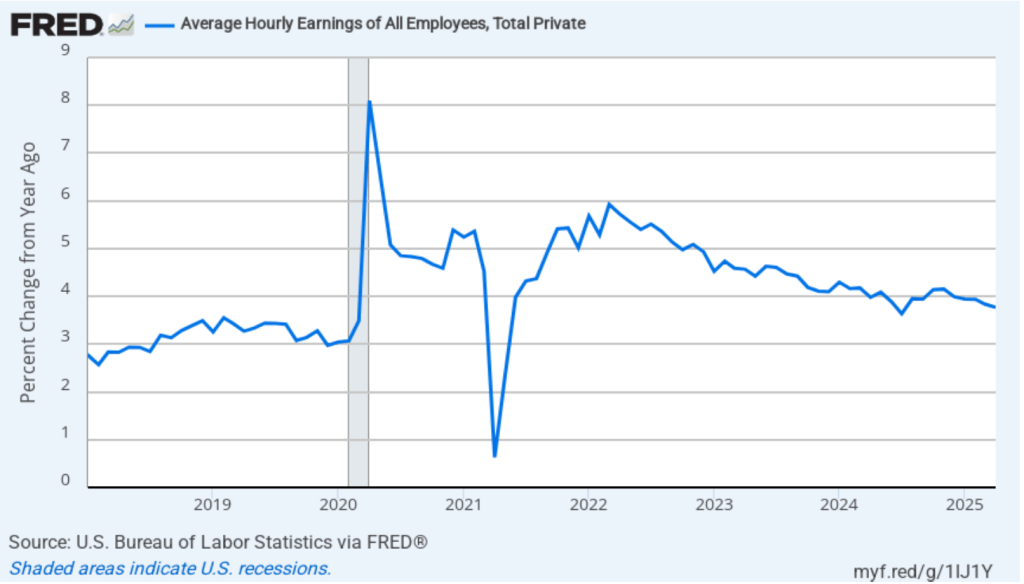
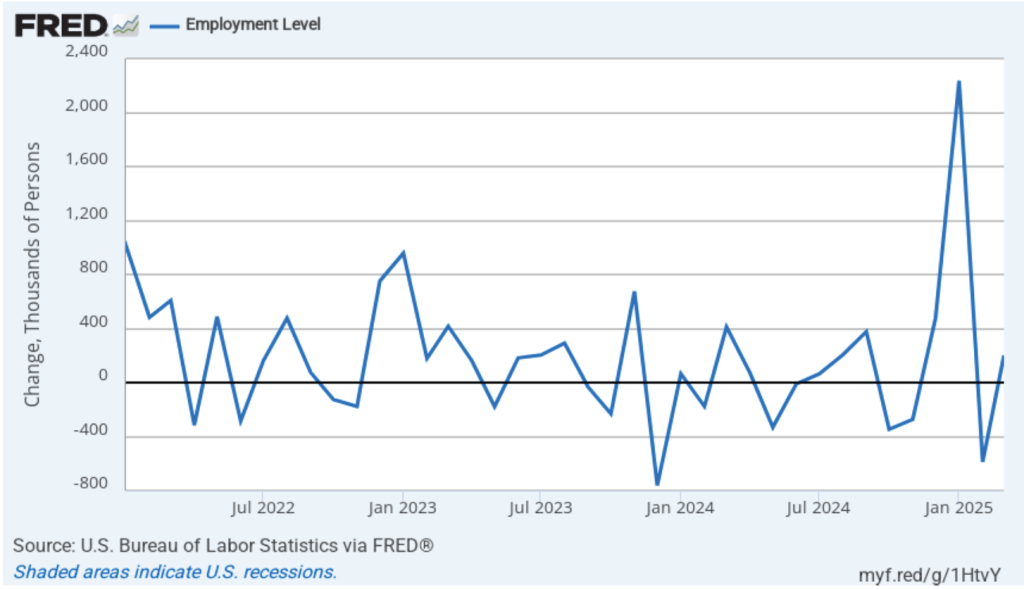
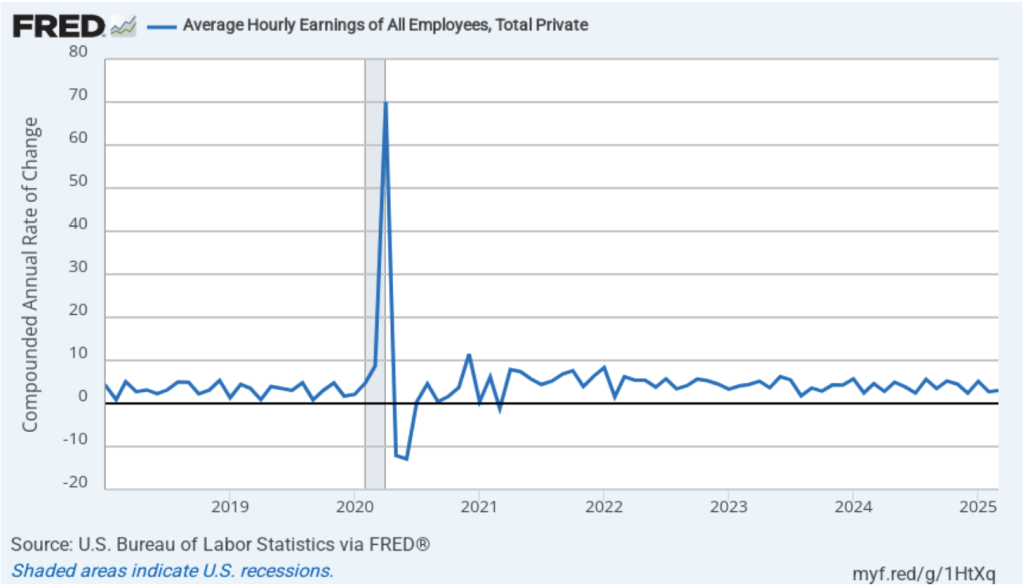
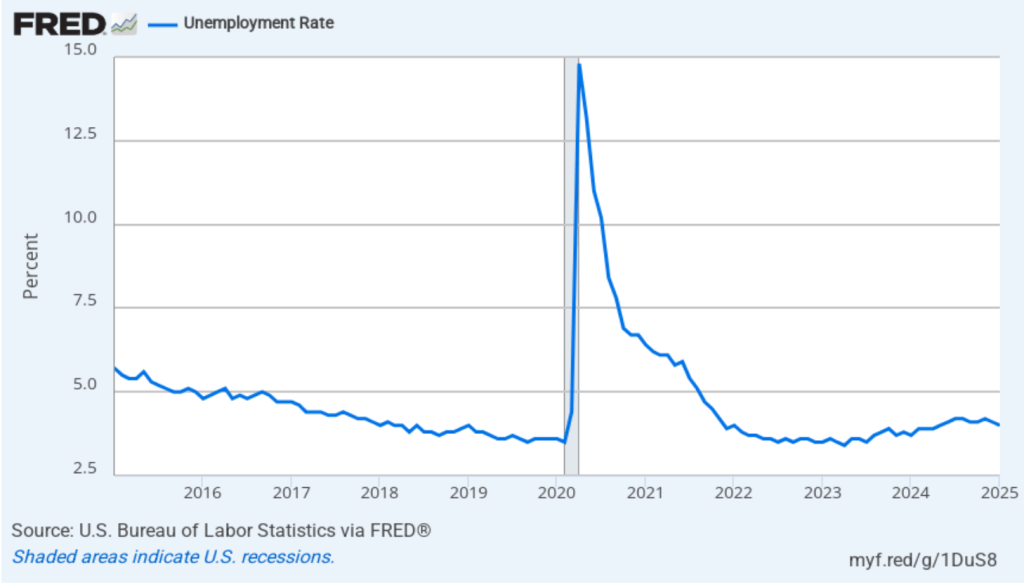
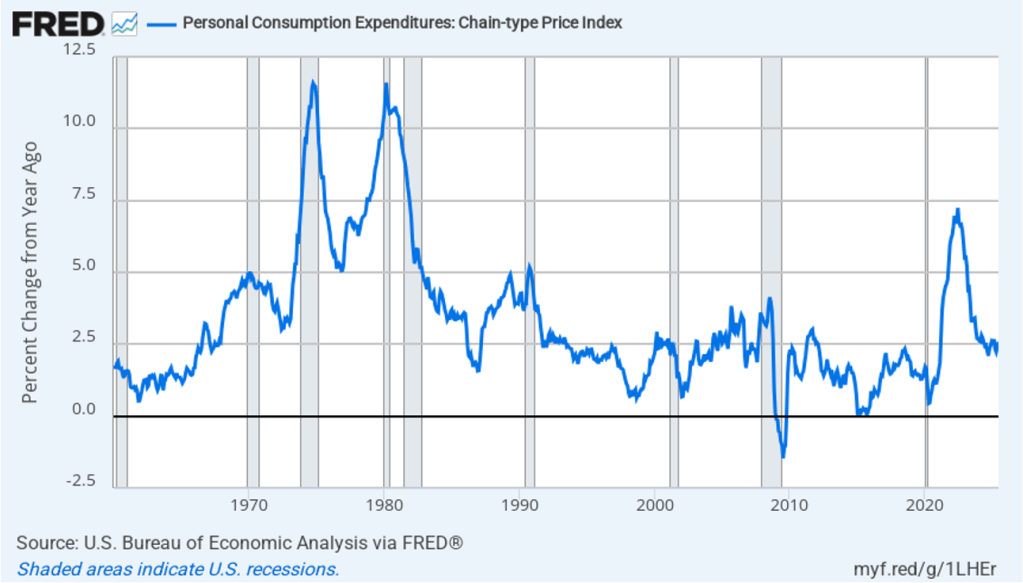
With hindsight, some economists and policymakers argue that FAIT was implemented at just the wrong time. The policy was designed to address the problem of inflation running below the 2% target for most of the period between 2012 and 2019, resulting in unemployment being higher than was consistent with the Fed’s mandate for maximum employment. But, in fact, as the following figure shows, in 2020 the U.S. economy was about to enter a period with the highest inflation rates since the early 1980s.
In his speech today, Powell noted that:
“The economic conditions that brought the policy rate to the ELB [effective lower bound to the federal funds rate, 0 percent to 0.25 percent] and drove the 2020 framework changes were thought to be rooted in slow-moving global factors that would persist for an extended period—and might well have done so, if not for the pandemic. … In the event, rather than low inflation and the ELB, the post-pandemic reopening brought the highest inflation in 40 years to economies around the world.”
Powell outlined the key changes in the policy framework:
“First, we removed language indicating that the ELB was a defining feature of the economic landscape. Instead, we noted that our ‘monetary policy strategy is designed to promote maximum employment and stable prices across a broad range of economic conditions.'”
“Second, we returned to a framework of flexible inflation targeting and eliminated the ‘makeup’ strategy. As it turned out, the idea of an intentional, moderate inflation overshoot [after a period when inflation had been below the 2 percent annual target] had proved irrelevant. … Our revised statement emphasizes our commitment to act forcefully to ensure that longer-term inflation expectations remain well anchored, to the benefit of both sides of our dual mandate. It also notes that ‘price stability is essential for a sound and stable economy and supports the well-being of all Americans.’ “
“Third, our 2020 statement said that we would mitigate ‘shortfalls,’ rather than ‘deviations,’ from maximum employment. … [T]he use of ‘shortfalls’ was not intended as a commitment to permanently forswear preemption or to ignore labor market tightness. Accordingly, we removed ‘shortfalls’ from our statement. Instead, the revised document now states more precisely that ‘the Committee recognizes that employment may at times run above real-time assessments of maximum employment without necessarily creating risks to price stability.’ … [But] preemptive action would likely be warranted if tightness in the labor market or other factors pose risks to price stability.”
“Fourth, consistent with the removal of ‘shortfalls,’ we made changes to clarify our approach in periods when our employment and inflation objectives are not complementary. In those circumstances, we will follow a balanced approach in promoting them.”
“Finally, the revised consensus statement retained our commitment to conduct a public review roughly every five years.”
To summarize, the two key changes in the framework are: 1) The FOMC will no longer attempt to push inflation beyond its 2 percent goal if inflation has been below that goal for a period, and 2) The FOMC may still attempt to preempt an increase in inflation if labor market conditions or other data make it appear likely that inflation will accelerate, but it won’t necessarily do so just because the unemployment rate is currently lower than what had been considered consistent with maximum employment.