Image created by ChatGPT
As we discuss, in Macroeconomics, Chapter 16 (Economics, Chapter 26), fiscal policy actions that increase aggregate supply will both expand output and reduce upward pressure on the price level. A key problem that faces attempts to expand infrastructure, particularly by increasing energy production and transmission, is the difficulty of obtaining government permits and meeting government regulations. These regulatory hurdles can delay projects for years, greatly raising the cost of constructing them.
Glenn joined officials from both Democratic and Republican administrations to urge Congress to pass the Bipartisan American Affordability and Jobs Act, which is intended to lower the regulatory barriers to constructing new energy infrastructure projects.
Below are some extracts from the letter. The full text of the letter can be found here. An article in the Wall Street Journal discusses the letter and the issues involved in permitting reform.
“Critical industries across our economy—from semiconductors to critical minerals to artificial intelligence—are built in the physical world and powered by energy infrastructure that must be built as well. Unfortunately, we are not building this infrastructure fast enough to remain globally competitive.”
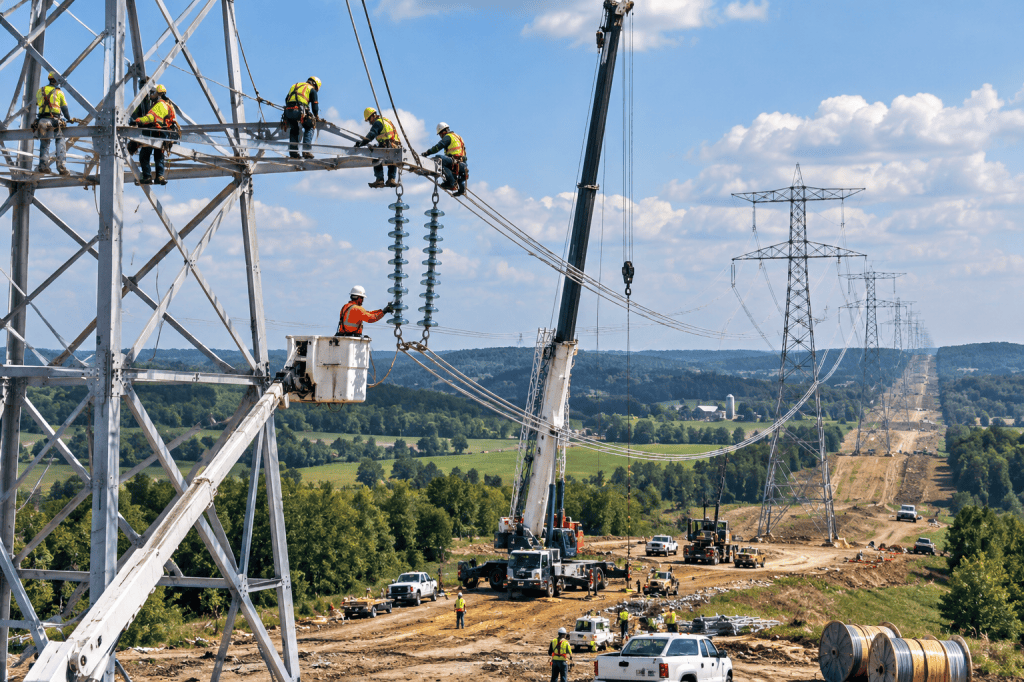
“While American infrastructure development—and the economic growth it enables—flounders, our competitors invest and build. China, our principal strategic competitor, has made energy infrastructure central to its industrial strategy. China has built more high-voltage transmission in the last fifteen years than the U.S. has built in all of its history. China’s abundant, affordable energy has enabled its strategic industries from critical minerals processing to automobile manufacturing.”
“Consider the Cardinal-Hickory Creek transmission line: the 102-mile project was approved by the regional grid operator as part of a larger transmission buildout in 2011 but did not become fully operational until September 2024.
Along the way, it faced years of federal review and litigation, including two federal court injunctions, even as 160 generation projects representing over 24 gigawatts were waiting for its completion.”
“These delays are especially concerning given the growth of artificial intelligence. Artificial intelligence is a transformational technology, but it must be developed in a manner beneficial for all Americans. Our current permitting structure makes that impossible. To avoid long lead times in connecting to the grid, U.S. hyperscalers [firms such as Amazon, Google, and Microsoft that are building large data centers and related infrastructure] have turned to on-site power generation solutions. By generating power ‘behind the meter,’ they can bypass strained grid infrastructure and the years-long interconnection queue.”
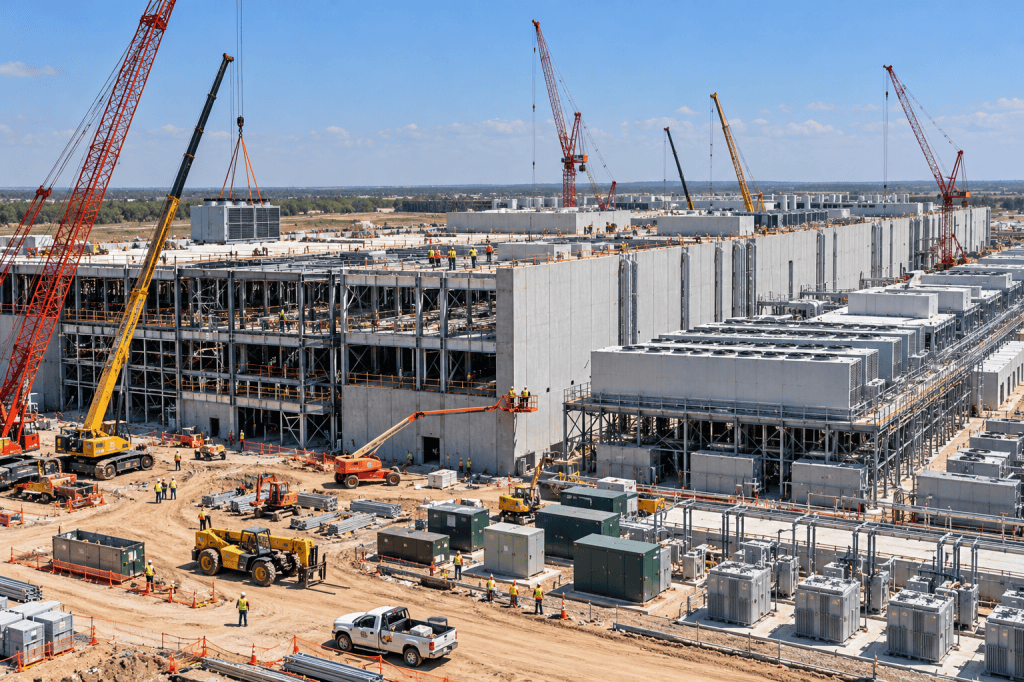
Image created by ChatGPT
“With a more rational permitting process, hyperscalers would invest in new energy infrastructure that could connect speedily to the grid, which, together with sound regulatory policies, would increase electricity supply for all
consumers and ultimately reduce residential bills. Alleviating our permitting
bottlenecks can help ensure that America retains its competitive edge in a critical technology while delivering benefits to the American people.”
“The Bipartisan American Affordability and Jobs Act is the most significant
bipartisan legislative effort that Congress has undertaken in decades to tackle
these challenges. It addresses key constraints stifling American industry by
requiring interregional transmission planning, strengthening the federal backstop for nationally significant transmission lines, and creating a faster, more predictable process for connecting new generation to the grid. It also makes permits more durable by imposing tighter timelines for litigation and limiting frivolous lawsuits that can halt projects indefinitely, while preserving community input and judicial review of substantive agency decisions. Among many other important reforms, the Act also requires data centers to pay for the new transmission built to serve them, as well as their fair share of existing system costs, which would reduce costs for other customers.”