Federal Reserve Chair Jerome Powell speaks at a press conference following a meeting of the Federal Open Market Committee. (Photo from federalreserve.gov)
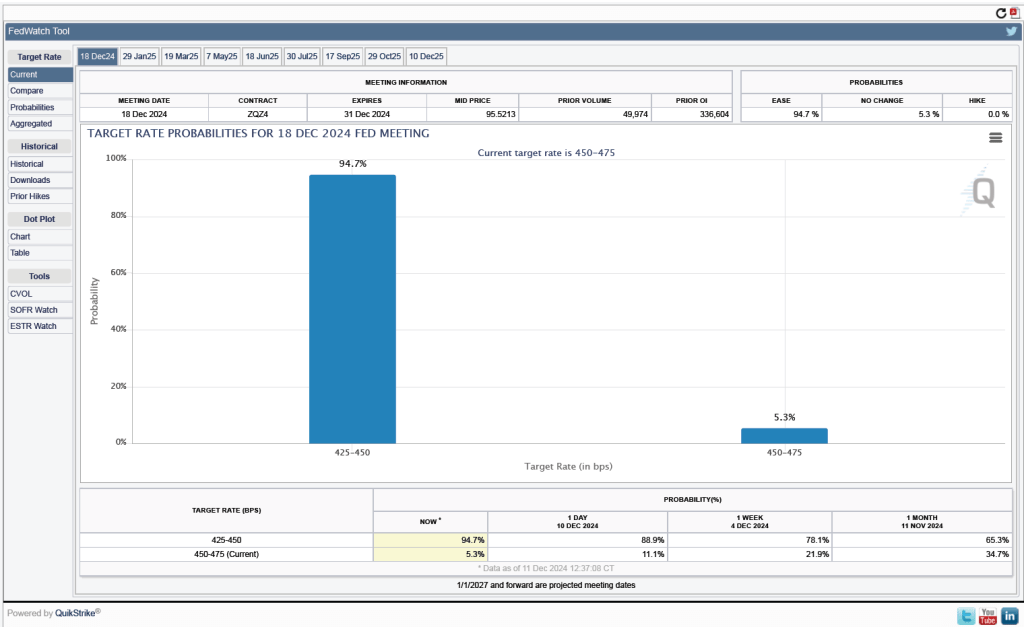
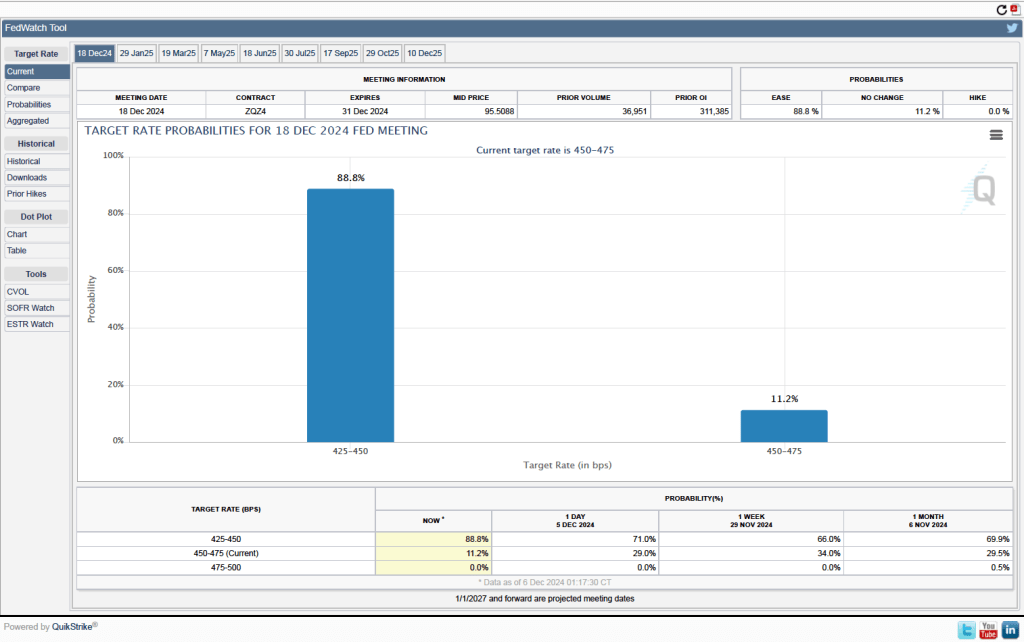
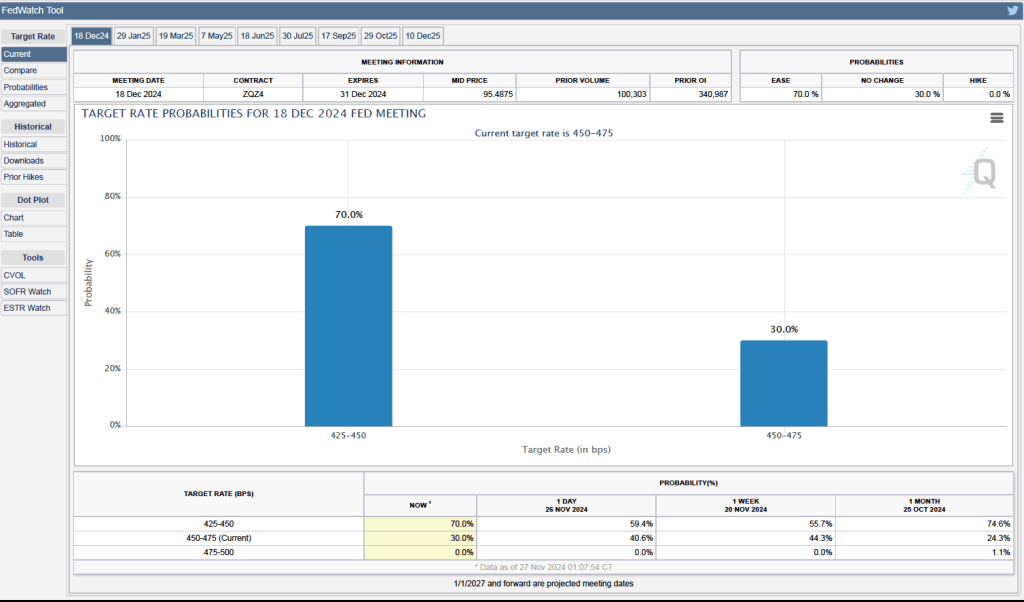
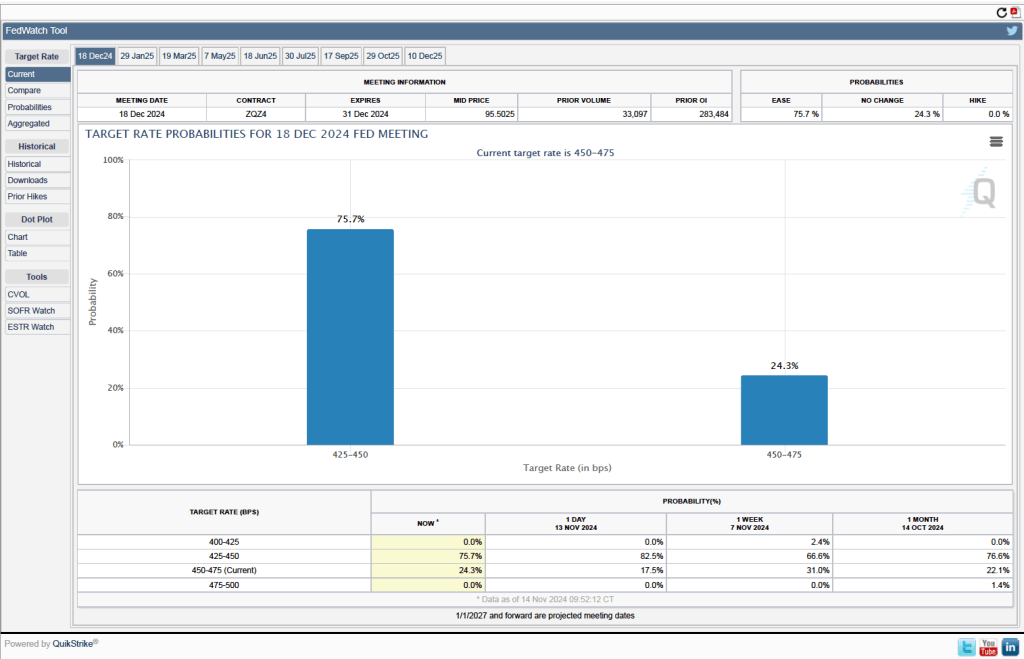
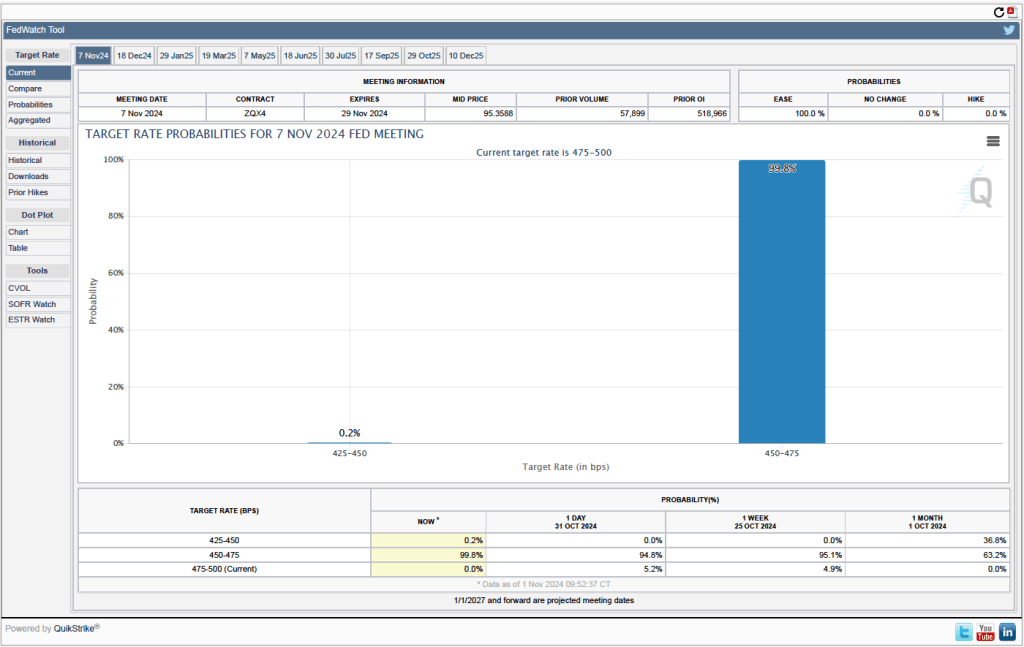
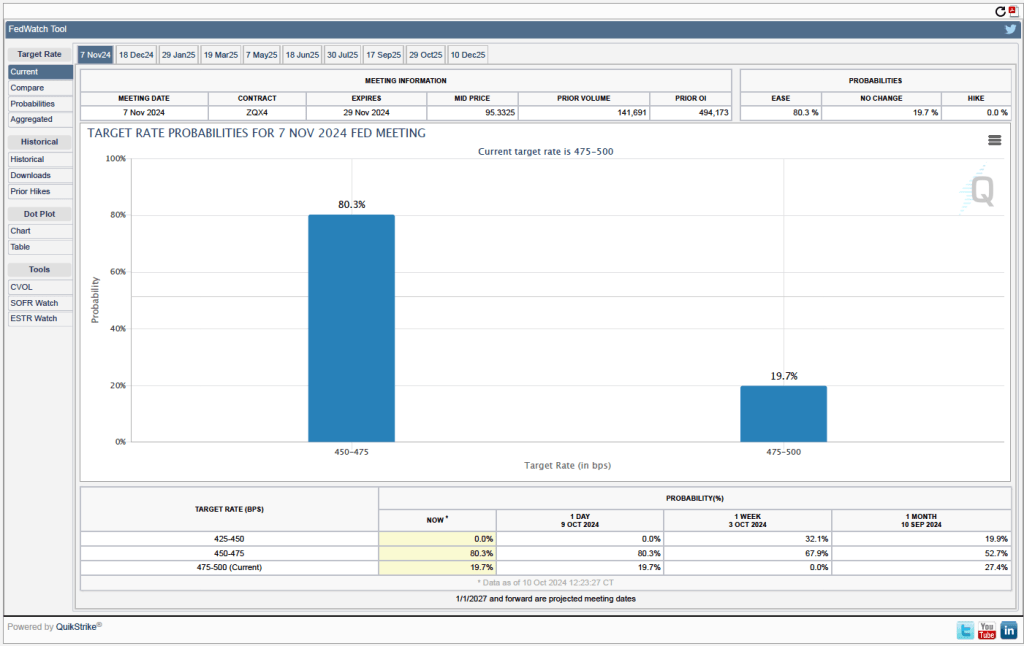
Members of the Fed’s Federal Open Market Committee (FOMC) had signaled that the committee was likely to cut its target range for the federal funds rate by 0.25 percentage point (25 basis points) at its meeting today (December 18). As we noted in this recent post, investors had overwhelming expected a cut of this size. Although the committee followed through with a 25 basis point cut, Fed Chair Jerome Powell noted in a press conference following the meeting that it was a “closer call” than were the two earlier cuts this year. The statement the committee released after the meeting showed that only one member—Beth M. Hammack, president of the Federal Reserve Bank of Cleveland—ended up voting against the decision to cut the target rate.
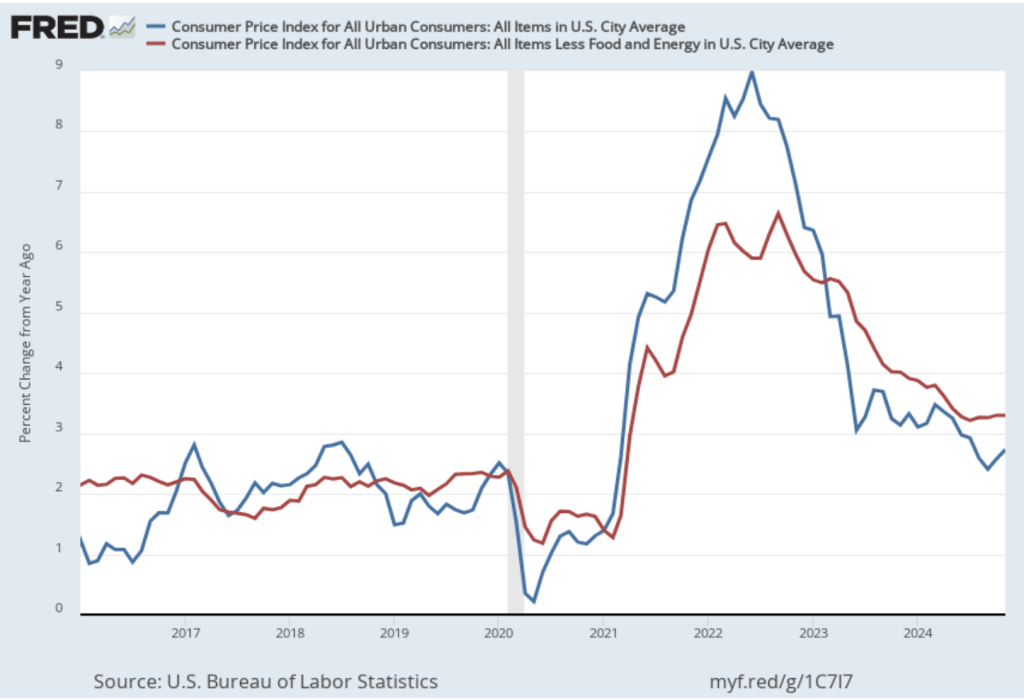
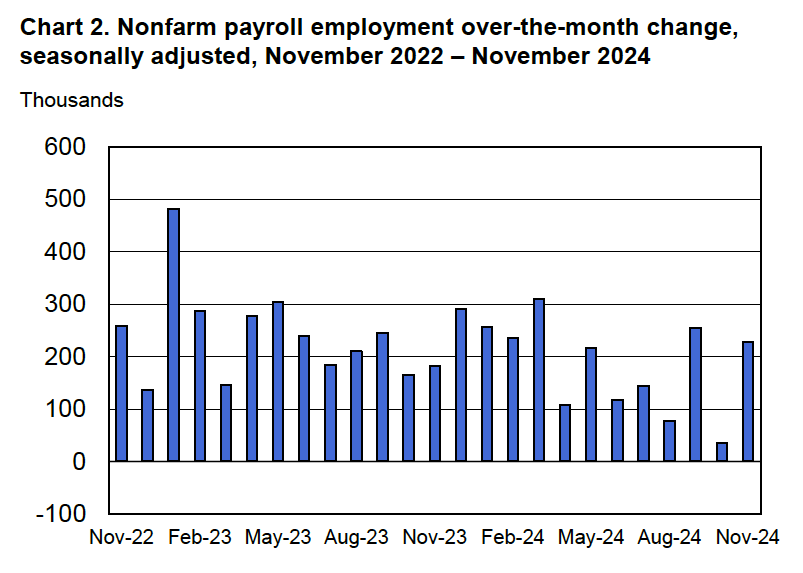
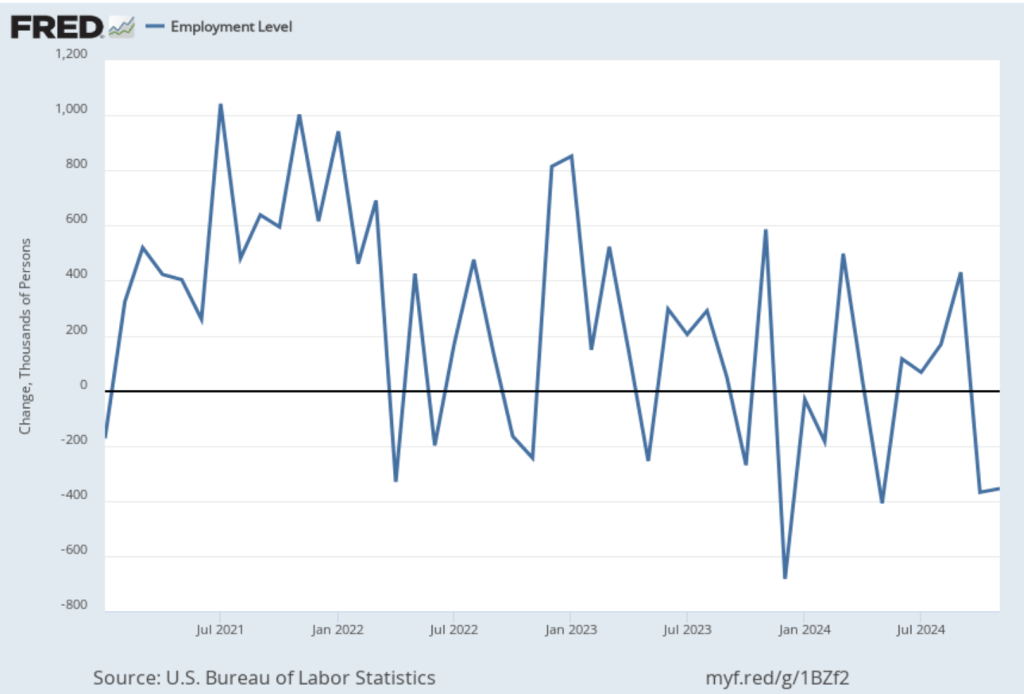
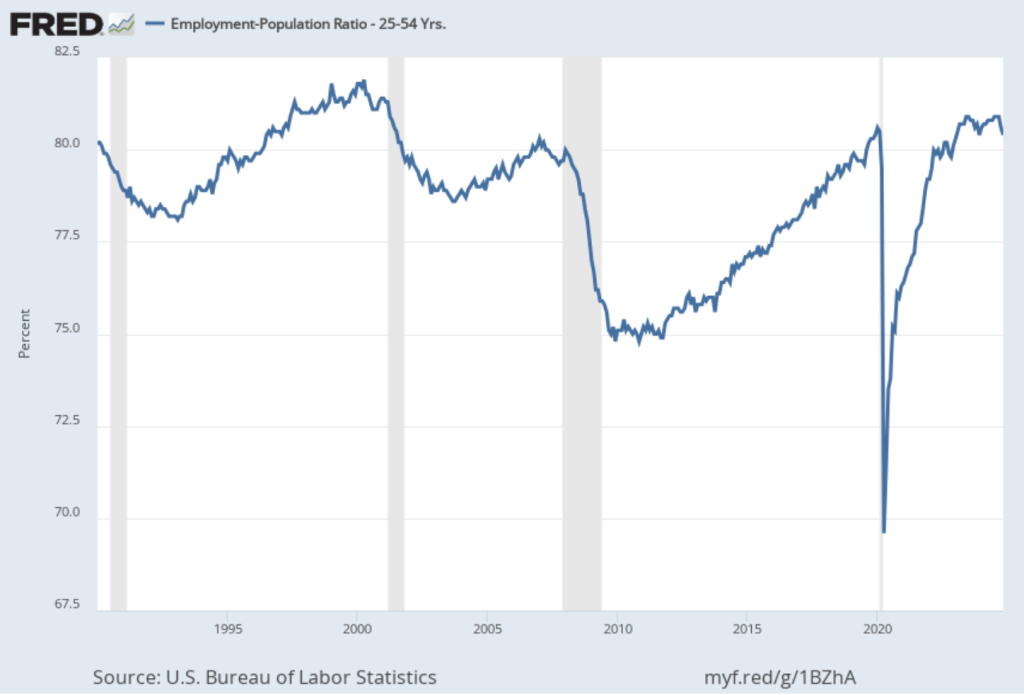
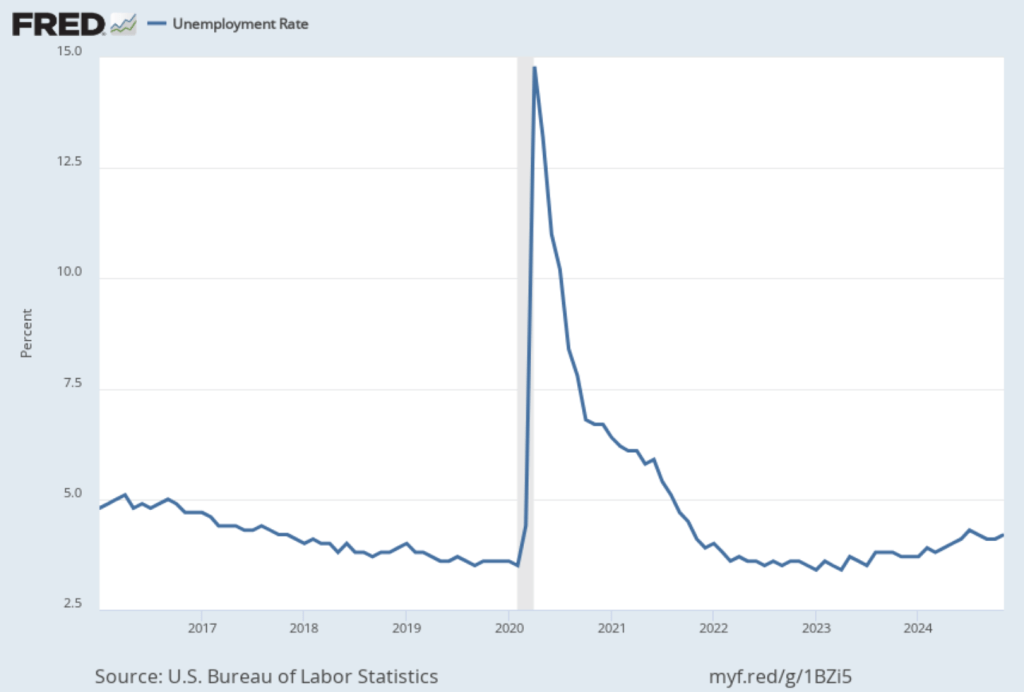
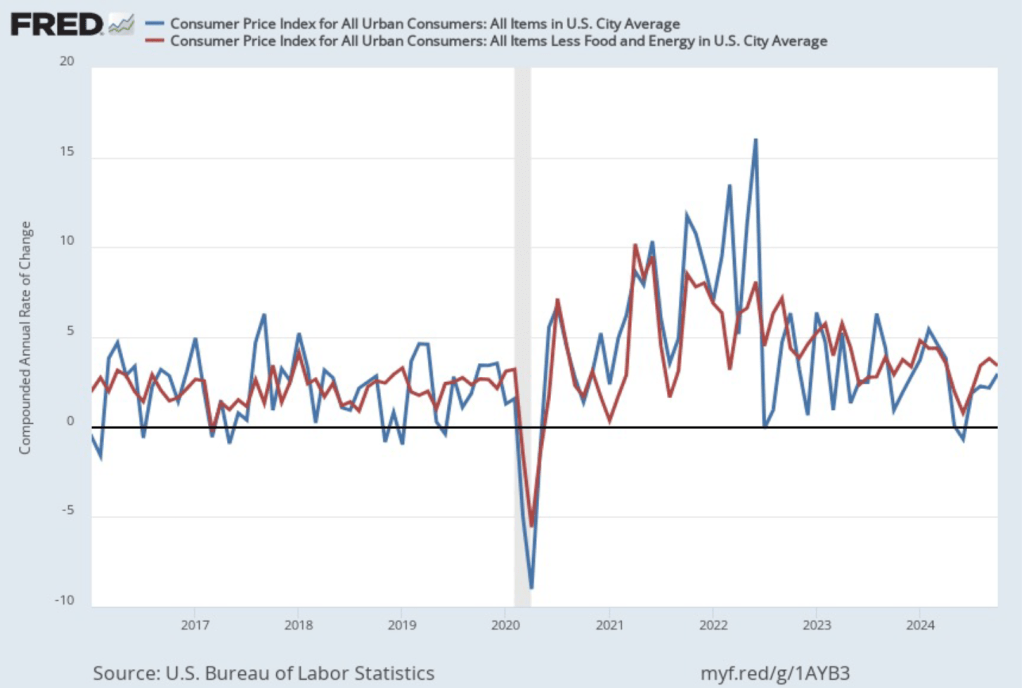
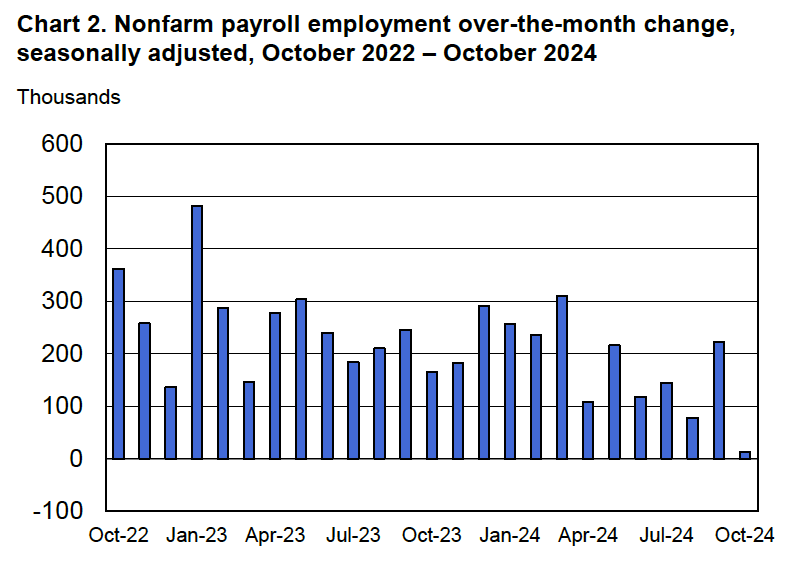
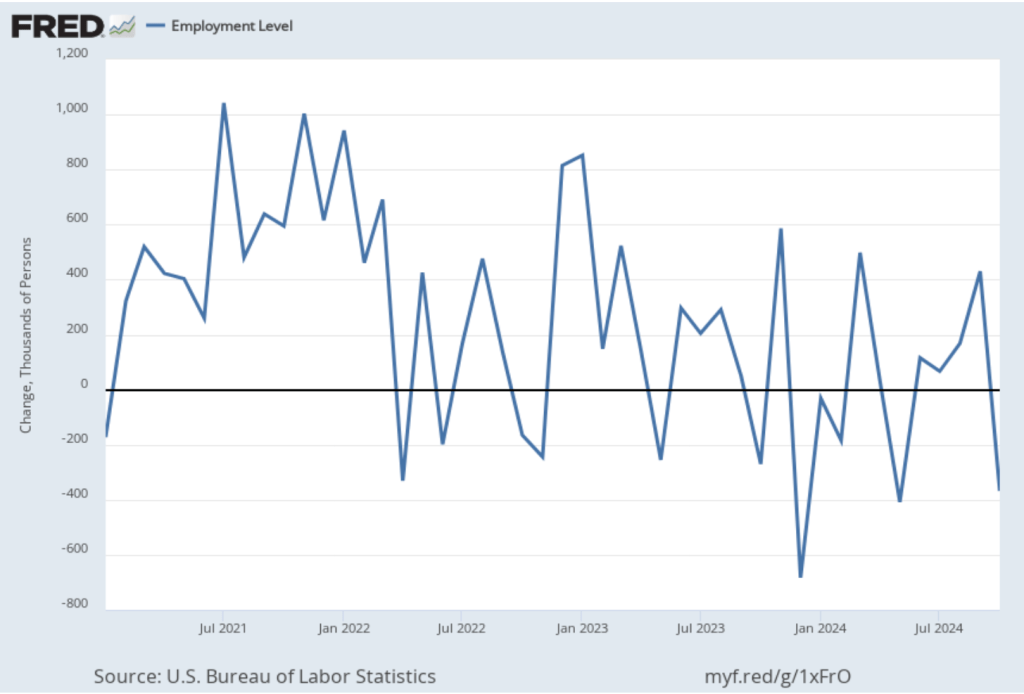
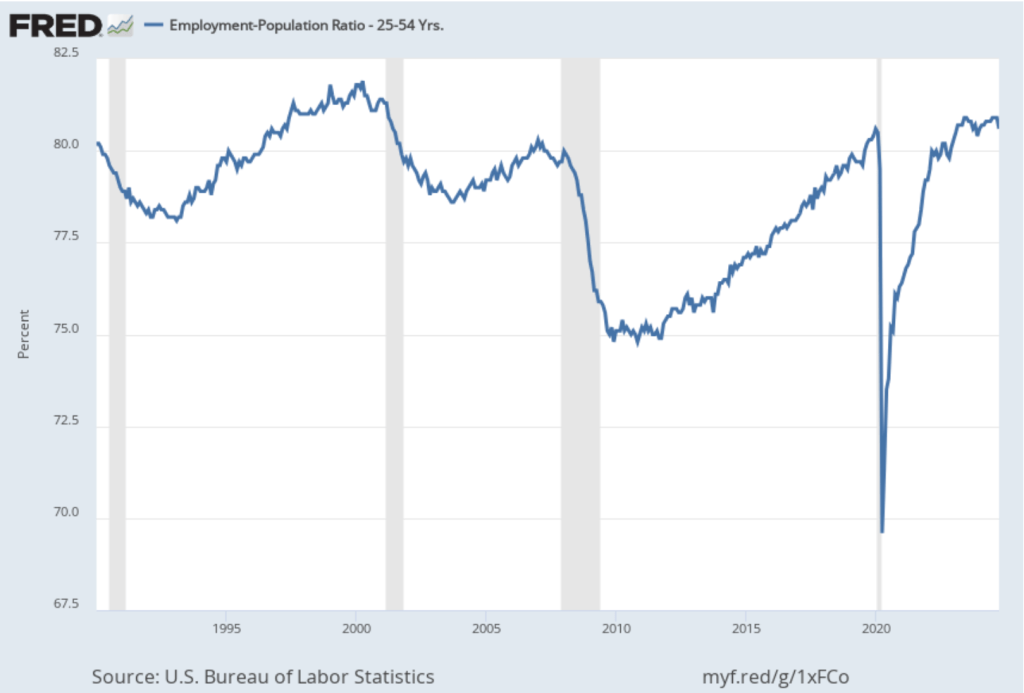
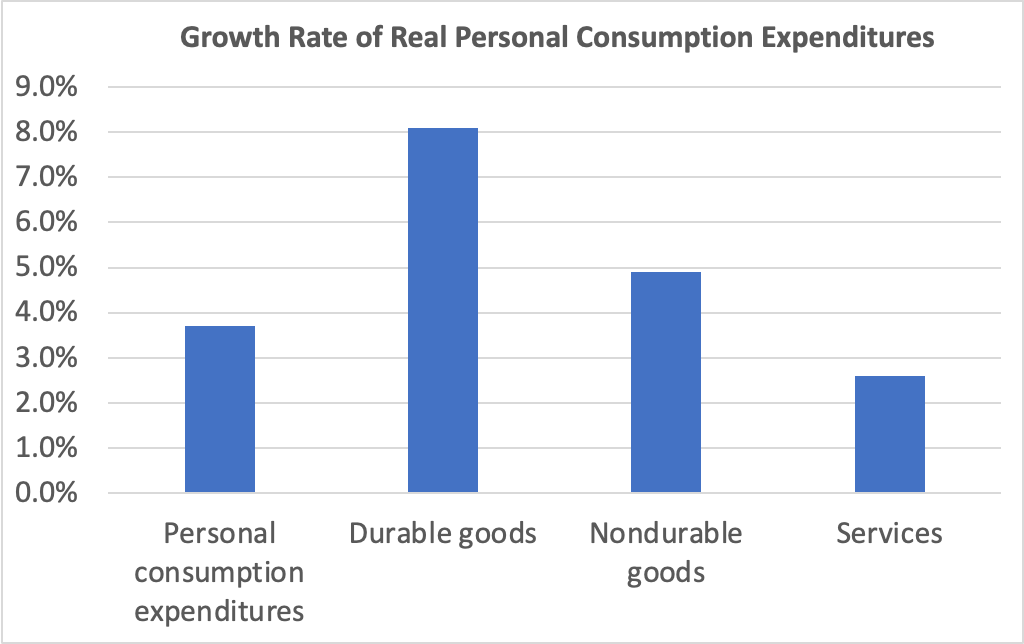
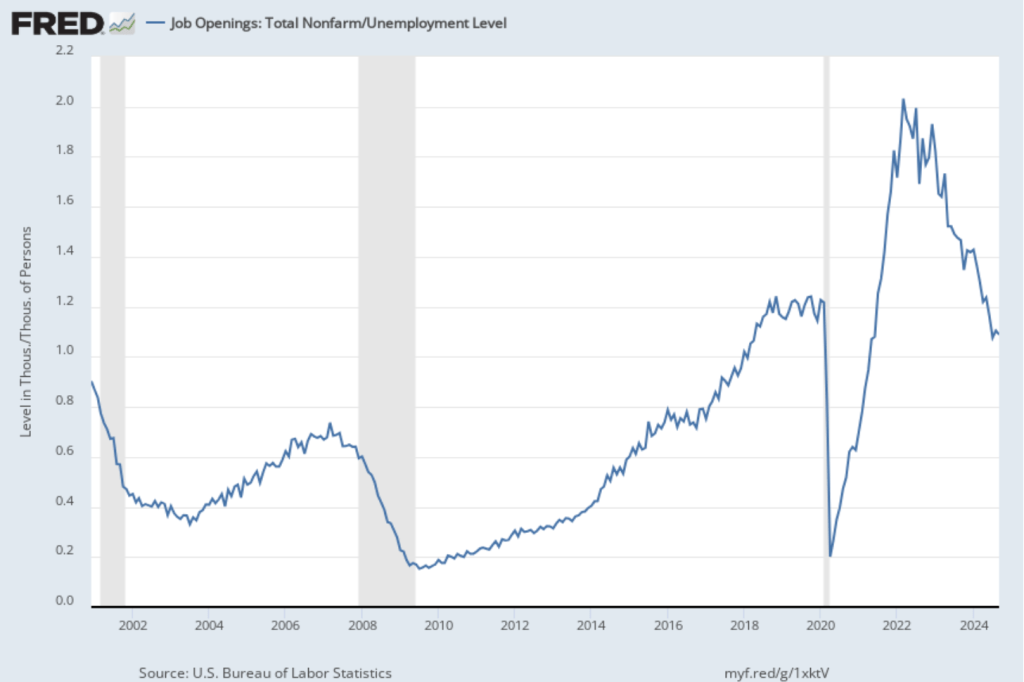
In his press conference, Powell noted that although there were some indications that the labor market has weakened, the committee believed that unemployment was likely to remain near the natural rate. The committee also saw real GDP increasing at a steady rate. Powell stated that he was optimistic about the economy and that “I expect another good year next year.” The main obstacle to the committee fulfilling its dual mandate for full employment and price stability is that inflation remains persistently above the Fed’s target of a 2 percent annual inflation rate.
After the meeting, the committee also released a “Summary of Economic Projections” (SEP)—as it typically does at its March, June, September, and December meetings. The SEP presents median values of the committee members’ forecasts of key economic variables. The values are summarized in the following table, reproduced from the release.
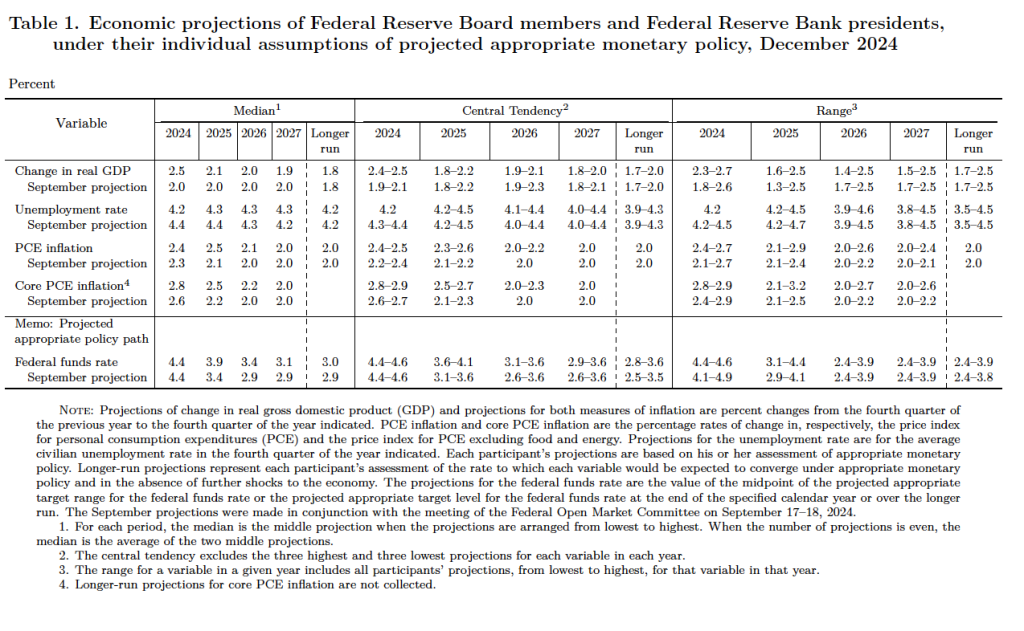
The forecasts mirror the points that Powell made in his news conference:
- Committee members now forecast that GDP will be higher in 2024, and that the unemployment rate will be lower, than they had forecast in September.
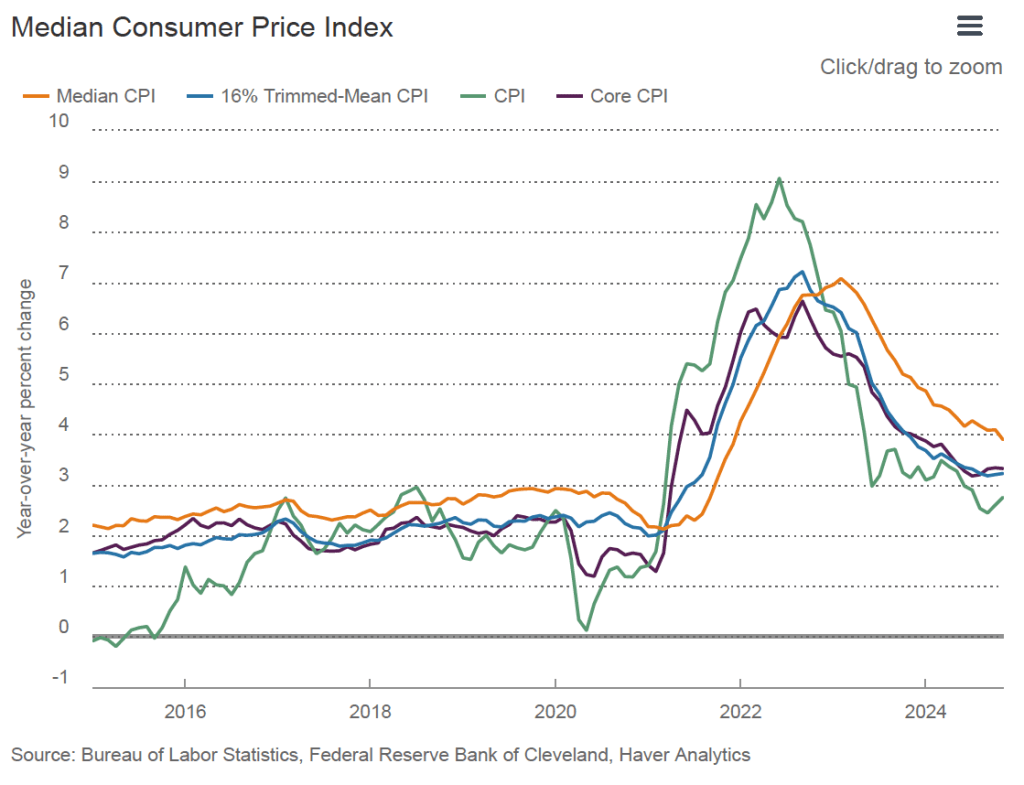
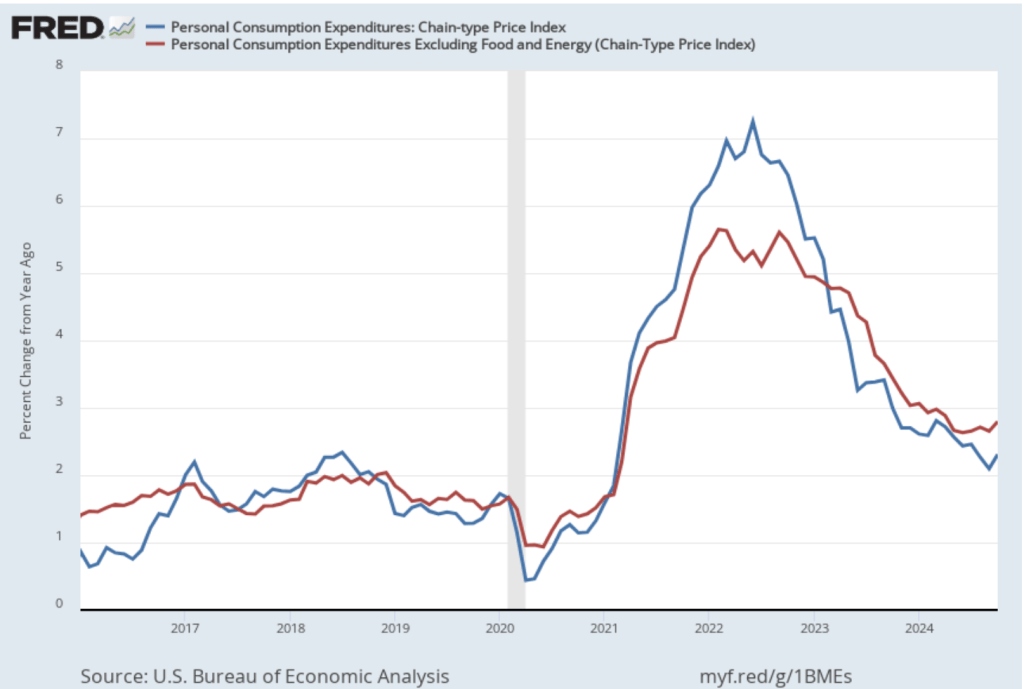
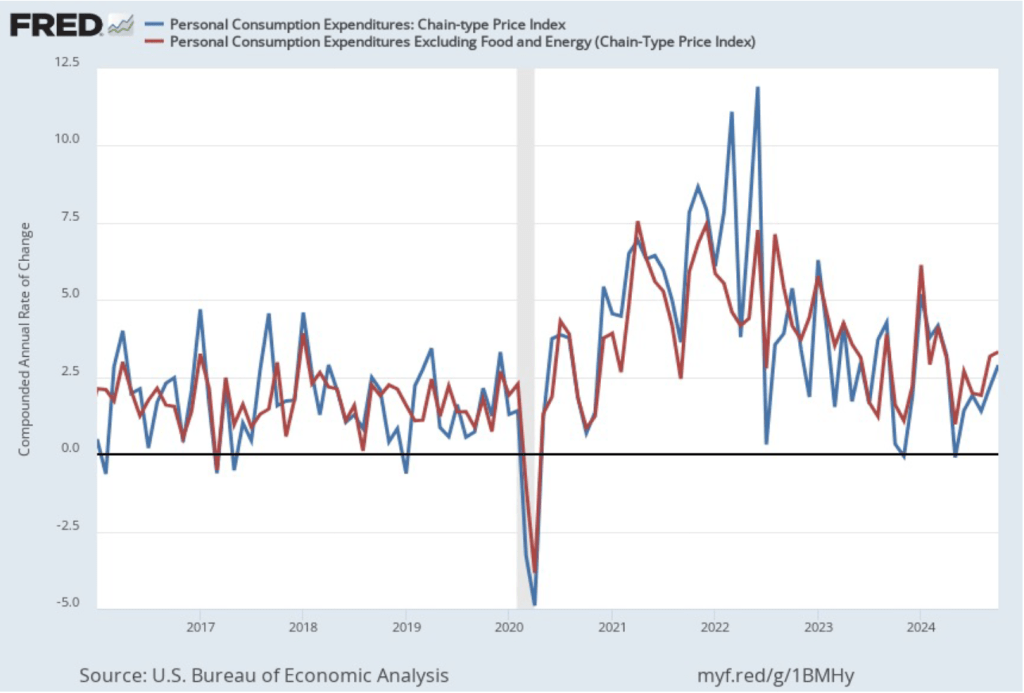
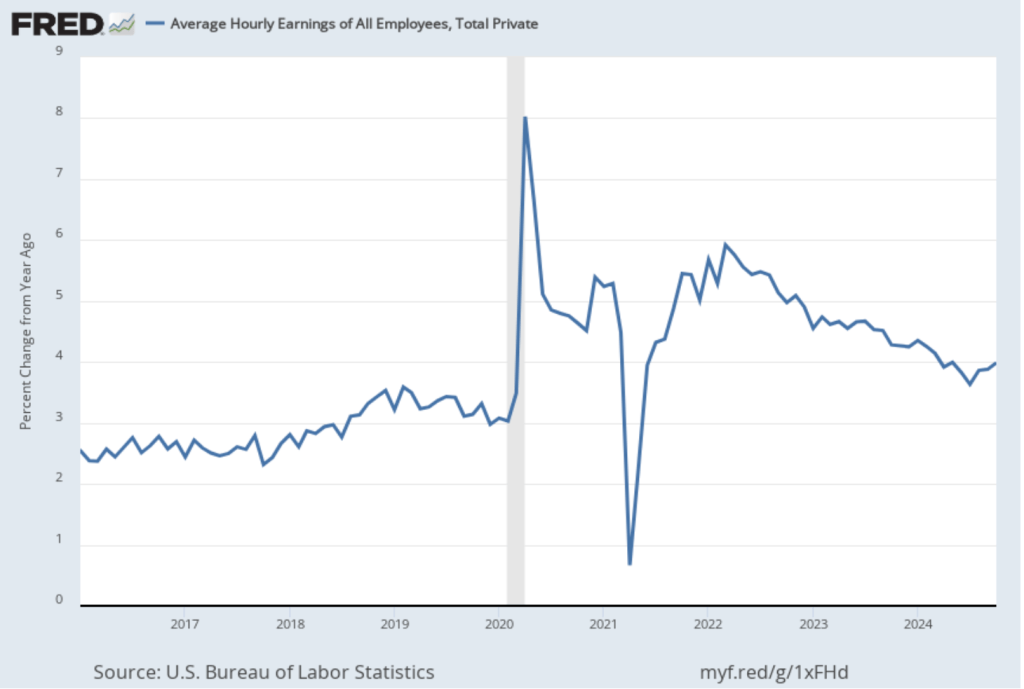
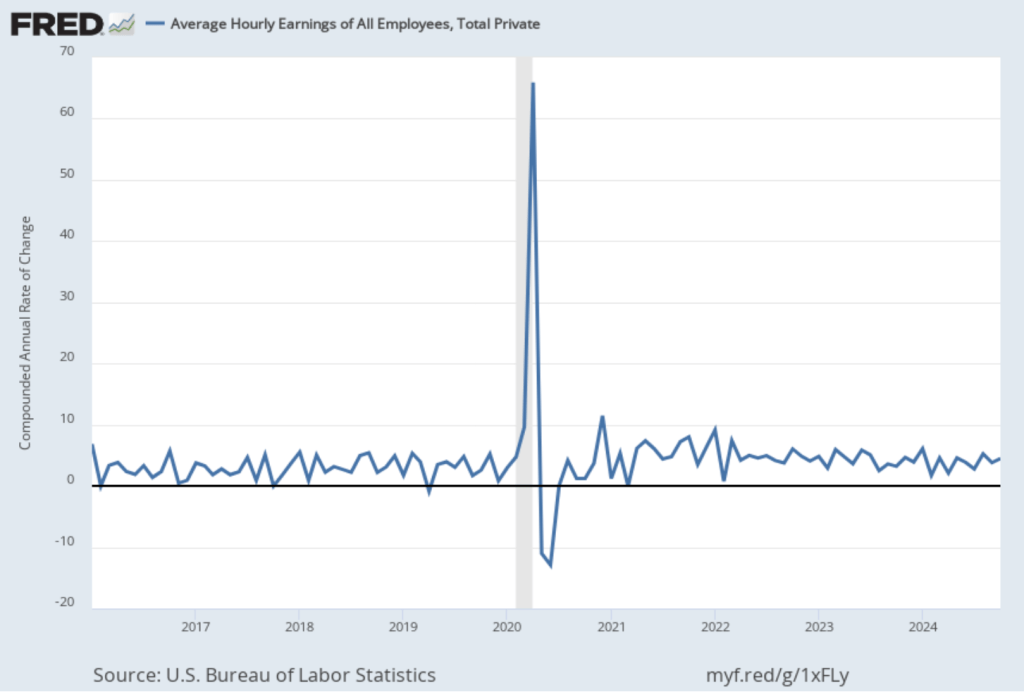
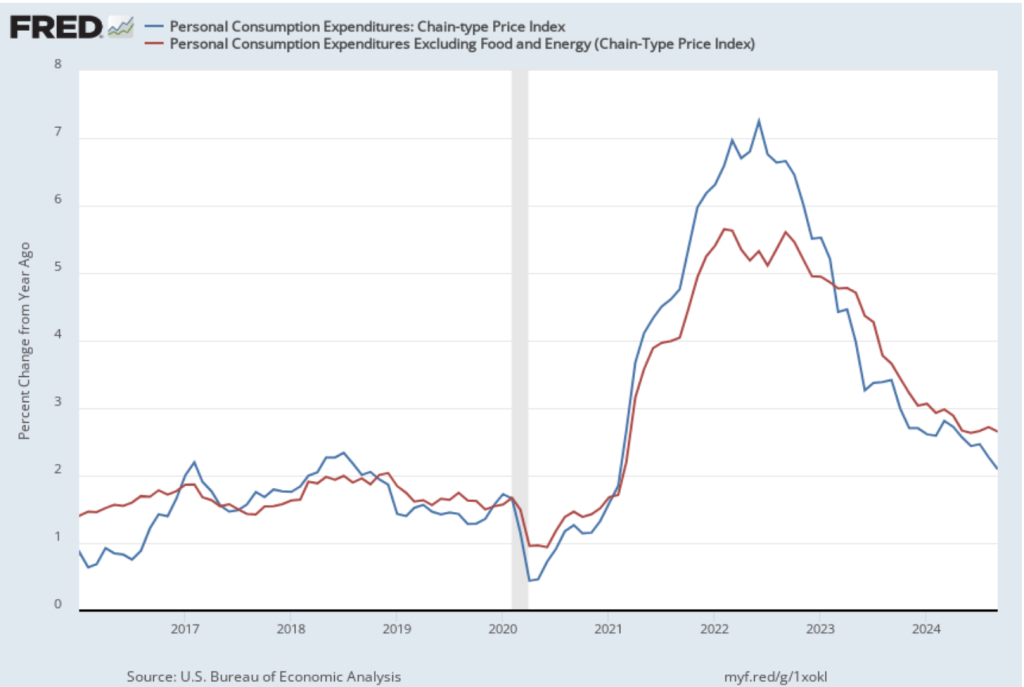
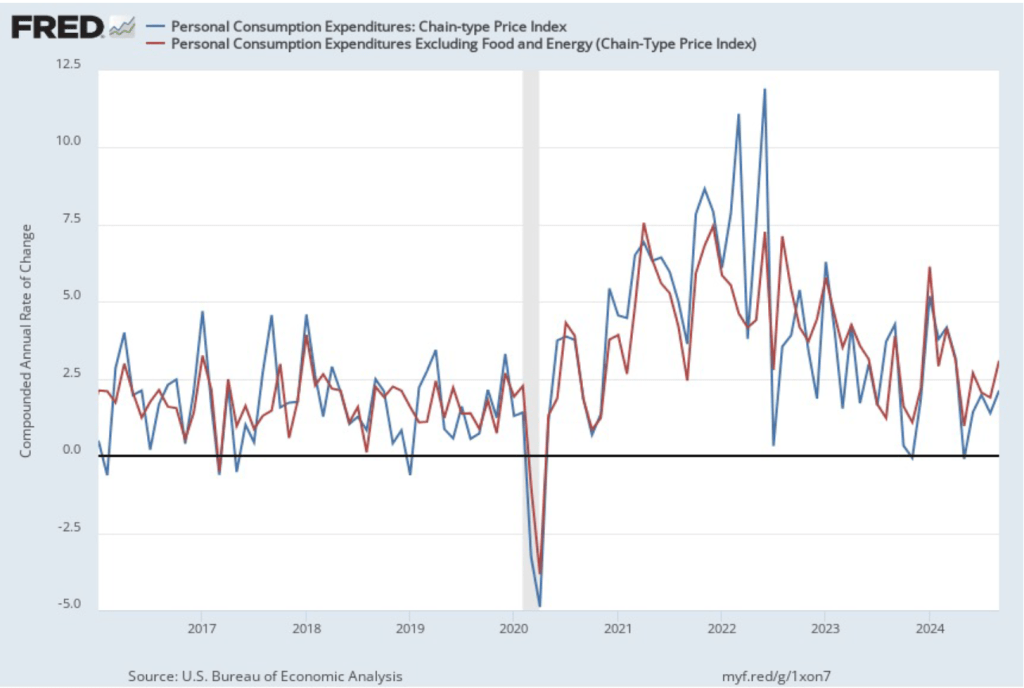
- Committee members now forecast that both personal consumption expenditures (PCE) price inflation and core PCE inflation will be slightly higher in 2024 than they had forecast in September.
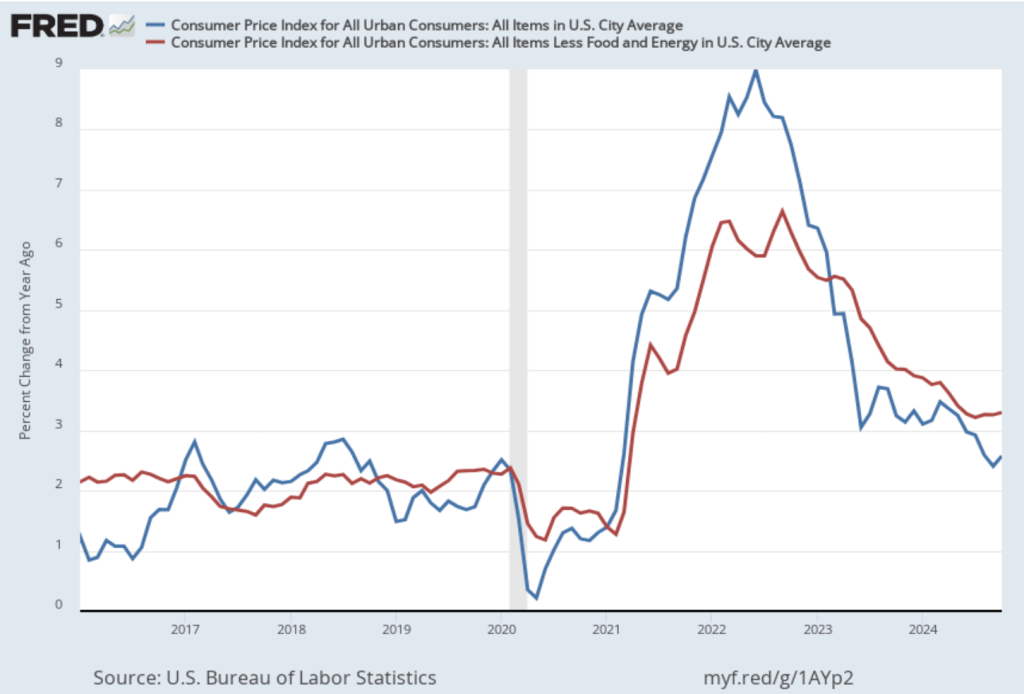
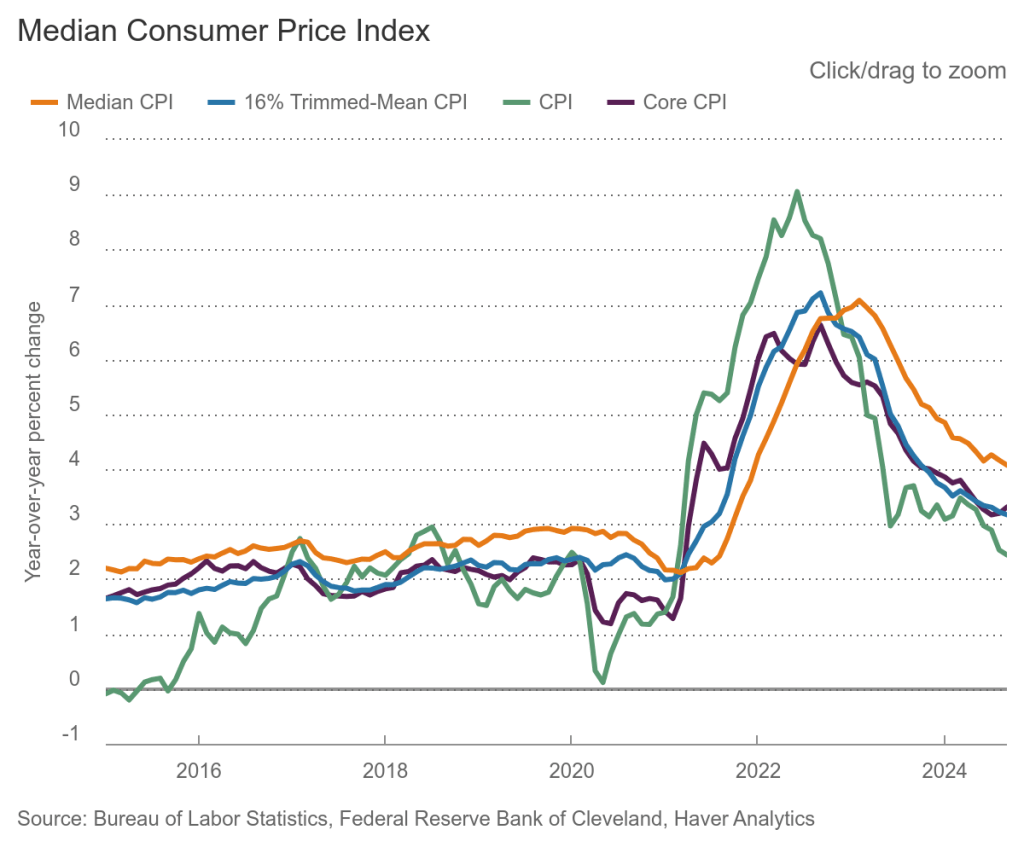
- Most notably, whereas in September committee members had forecast that PCE inflation would be 2.1 percent in 2025, they now forecast it will be 2.5 percent—notably higher. And committee members now forecast that inflation will not fall to the Fed’s 2 percent target until 2027, rather than 2026.
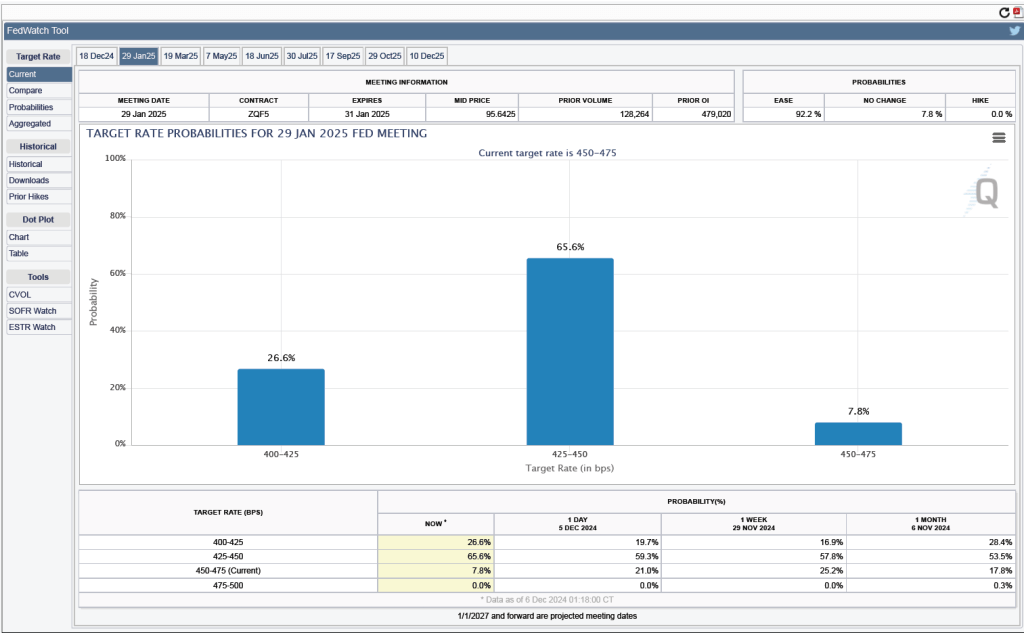
- Finally, committee members now project that the federal funds rate will end 2025 50 basis points lower than it is now, rather than 100 basis points lower. In other words, committee members ares now forecasting only two 25 basis point cuts in the target next year rather than the four cuts they had forecast in September.
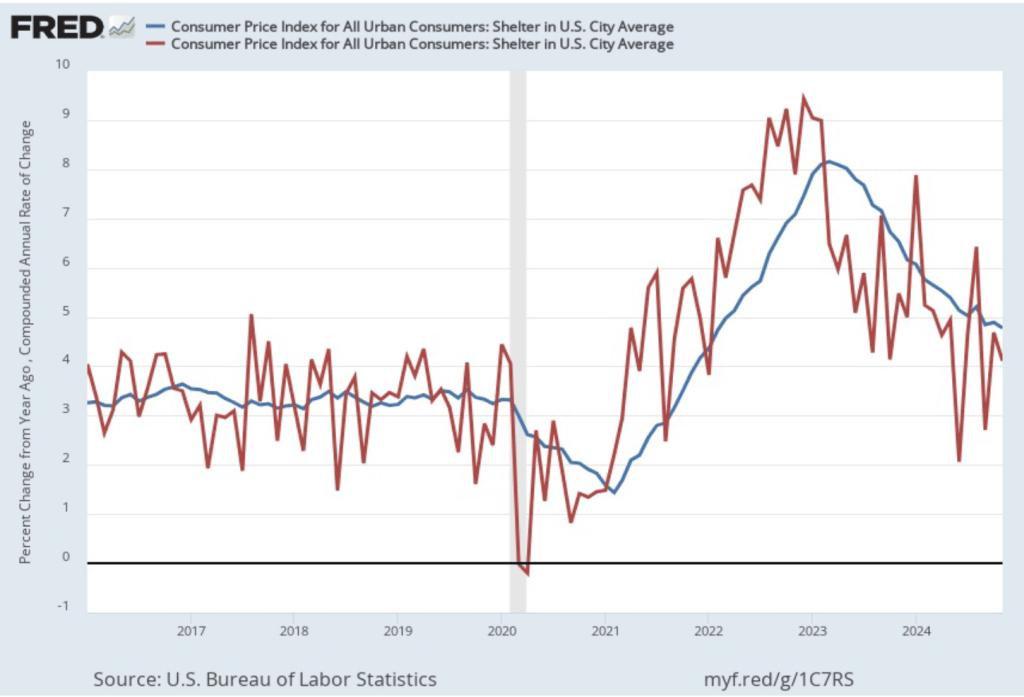
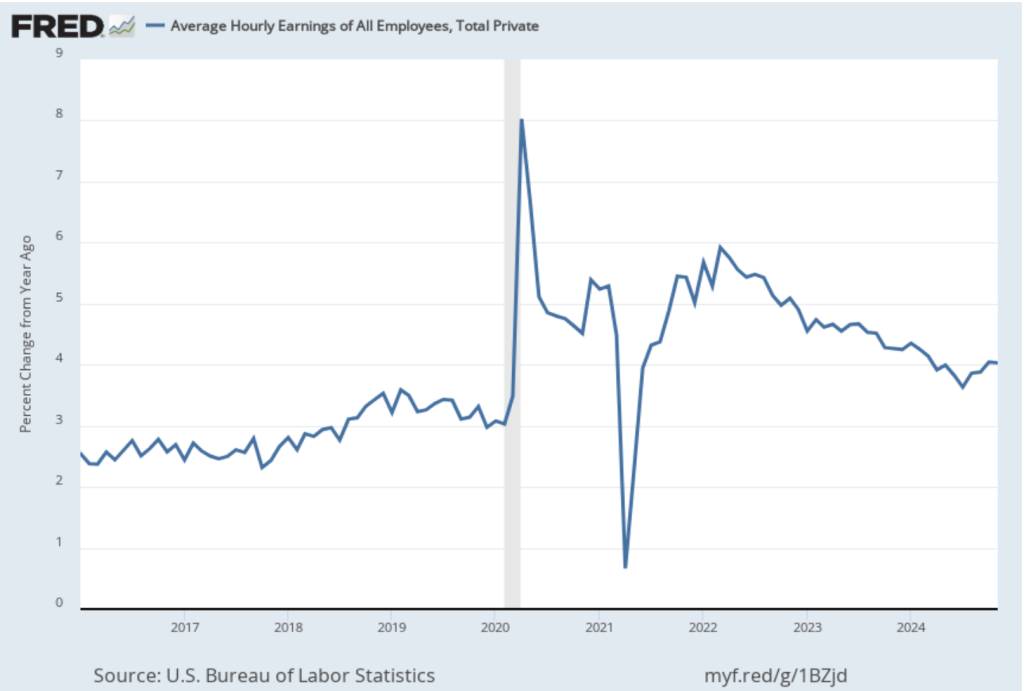
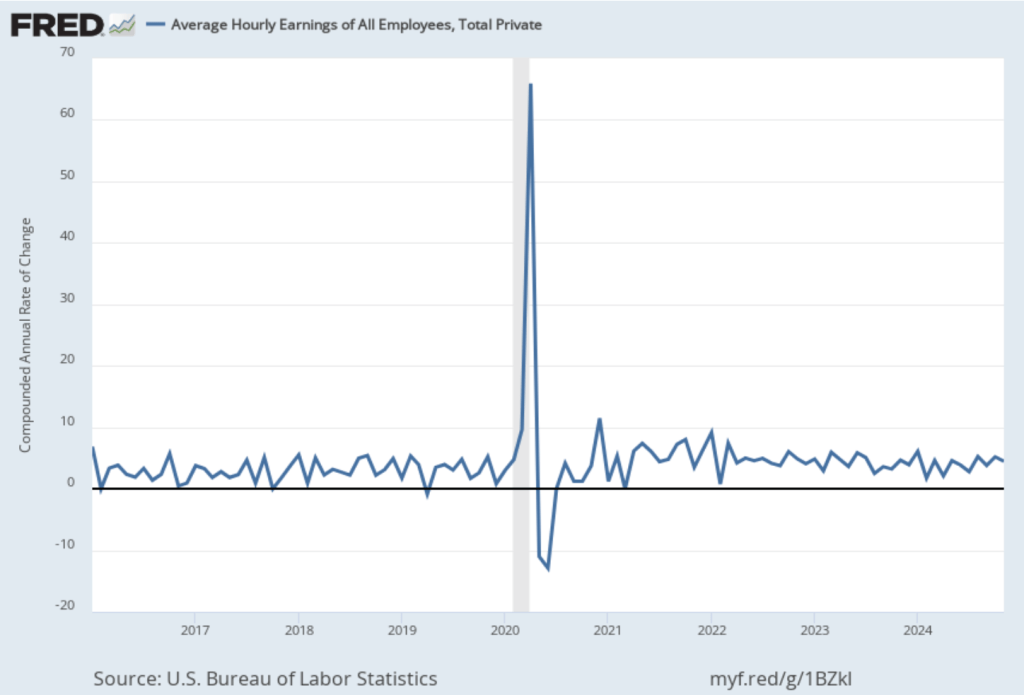
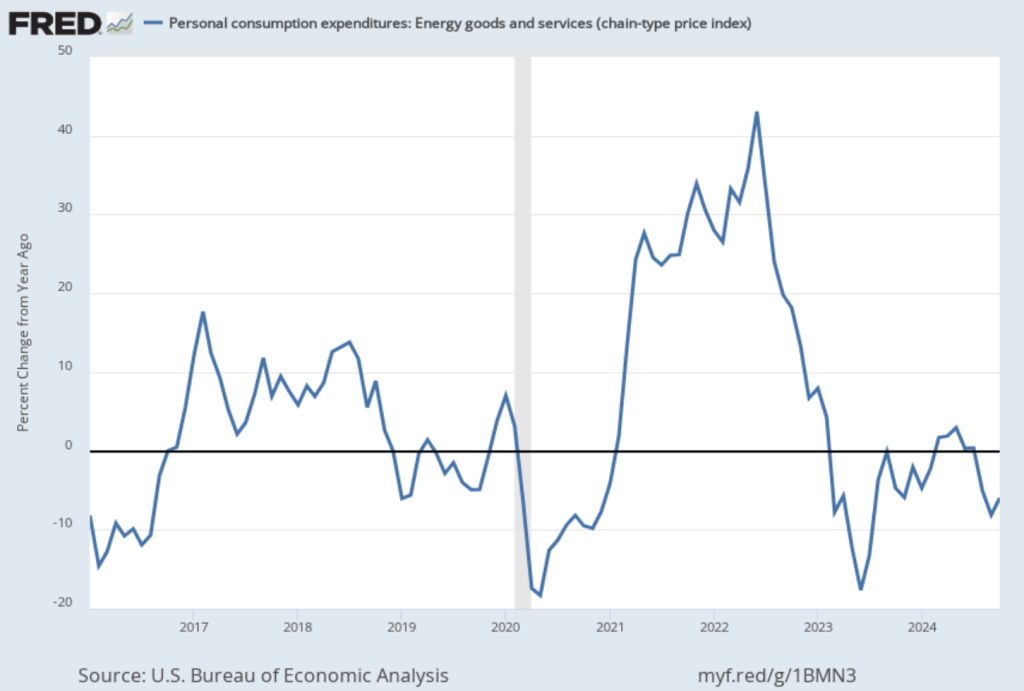
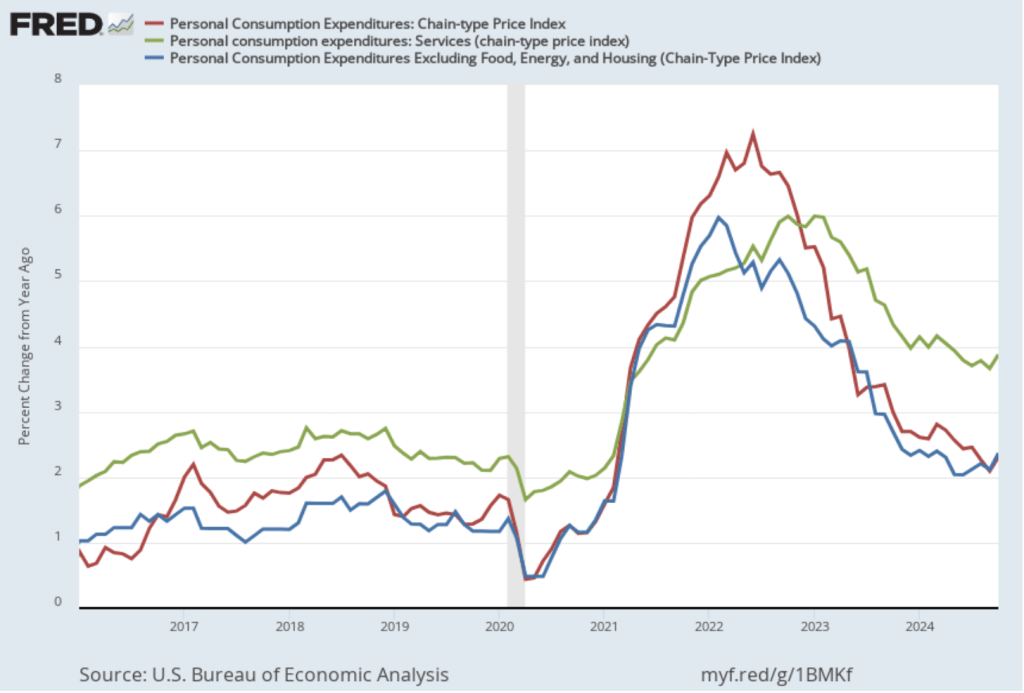
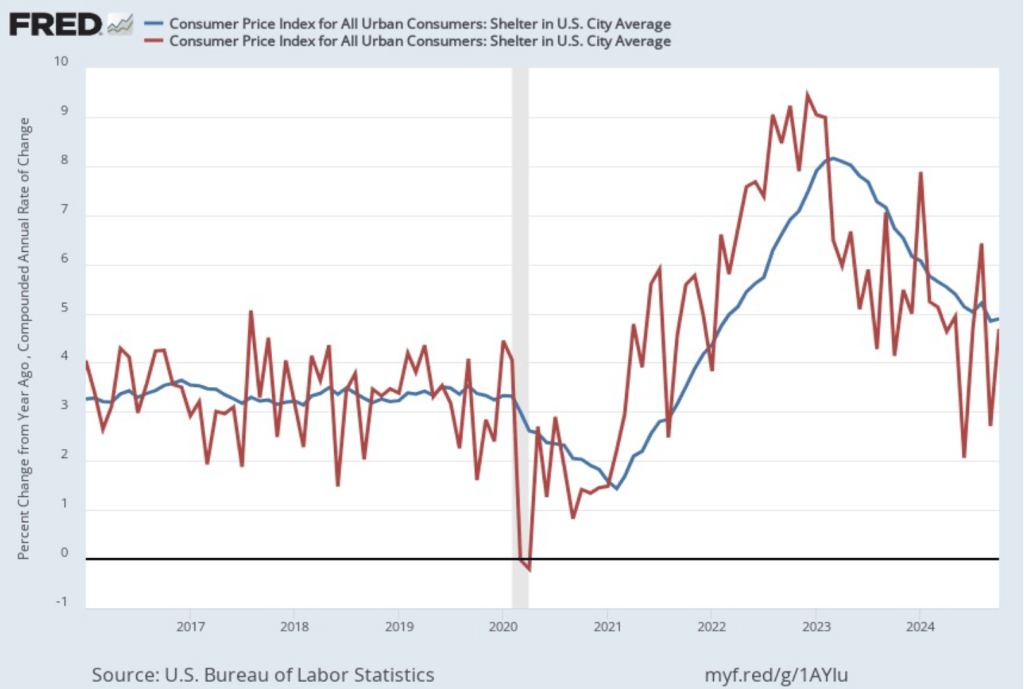
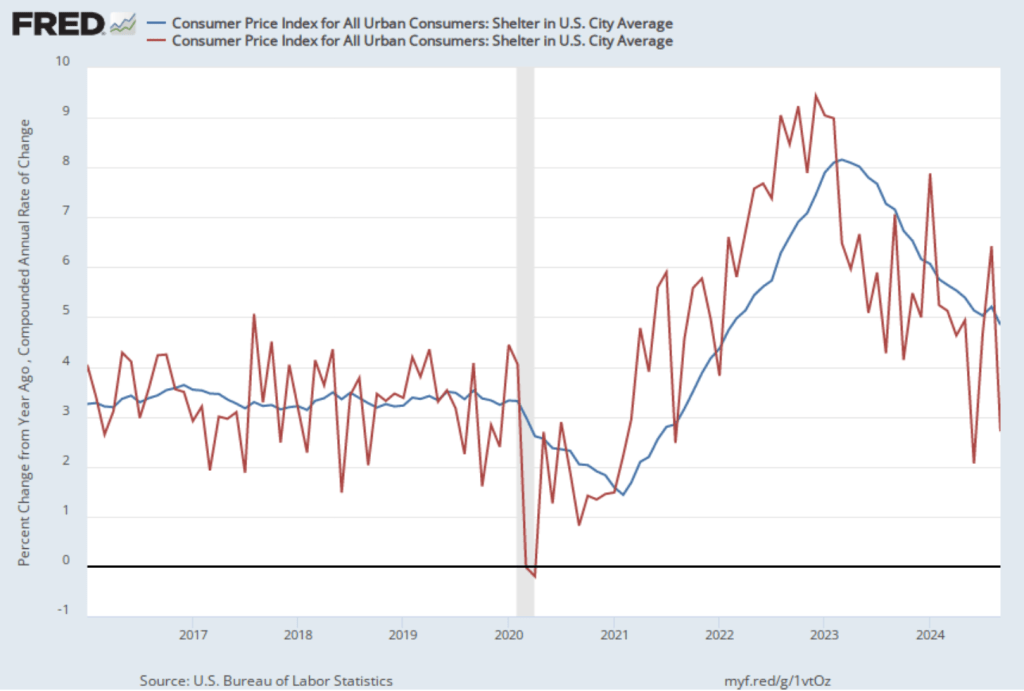
In his press conference, Powell noted that the main reason that PCE inflation remains high is that inflation in the prices of housing services has been running high, as have the prices of some other services. Noting that monetary policy affects the economy “with long and variable lags,” Powell stated that he believes that inflation is still on track to fall to the 2 percent target.
Given that inflation has been running closer to 2.5 percent and that the committee expects the inflation rate will still be 2.5 percent next year, a reporter asked Powell if the committee had considered the possibility of accepting a 2.5 percent inflation rate in the long run. Powell replied that: “No. We’re not going to settle for [2.5 percent inflation].” He stated that a 2 percent inflation rate is what the Fed “owes the public.”
Finally, Powell indicated that the committee would have to take into account the effects of the incoming Trump Administration’s fiscal policy actions—particularly tariff increases—when they occur. President Trump has stated that he would like to see interest rates decline more quickly, so the committee may face criticism for keeping the target for the federal funds rate higher next year than they had originally intended.