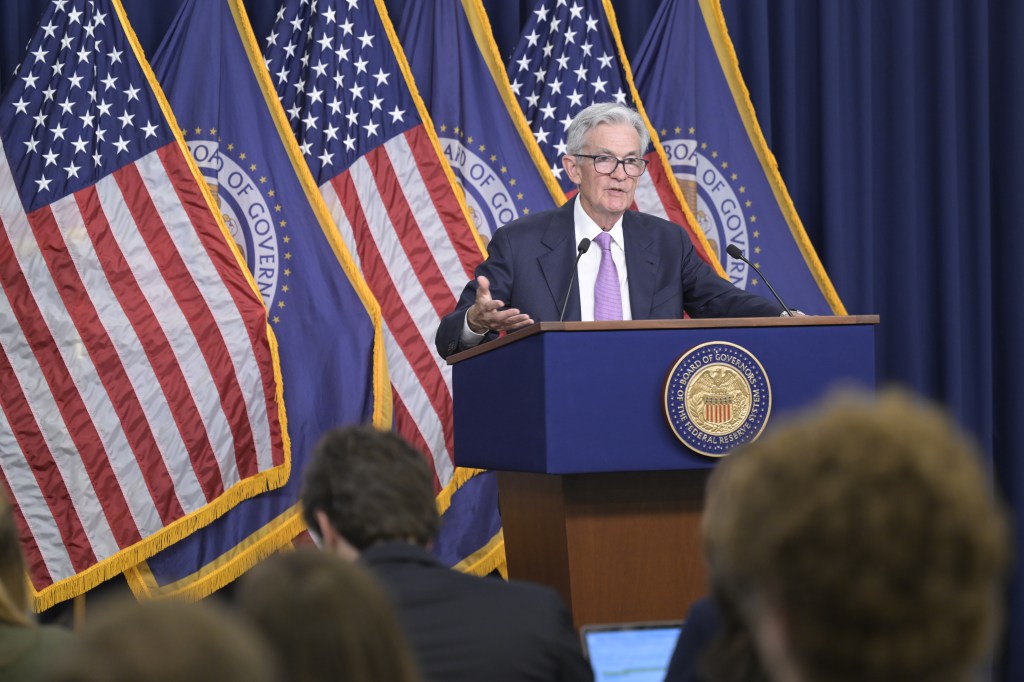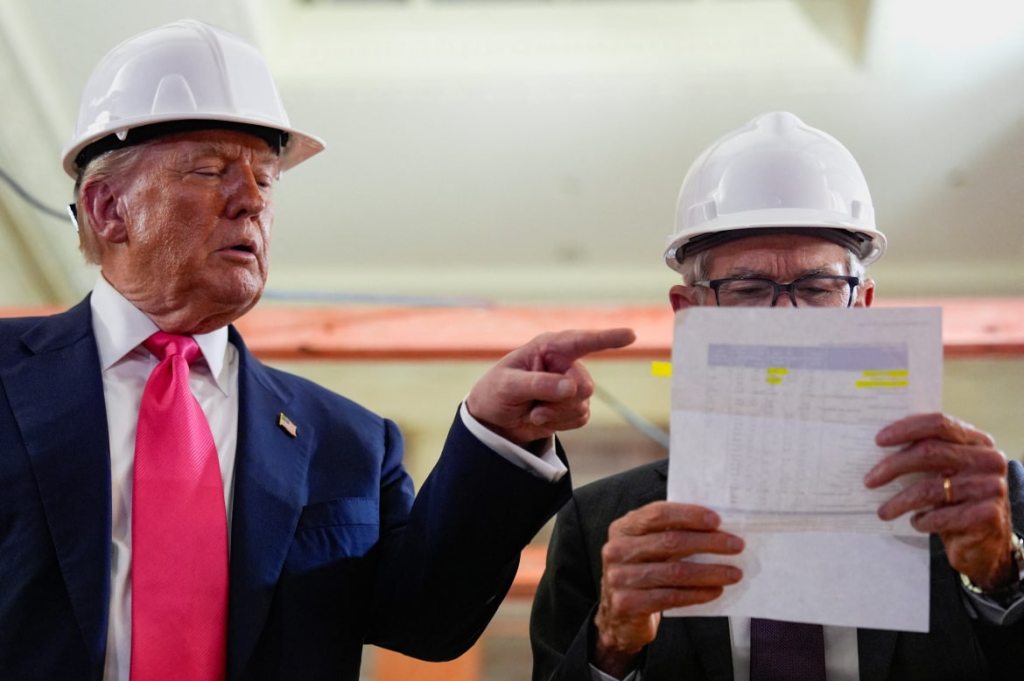
Photo of President Trump and Fed Chair Powell from Reuters via the Wall Street Journal
Today’s meeting of the Federal Reserve’s policymaking Federal Open Market Committee (FOMC) occurred against a backdrop of President Trump pressuring the committee to reduce its target for the federal funds rate and two members of the Board of Governors signalling that they were likely to dissent if the committee voted to hold its target constant.
Last week President Trump made an unusual visit to the Fed’s headquarters in Washington, DC to discuss what he had said was the Fed’s excessive spending on renovating three buildings. As we discuss in this blog post, the Supreme Court is unlikely to allow a president to remove a Fed chair because of disagreements over monetary policy. A president would likely be allowed to remove a Fed chair “for cause.” Some members of the Trump administration have argued that excessive spending on renovating buildings might be sufficient cause for the president to remove Fed Chair Jerome Powell. President Trump has indicated that, in fact, he doesn’t intend to replace Powell before his term as chair ends in May 2026, but President Trump still urged Powell to make substantial cuts in the federal funds rate target.
As most observers had expected, the committee decided today to keep its target range for the federal funds rate unchanged at 4.25 percent to 4.50 percent. Board of Governors members Michelle Bowman and Christopher Waller dissented, preferring “to lower the target range for the federal funds rate by 1/4 percentage point at this meeting.” It was the first time since 1993 that two members of the Board of Governors have voted against an FOMC decision.
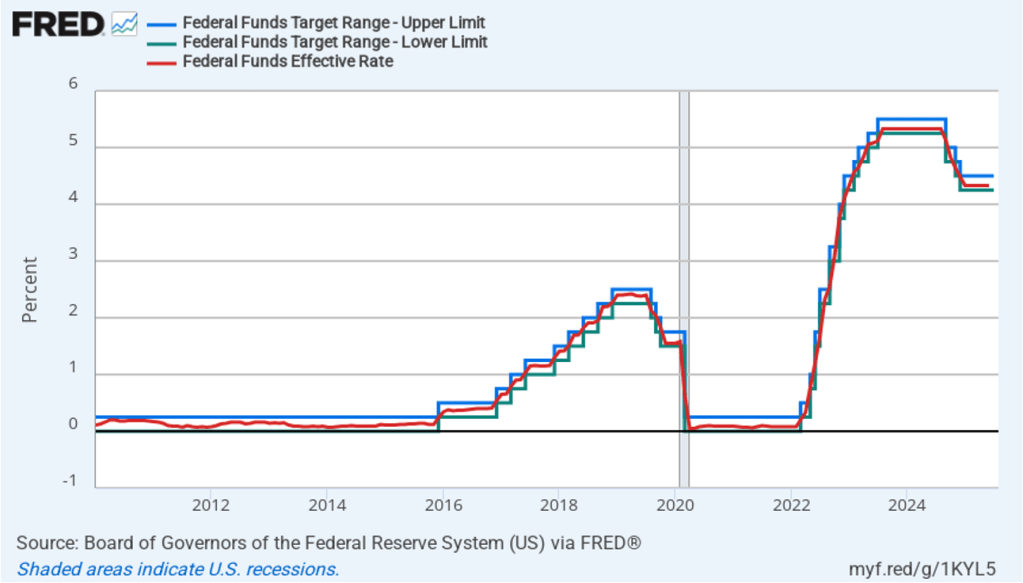
The following figure shows, for the period since January 2010, the upper bound (the blue line) and lower bound (the green line) for the FOMC’s target range for the federal funds rate and the actual values of the federal funds rate (the red line) during that time. Note that the Fed has been successful in keeping the value of the federal funds rate in its target range. (We discuss the monetary policy tools the FOMC uses to maintain the federal funds rate in its target range in Macroeconomics, Chapter 15, Section 15.2 (Economics, Chapter 25, Section 25.2).)
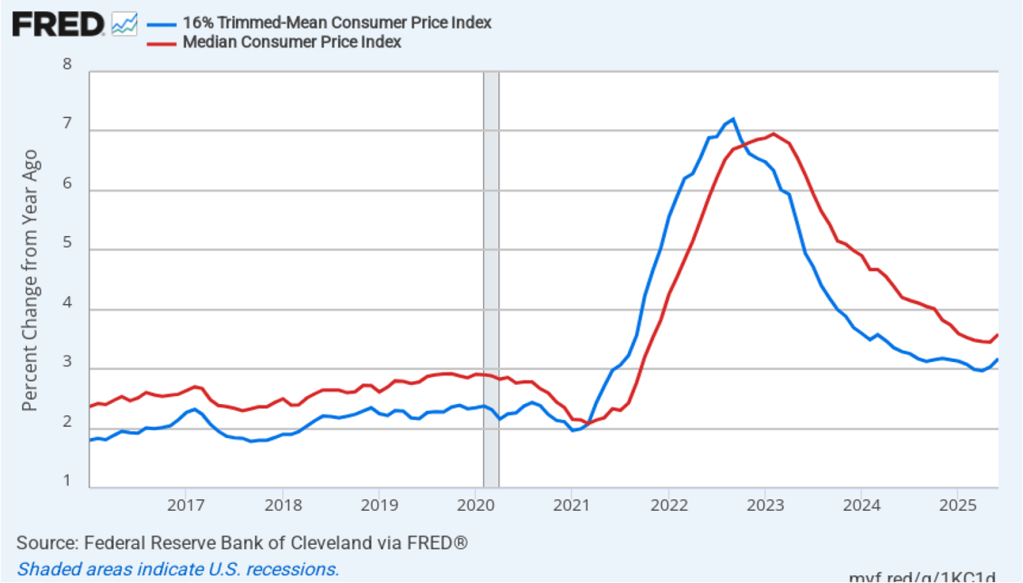
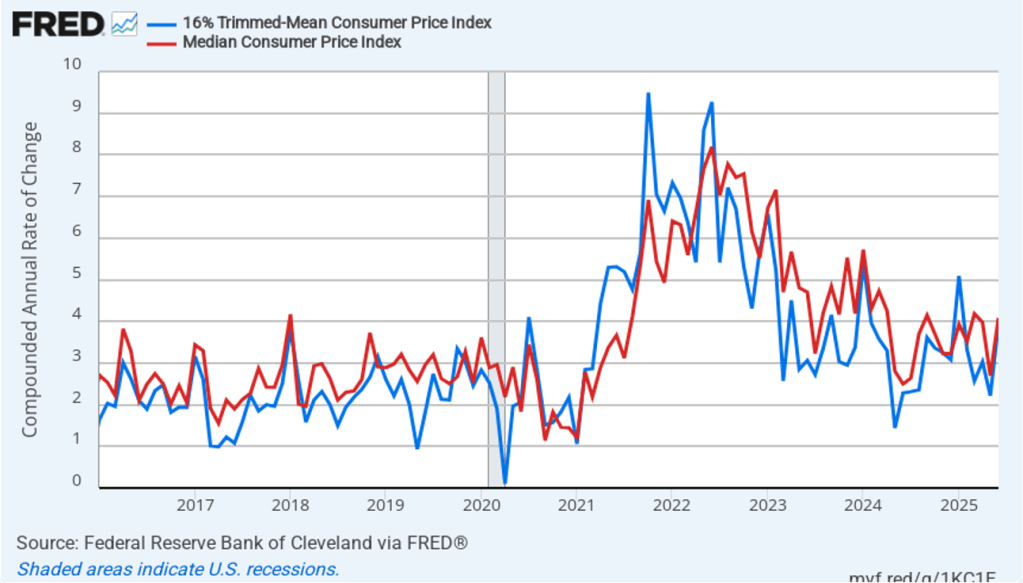
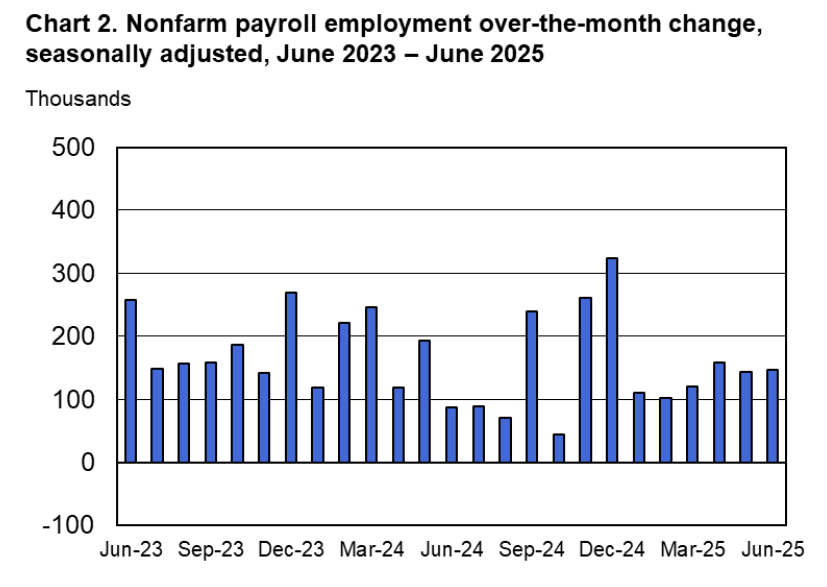
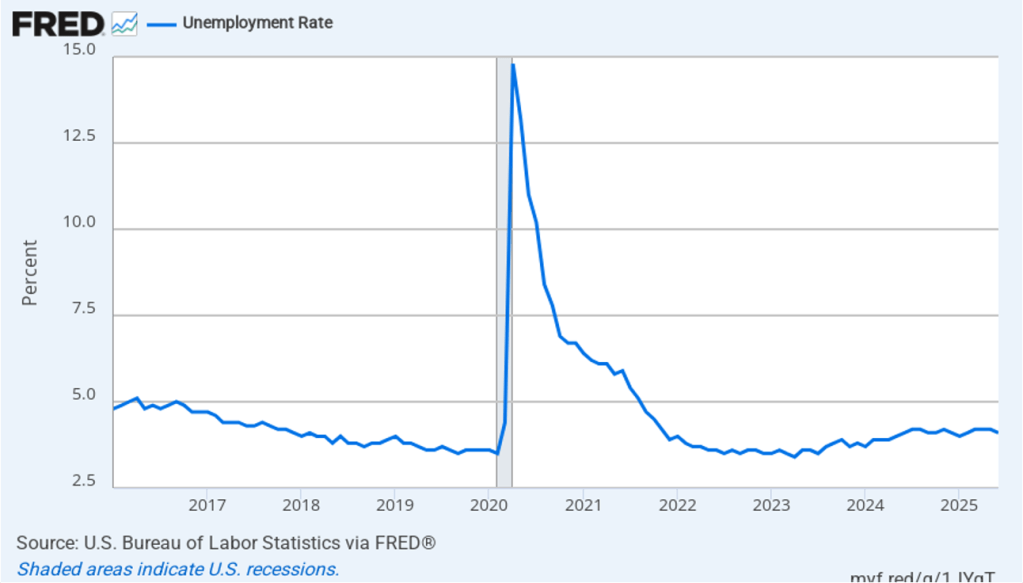
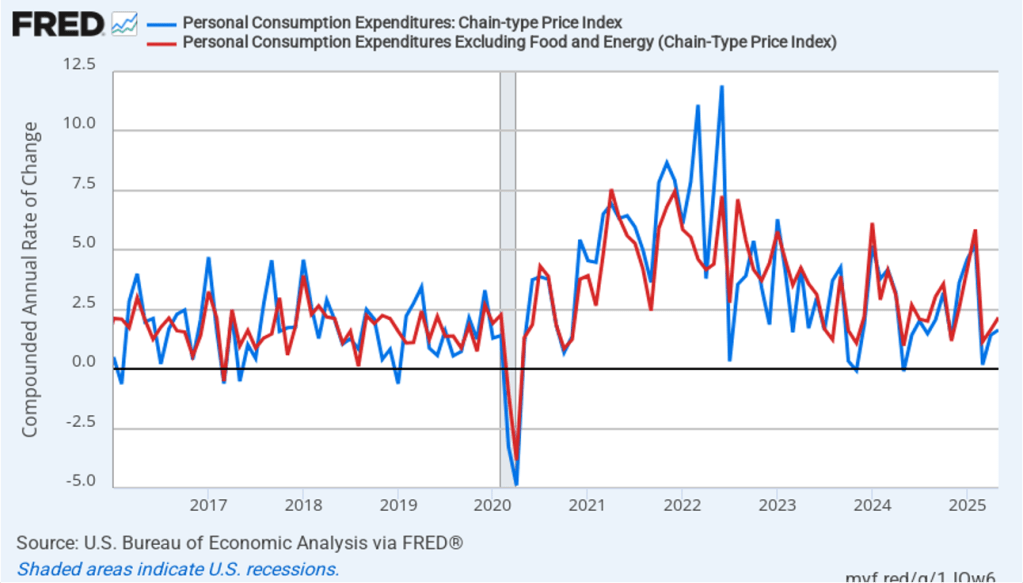
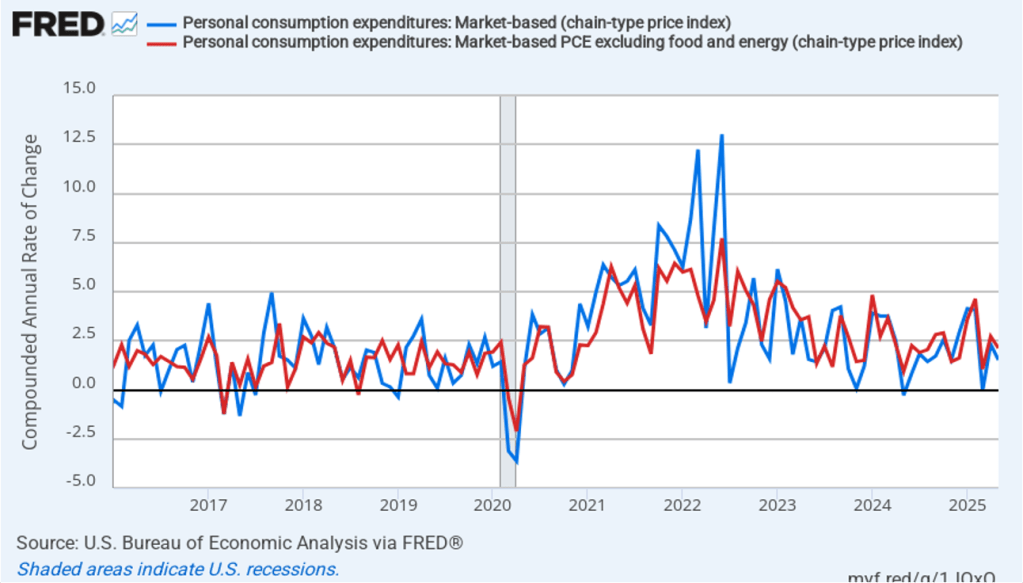
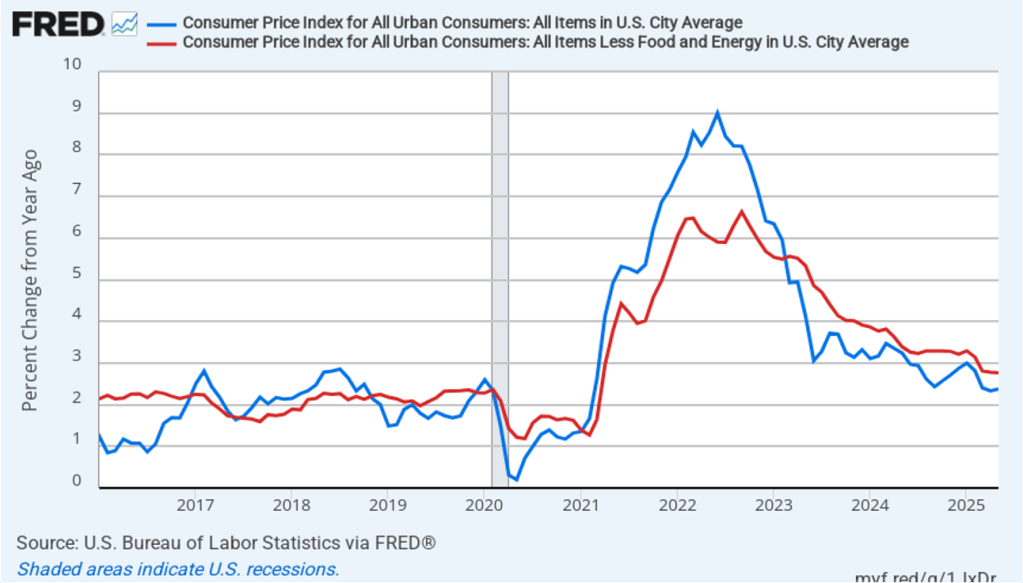
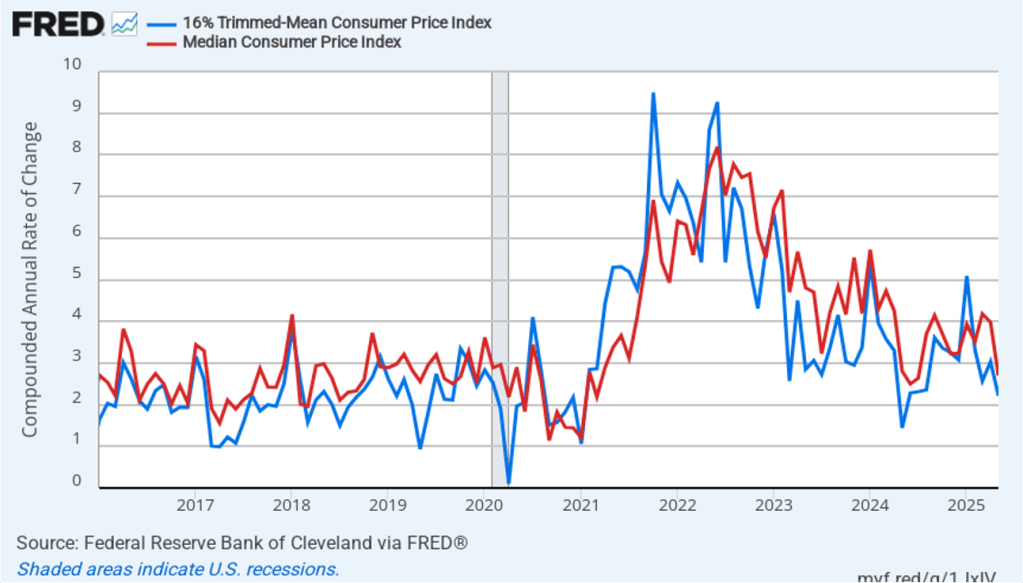
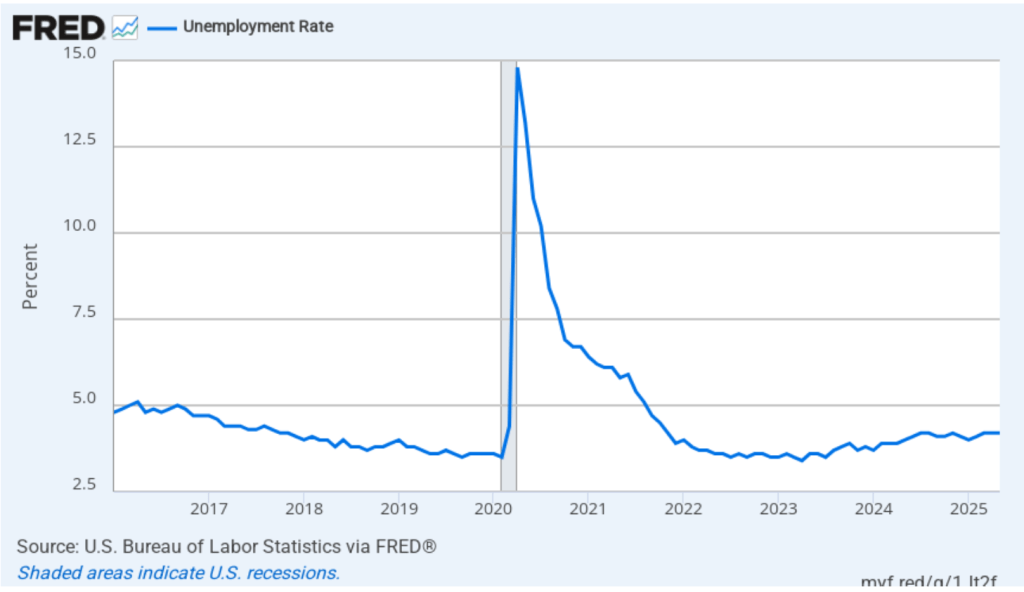
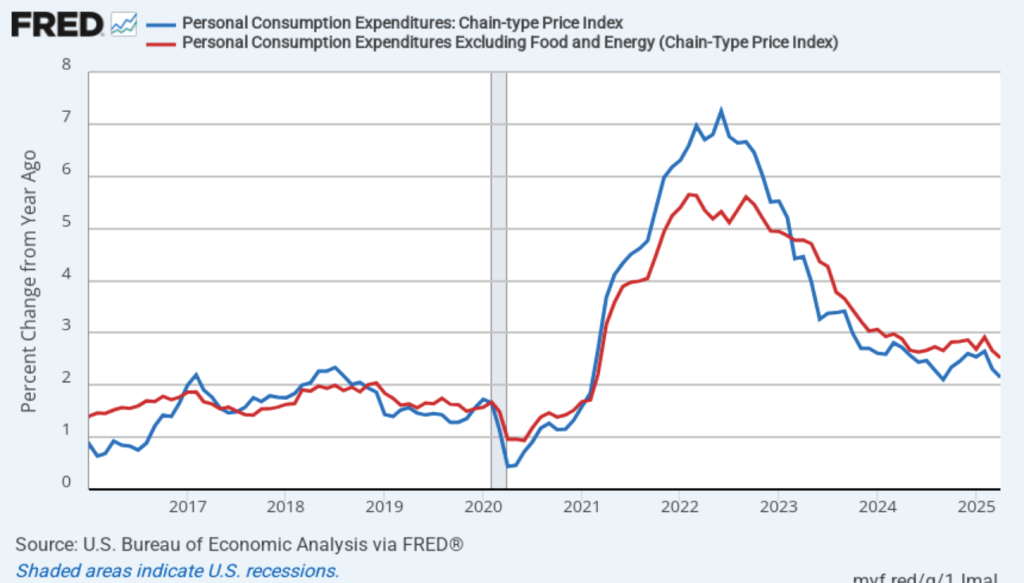
In his press conference following the meeting, Chair Powell indicated that a majority of the committee believed that: “Inflation is above target, maximum employment is at target, so policy should be slightly restrictive.” Policy is restrictive in the sense that the current range for the federal funds rate is higher than the long-run equilibrium rate. Powell noted that: “There are many uncertainties left to resolve. There is much more to come looking ahead.” Jn particular, with respect to the effect of tariffs, he stated that it’s “still quite early days …. [We’ve] seen substantial increases in tariff revenue collections … [but we] have to see how much of tariffs are passed through to consumers. A long way to go to know what has happened.”
One reason that President Trump has urged the FOMC to lower its target for the federal funds rate is that lower interest rates will reduce the amount the federal government has to pay on the $25 trillion in U.S. Treasury debt owned by private investors. At his press conference, Chair Powell was asked whether the committee discussed interest payments on the national debt during its deliberations. He responded that the committee considers only the dual mandate of price stability and maximum employment given to the Fed by Congress. Therefore, “We don’t consider the fiscal needs of the federal government.”
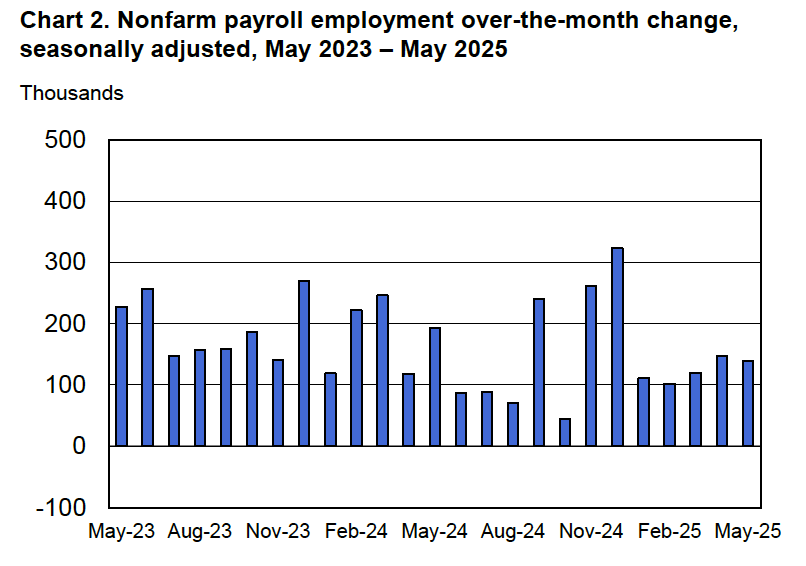
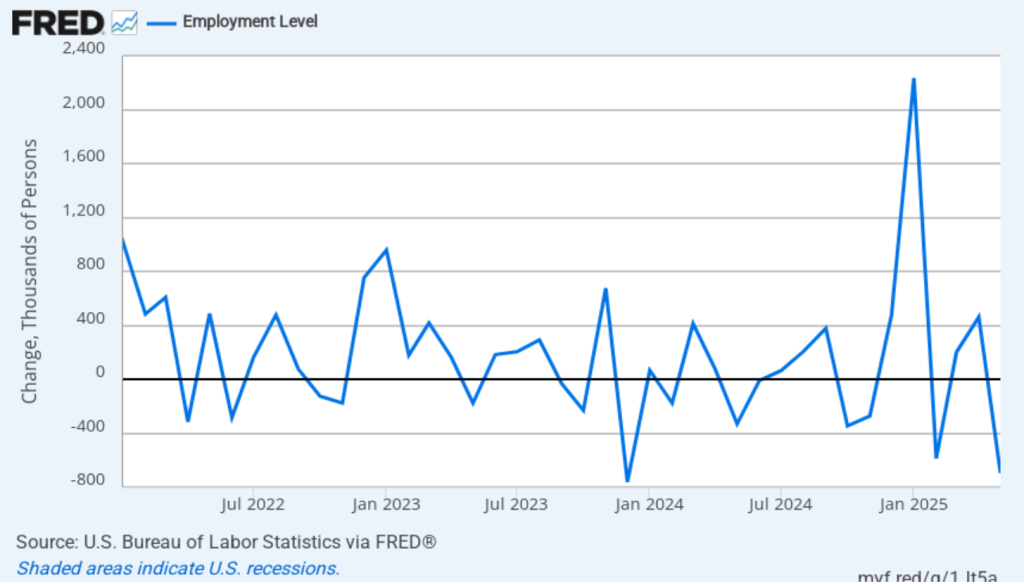
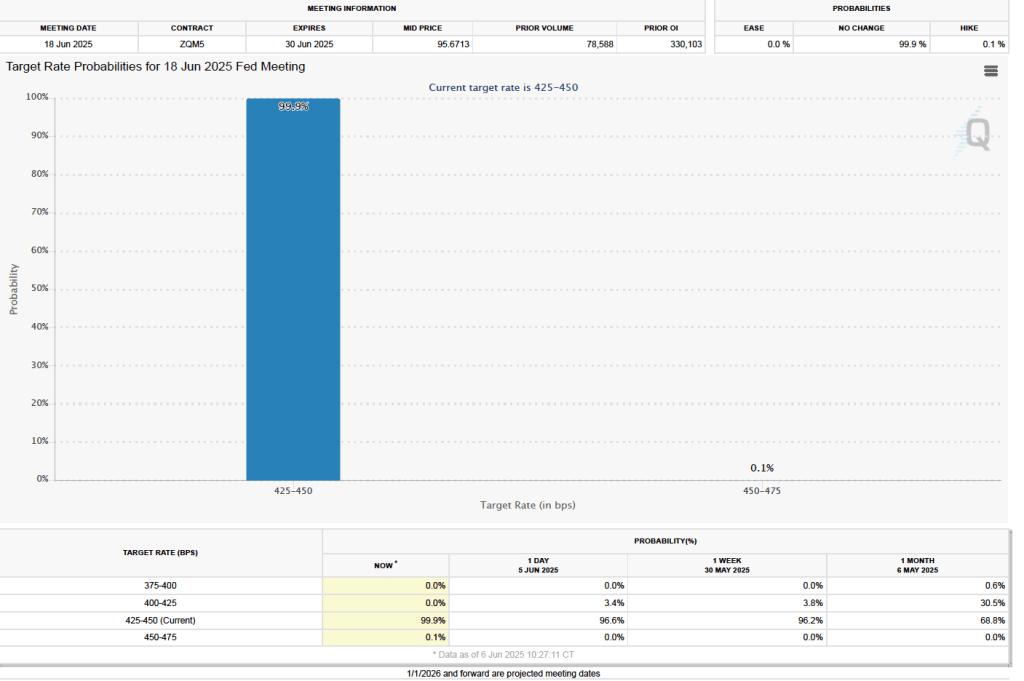
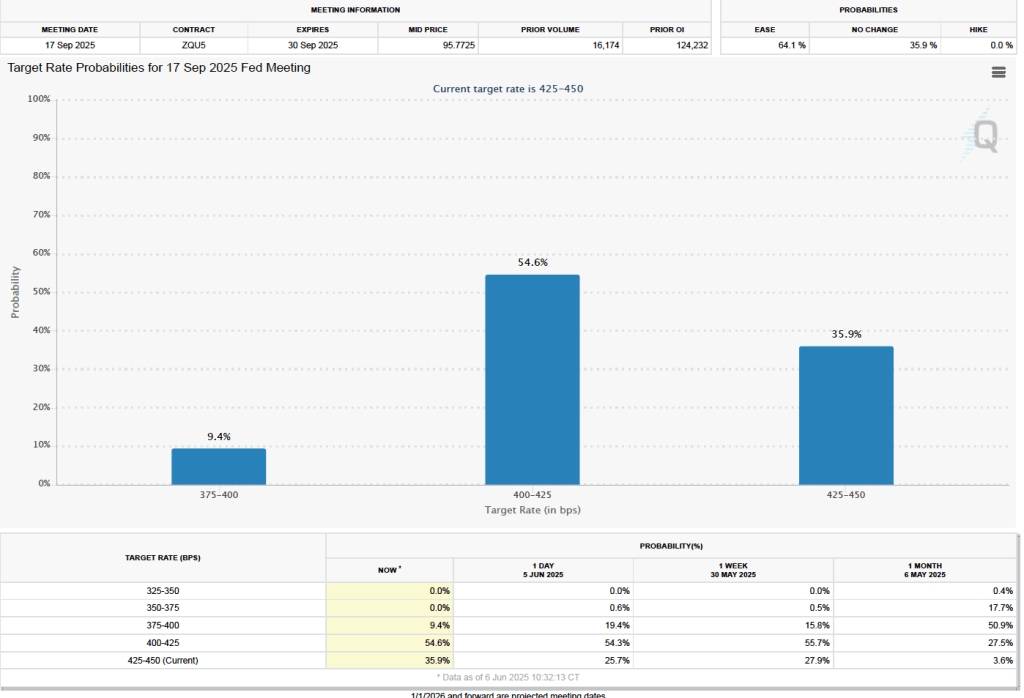
The FOMC’s next meeting is on September 16–17. Powell noted that before that meeting, the committee will have seen two more employment reports and two more inflation reports. The data in those reports may clarify the state of the economy. There has been a general expectation that the committee would cut its target for the federal funds rate at that meting
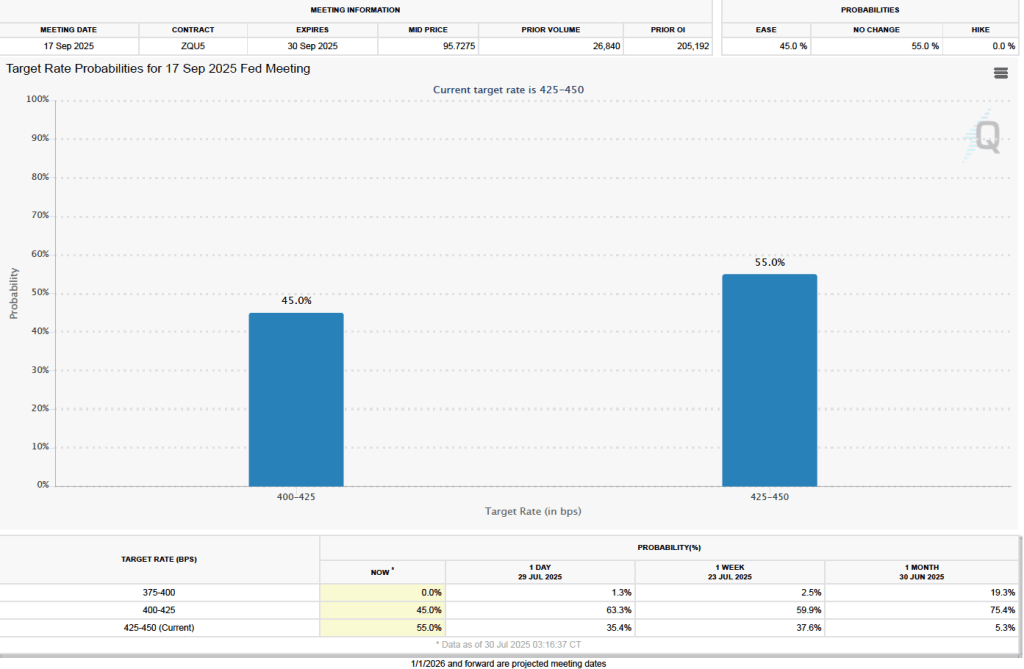
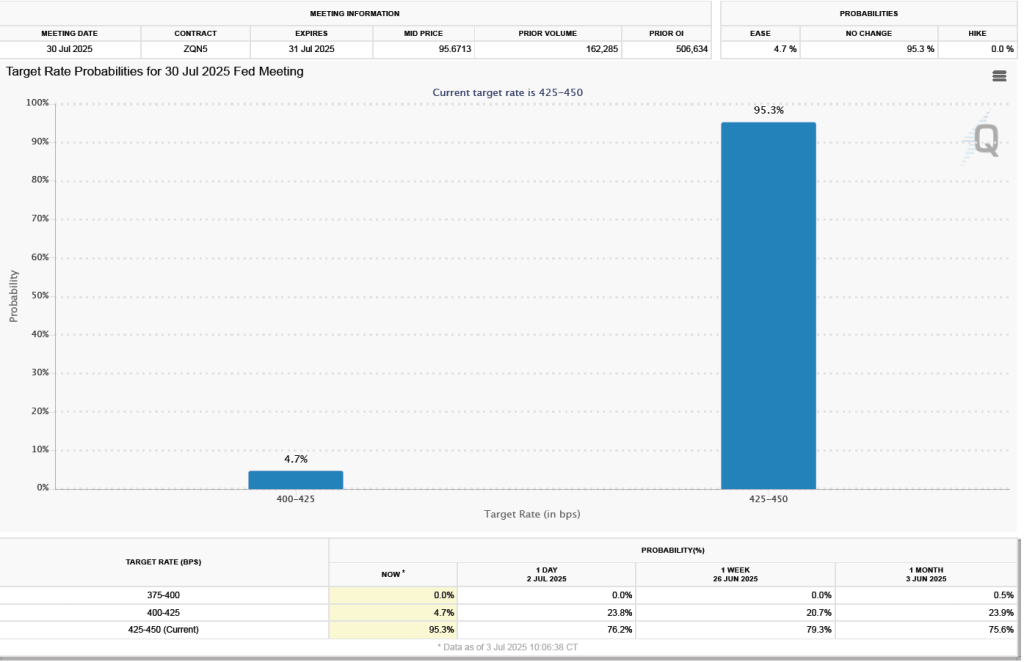
One indication of expectations of future changes in the FOMC’s target for the federal funds rate comes from investors who buy and sell federal funds futures contracts. (We discuss the futures market for federal funds in this blog post.) The data from the futures market indicate that one month ago investors assigned a 75.4 percent probability to the committee cutting its target range by 0.25 percentage point (25 basis points) to 4.00 percent to 4.25 percent at the September meeting. Today, however, sentiment has changed, perhaps because investors now believe that inflation in coming months will be higher than they had previously expected. As the following figure shows, investors now assign a 55.0 percent probability to the committee leaving its target for the federal funds rate unchanged at that meeting and only a 45 percent probability of the committee cutting its target range by 25 basis points.