Image generated by GTP-4o “illustrating interest rates.”
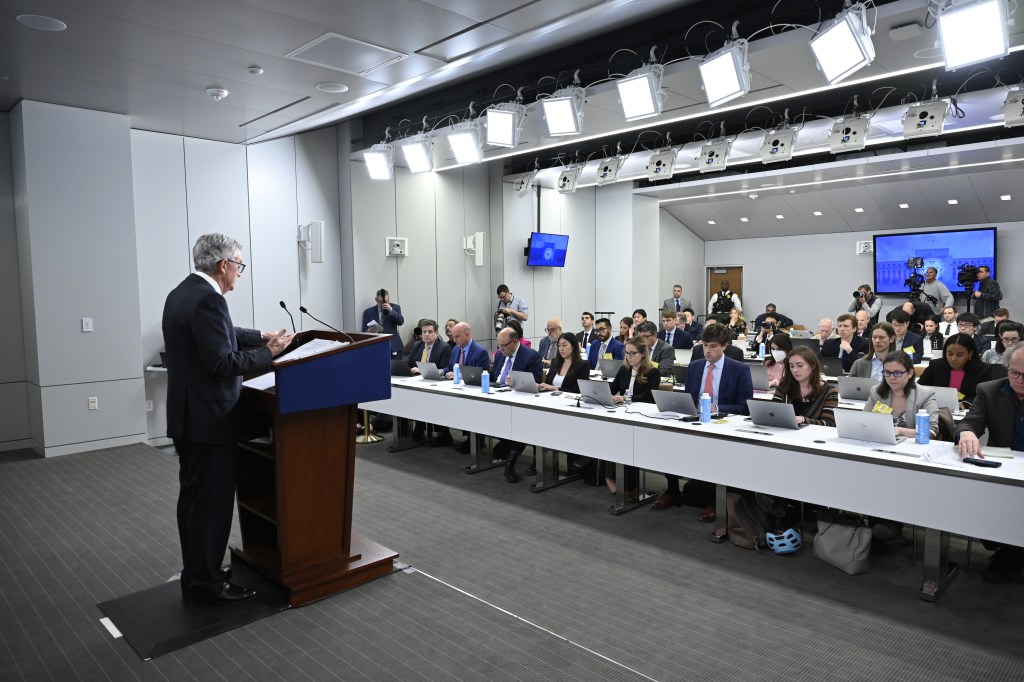
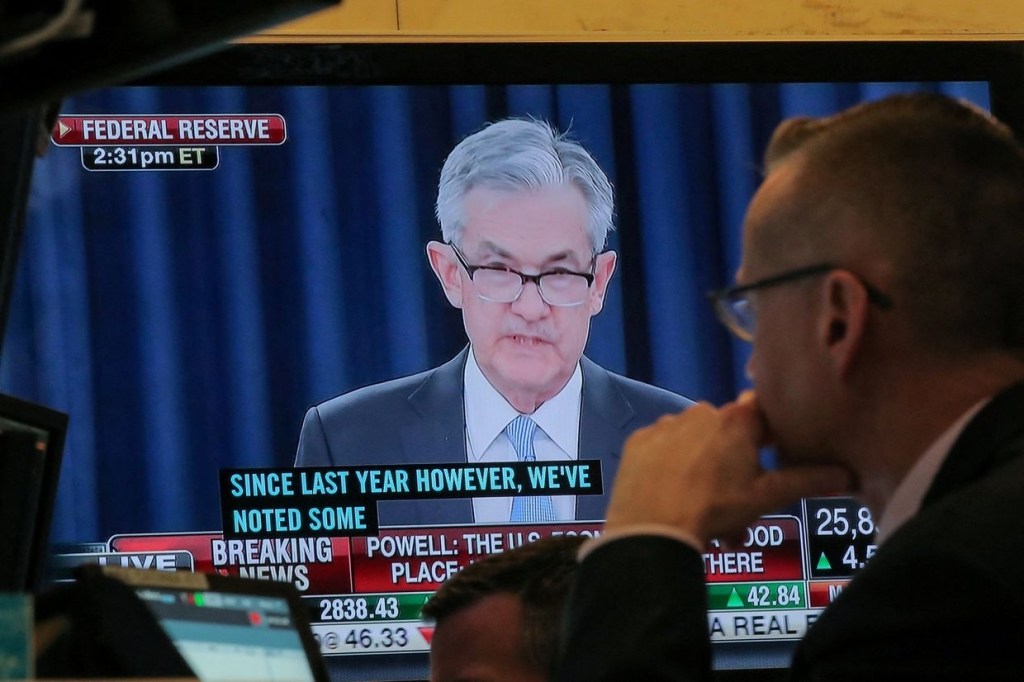
Tomorrow (September 18) at 2 p.m. EDT, the Federal Reserve’s policy-making Federal Open Market Committee (FOMC) will announce its target for the federal funds rate. It’s been clear since Fed Chair Jerome Powell’s speech on August 23 at the Kansas City Fed’s annual monetary policy symposium held in Jackson Hole, Wyoming that the FOMC would cut its target for the federal funds rate at its meeting on September 17-18. (We discuss Powell’s speech in this blog post.)
The only suspense has been over the size of the cut. Traditionally, the FOMC has raised or lowered its target for the federal funds rate in 0.25% (or 25 basis points) increments. Occasionally, however, either because economic conditions are changing rapidly or because the committee concludes that it has been adjusting its target too slowly (“fallen behind the curve” is the usual way of putting it) the committee makes 0.50% (50 basis points) changes to its target.
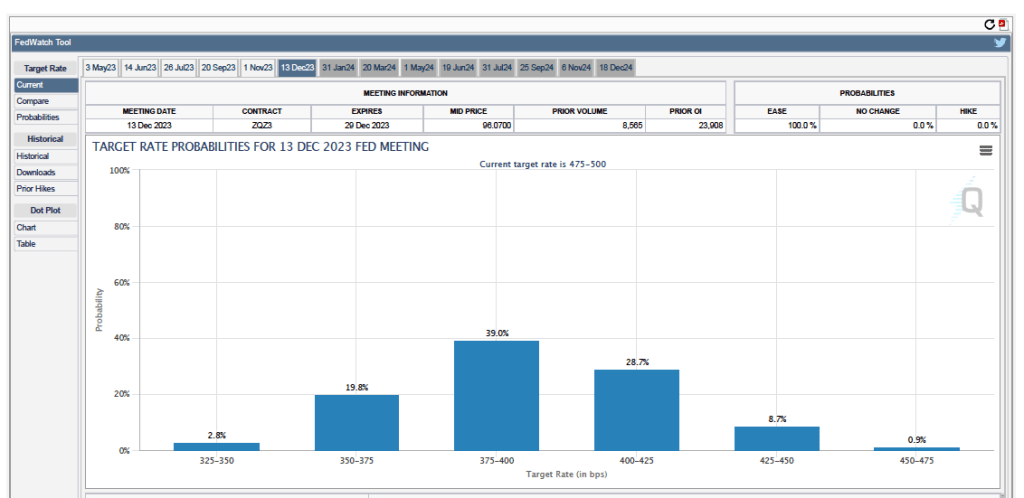
Futures markets allow investors to buy and sell futures contracts on commodities–such as wheat and oil–and on financial assets. Investors can use futures contracts both to hedge against risk—such as a sudden increase in oil prices or in interest rates—and to speculate by, in effect, betting on whether the price of a commodity or financial asset is likely to rise or fall. (We discuss the mechanics of futures markets in Chapter 7, Section 7.3 of Money, Banking, and the Financial System.) The CME Group was formed from several futures markets, including the Chicago Mercantile Exchange, and allows investors to trade federal funds futures contracts. The data that result from trading on the CME indicate what investors in financial markets expect future values of the federal funds rate to be.
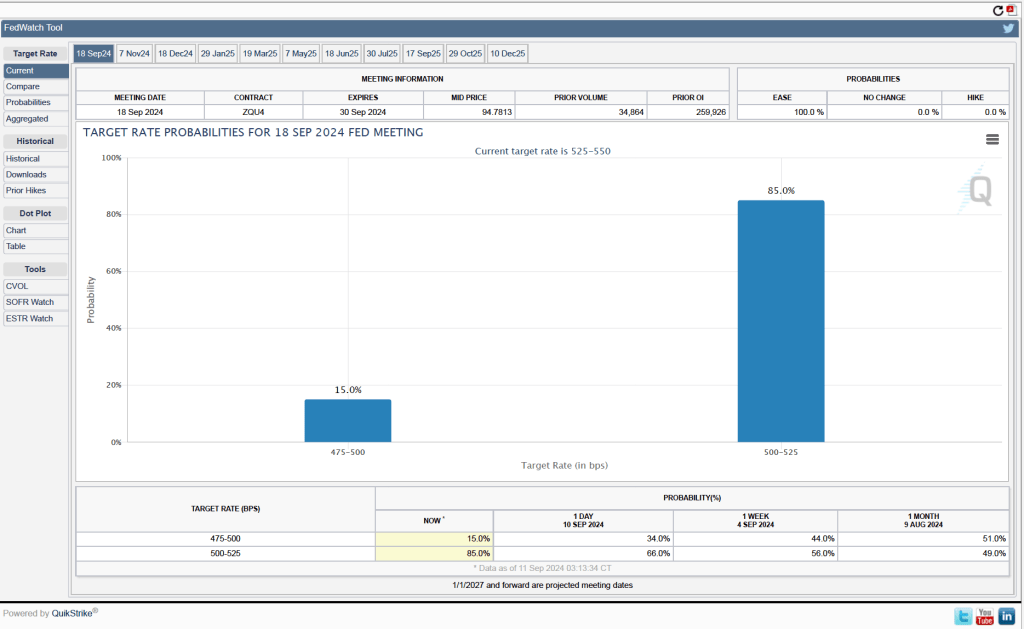
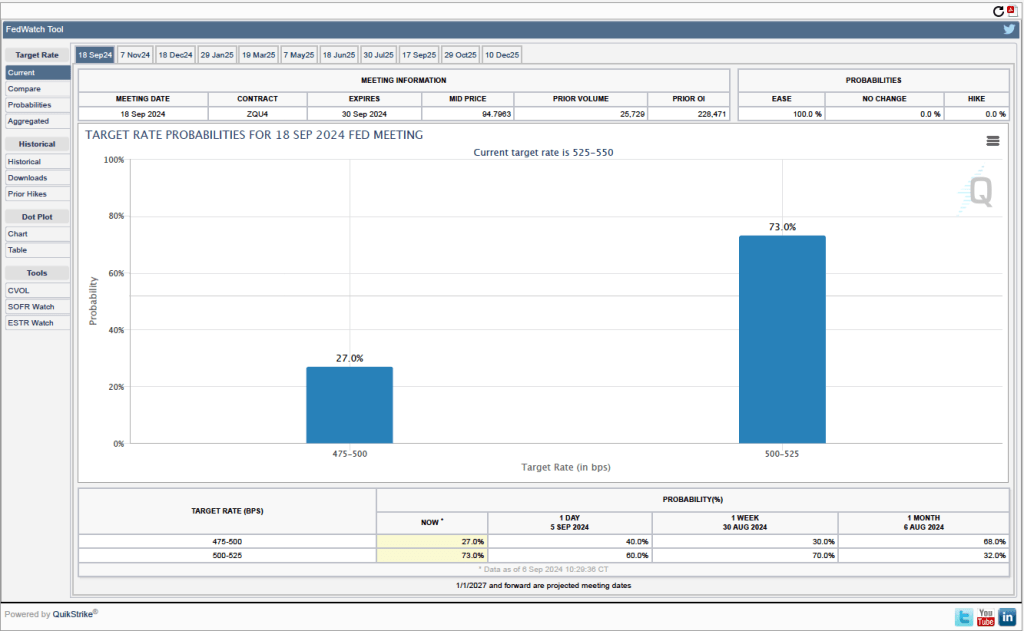
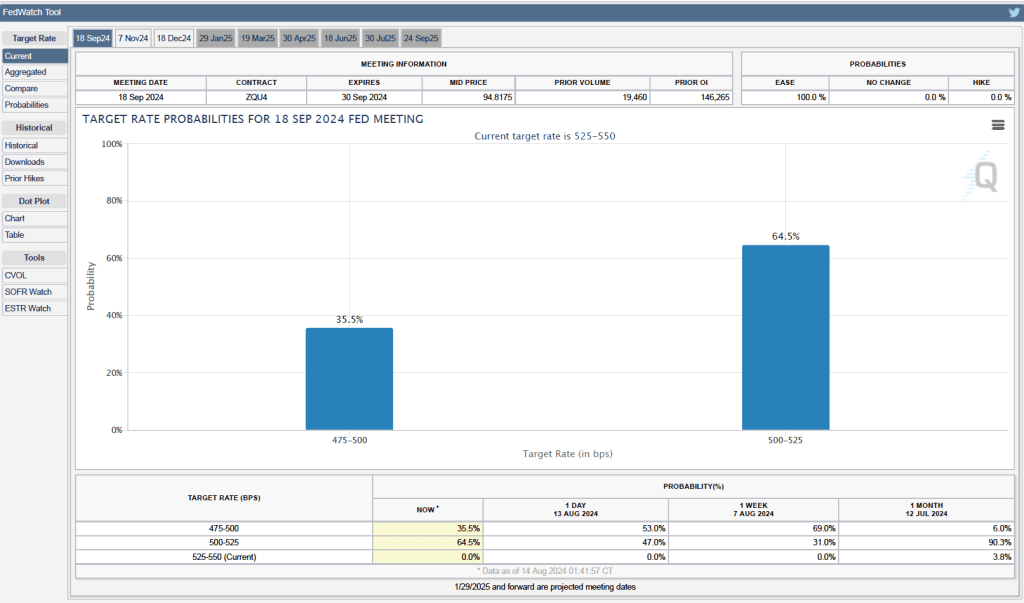
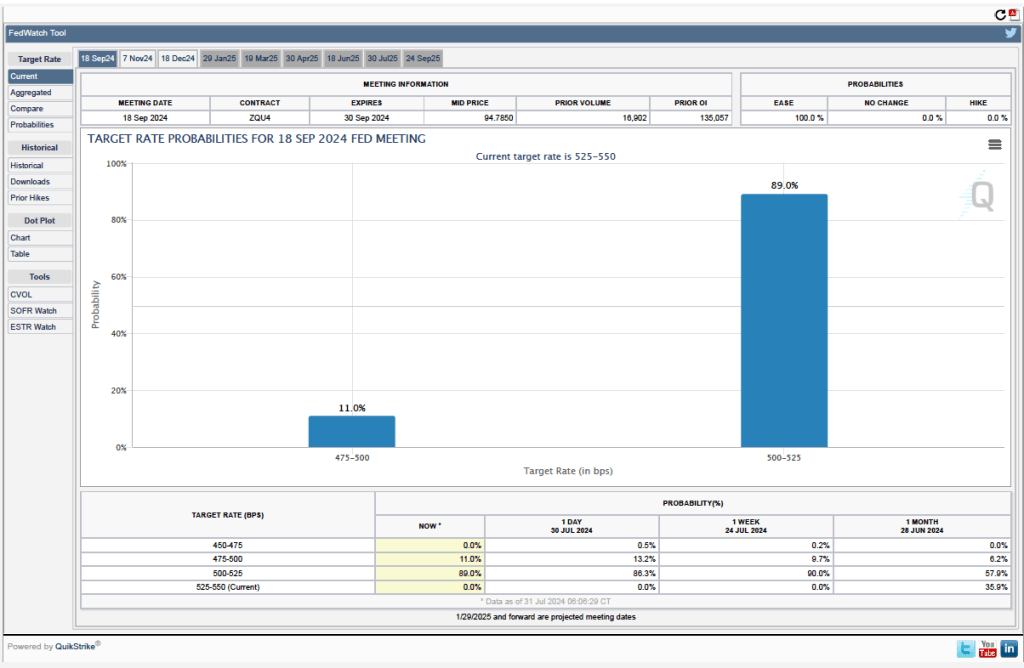
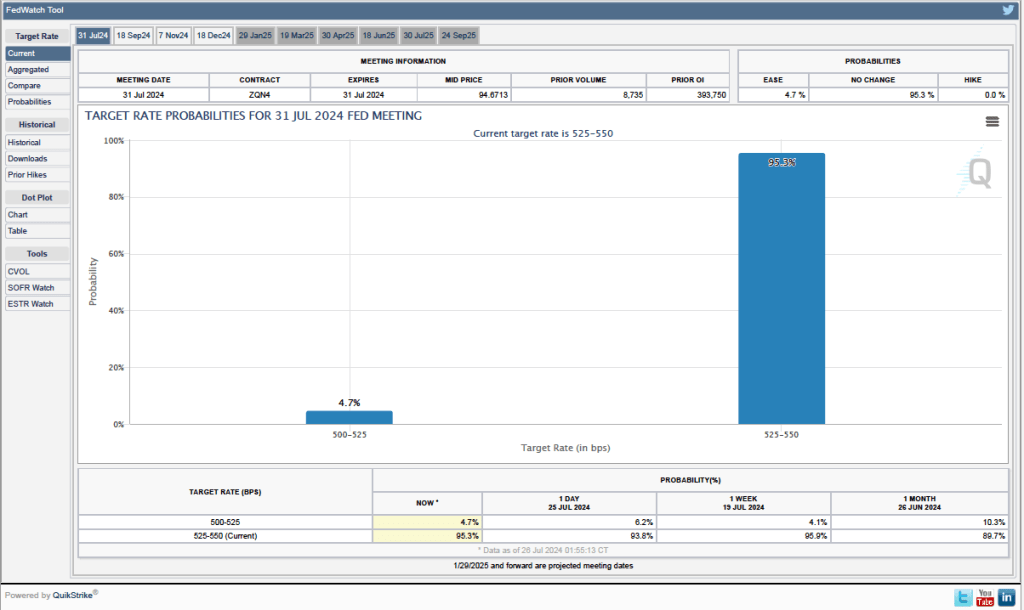
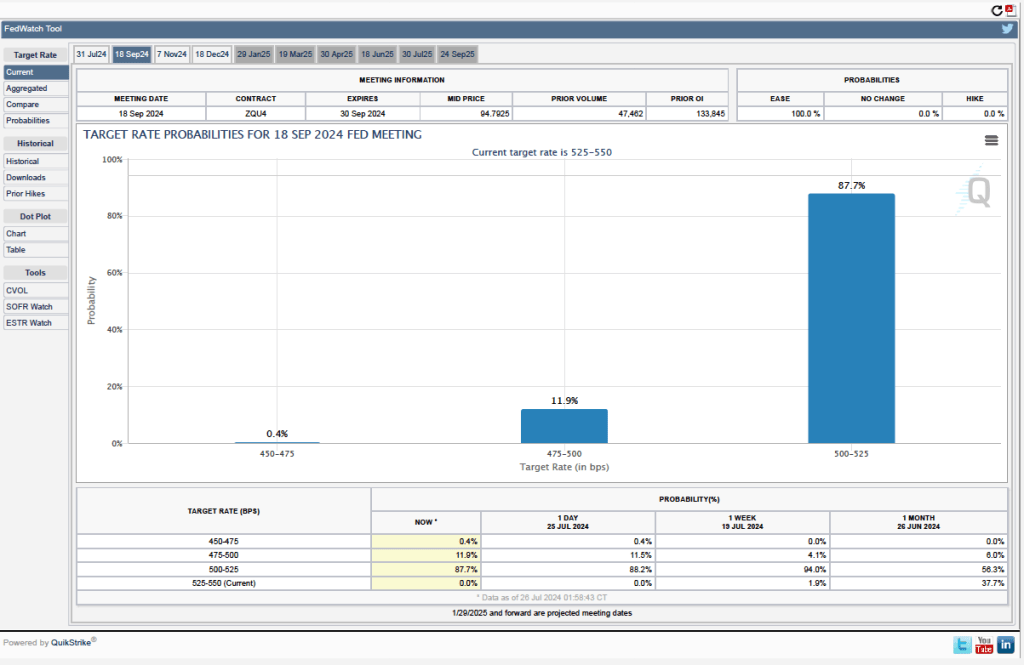
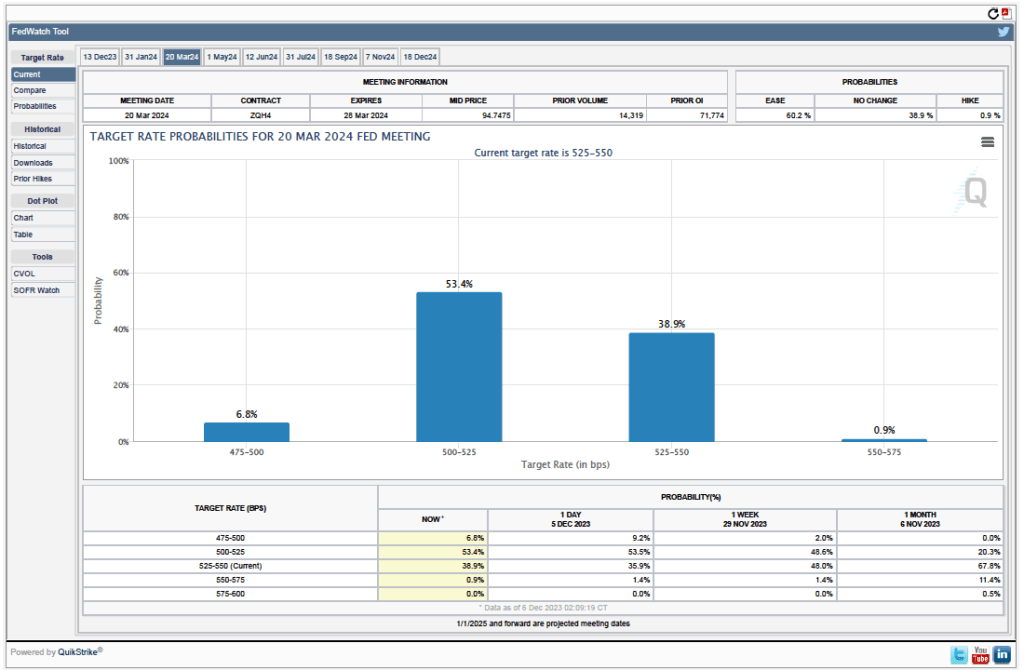
The following figure summarizes the implied probabilities from federal funds rate futures trading of the FOMC cutting its target by 25 basis points (the orange bars) or 50 basis points (the blue bars) at tomorrow’s meeting. The probabilities on four days are shown—today, yesterday, one week ago, and one month ago.
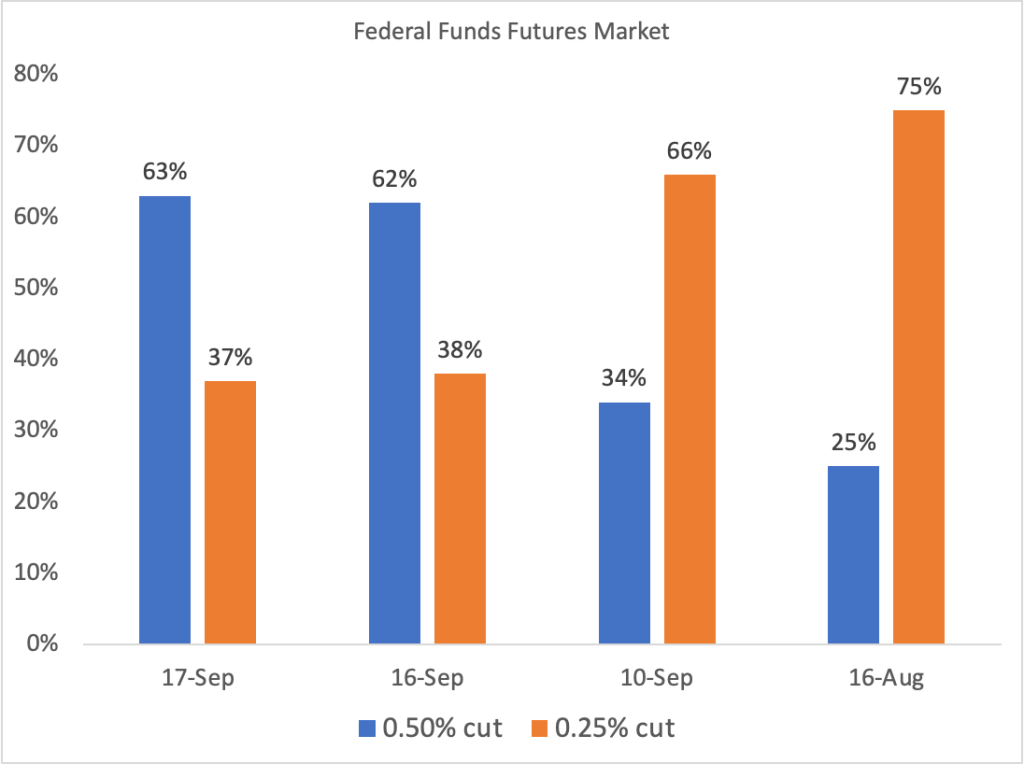
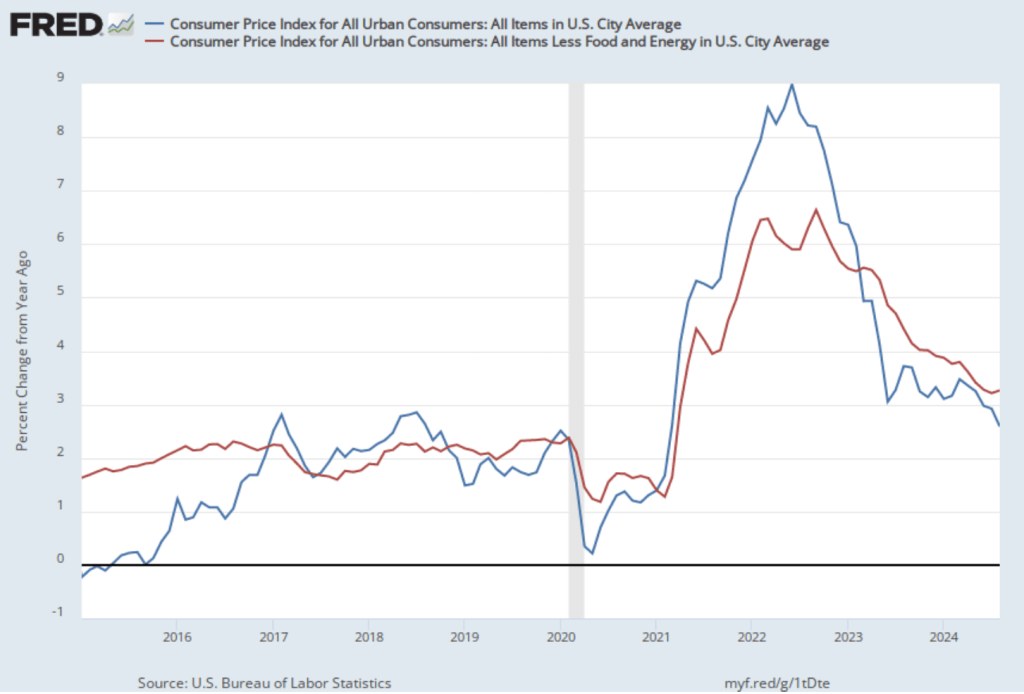
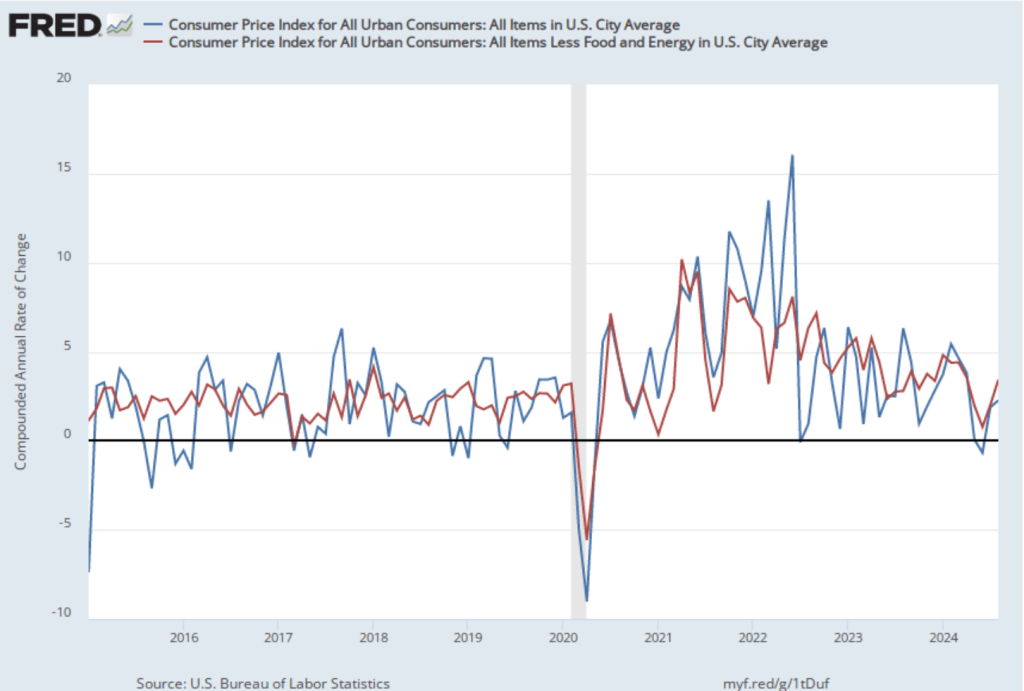
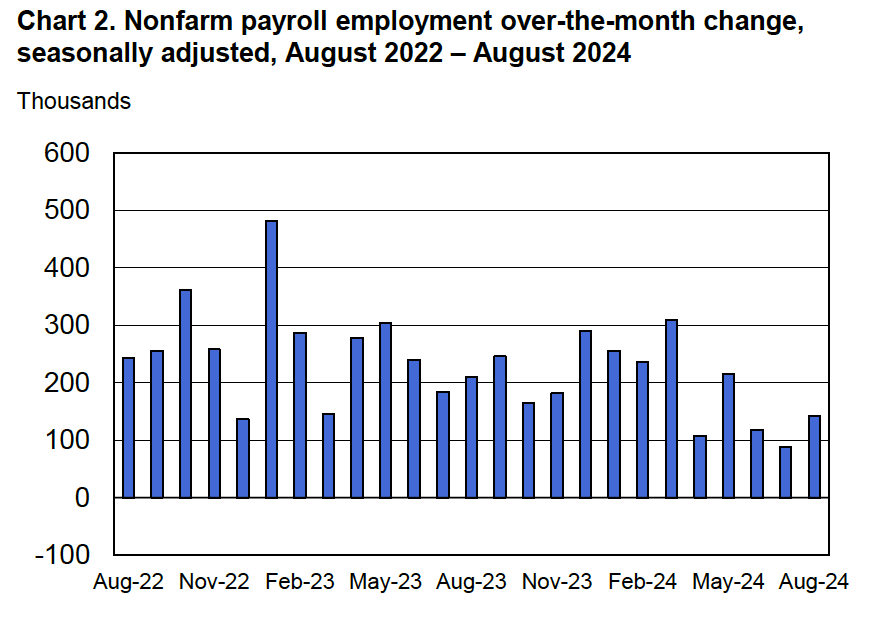
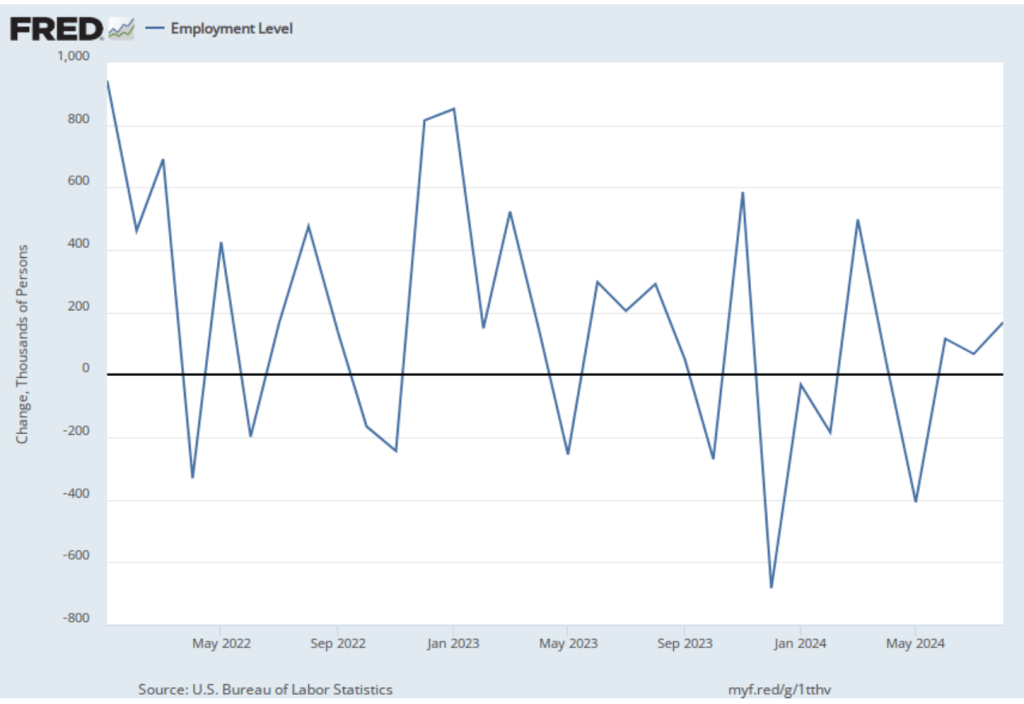
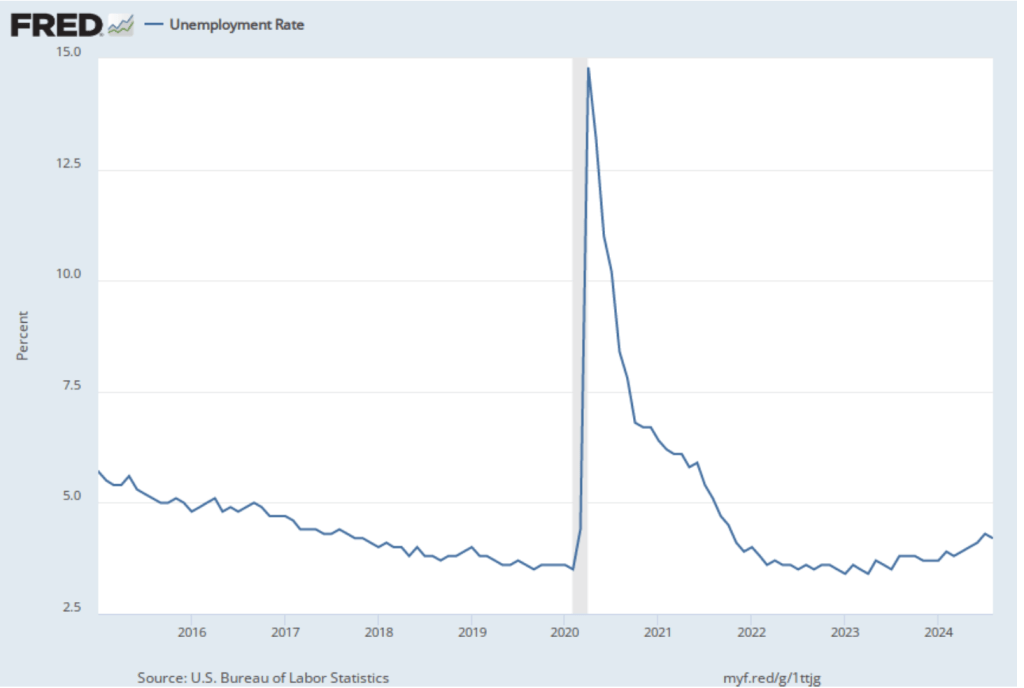
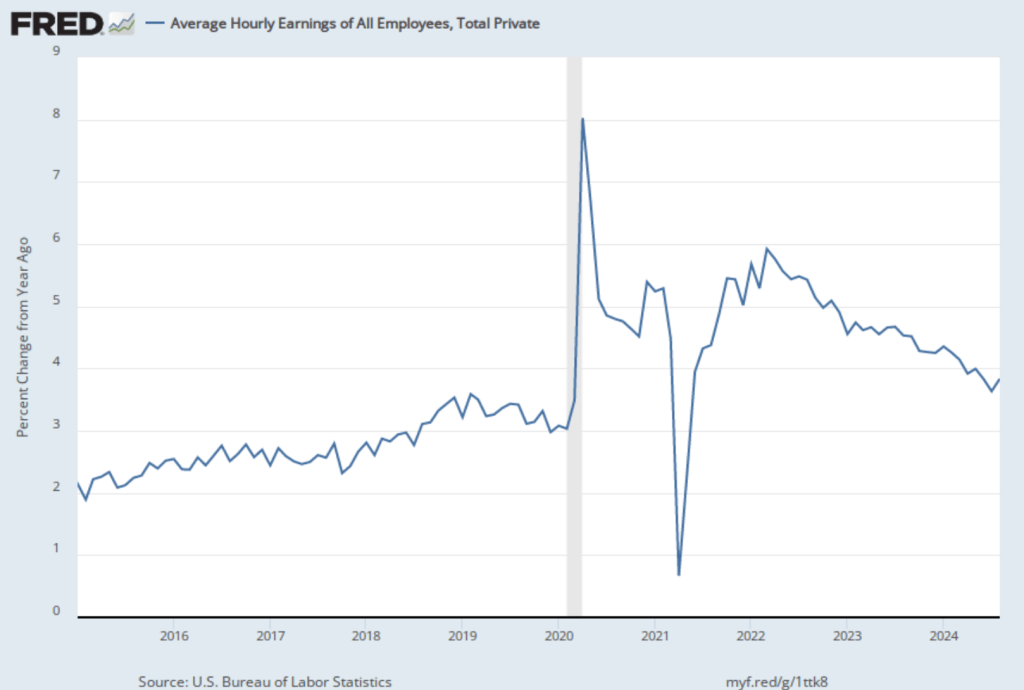
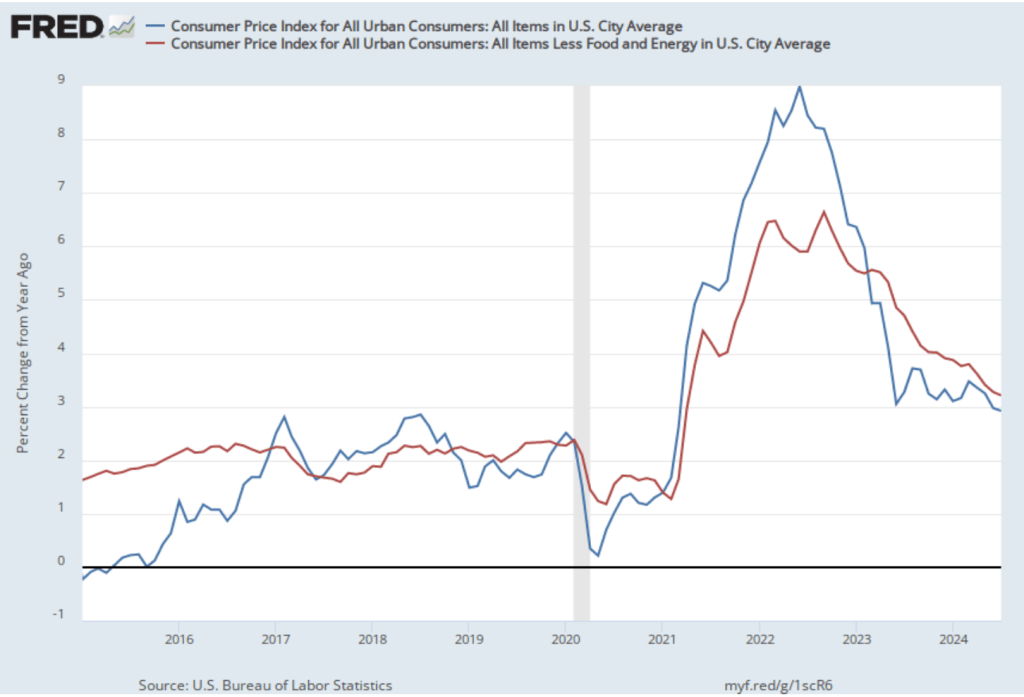
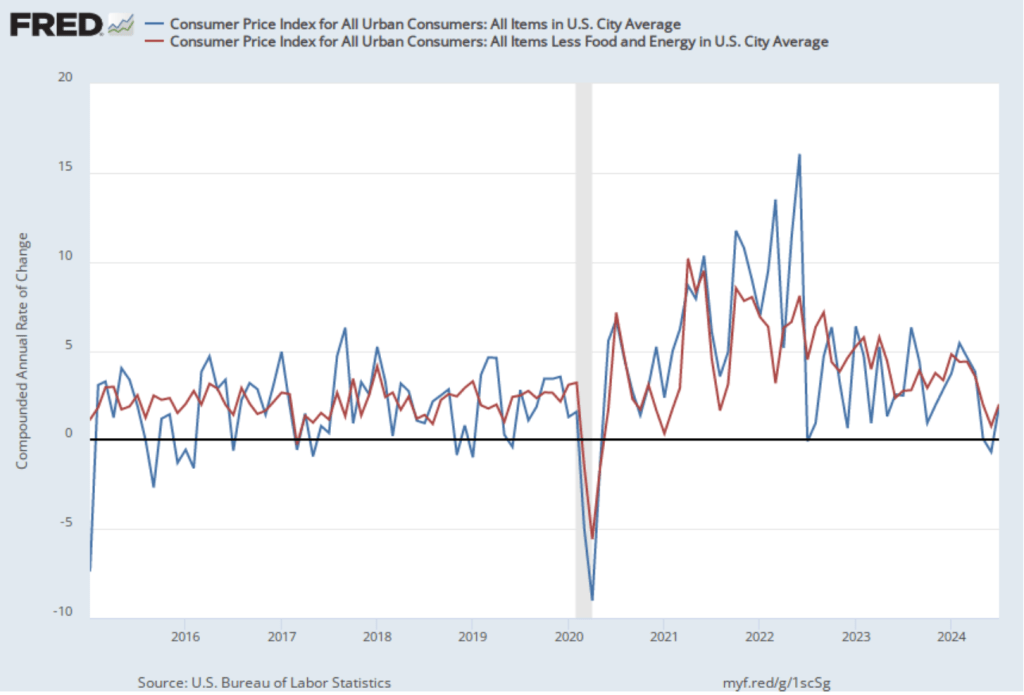
The figure shows how sentiment among investors has changed over the past month. On August 16, investors assigned a 75 percent probability of a 25 basis point cut in the target range and only a 25 percent probability of a 50 basis point cut. Yesterday and today, investor sentiment has swung sharply toward expecting a 50 basis point cut. Why the shift? As the Fed attempts to fulfill its dual mandate of maximum employment and price stability, it’s focus since the spring of 2022 had been on bringing inflation back down to its 2 perecent target. But as the unemployment rate has slowly risen, output growth has cooled, and more consumers are delinquent on their auto loan and credit card payments, some members of the committee now believe that the committee made a mistake in not cutting the target range by 25 basis points at its last meeting at the end of July. For these members, a 50 basis point cut tomorrow would bring the changes in the target range back on track.
How well did investors in the federal funds futures market forecast the FOMC’s decision? If you are reading this after 2 p.m. EDT on September 18, you’ll know the answer.