It’s not surprising that employment in health care has been increasing. The National Health Expenditure (NHE) Projections Model of the Centers for Medicare & Medicaid Services estimates that the long-run income elasticity of demand for private personal health care spending is 1.58. So, a 10 percent increase in U.S. disposable personal income will result in the long run in a 15.8 percent increase in private personal health care spending. In other words, we would expect personal health care spending to become an increasing fraction of total household spending. In addition, the median age of the U.S. population has increased from 32.9 years in 1990 to a projected 40.1 years in 2025. As people age, their demand for health care increases. Finally, holding income and age constant, demand for health care has also increased as a result of the increasing effectiveness of medical care in treating disease.
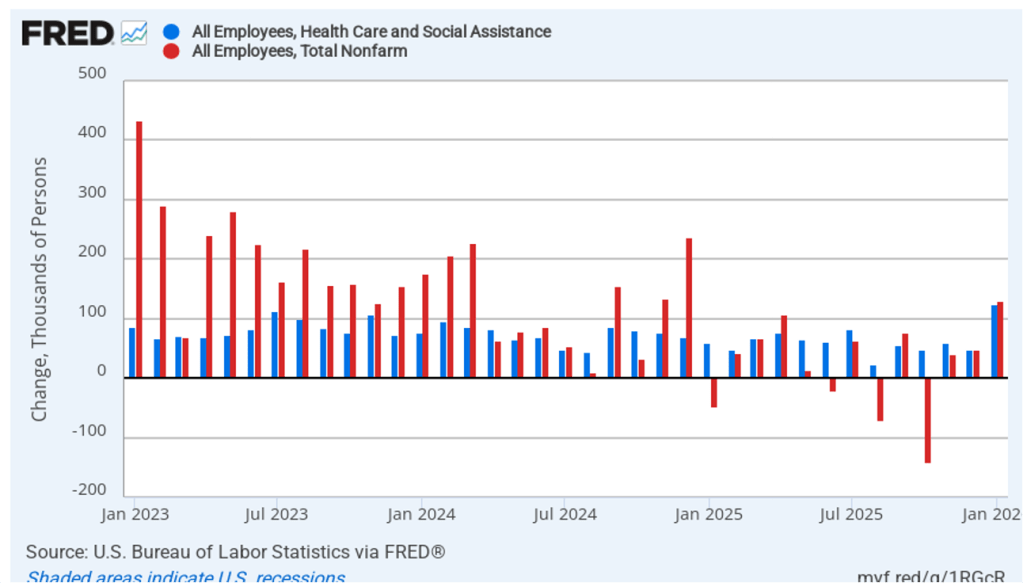
Despite these long-run trends, it’s surprising how dependent increases in U.S. employment have become recently on the growth in health care jobs. The following figure shows monthly changes in a broad measure of health care employment (the blue bars) and in total nonfarm employment (the red bars), using data from the establishment survey from the Bureau of Labor Statistics (BLS). (This blog post yesterday discussed the latest “Employment Situation” report from the BLS.)
The values for January 2023 through December 2024 show what we might expect—the increase in total employment being significantly larger than the increase in health care employment. During this period, health care employment was about 48.5 percent of total employment. In other words, although health care employment was a key driver of increases in employment, non-health care employment was also steadily increasing. The situation since January 2025 is much different with health care employment increasing by 817,000, while total employment increased by only 311,000. In other words, since January 2025, employment outside of health care (again, broadly defined) has fallen by more than 500,000 jobs.
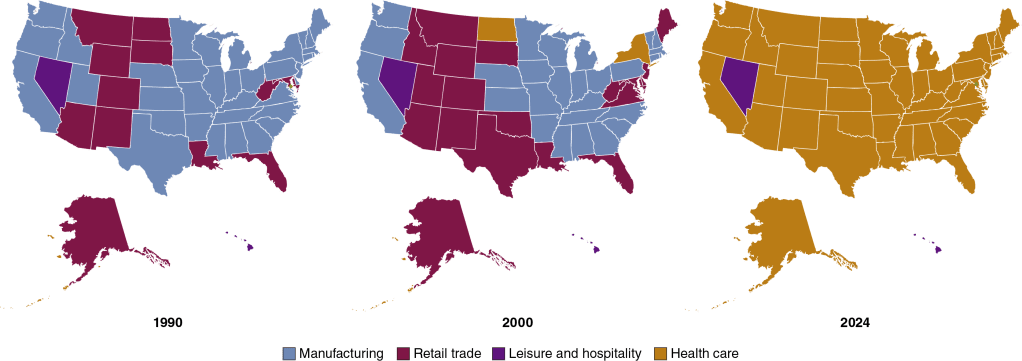
We can look at longer term trends in health care employment relative to employment in other industries. The following maps show the change over time in the industry with the most employment in each state, using data from the BLS’s “Quarterly Census of Employment and Wages.” The industries are grouped into four broad categories: manufacturing, retail trade, leisure and hospitality, and health care. (Industries are defined as follows using the North American Industry Classification System (NAICS): Manufacturing is NAICS 31–33, Retail trade is NAICS 44–45, Leisure and hospitality is NAICS 72, and health care is NAICS 62.)
In 1990, manufacturing was the largest source of private employment in most states, and in no state was health care the largest employer. By 2000, manufacturing was still the largest employer in 27 states, but health care had become the largest employer in 2 states. The results for 2024 are strikingly different: Manufacturing was no longer the largest employer in any state, and health care was the largest employer in 48 states—every state except for Hawaii and Nevada.
In 1990, almost twice as many people in the United States worked in manufacturing as worked in health care. In 2024, employment in health care was 80 percent greater than employment in manufacturing. And these trends are likely to continue. The BLS forecast in 2025 that 12 of the 20 fastest-growing occupations over the next 10 years will be in health care.
This morning (February 11), the Bureau of Labor Statistics (BLS) released its “Employment Situation” report (often called the “jobs report”) for January. The report was originally scheduled to be released last Friday but was postponed by the brief federal government shutdown. The data in the report show that the labor market was much stronger than expected in January.
The jobs report has two estimates of the change in employment during the month: one estimate from the establishment survey, often referred to as the payroll survey, and one from the household survey. As we discuss in Macroeconomics, Chapter 9, Section 9.1 (Economics, Chapter 19, Section 19.1), many economists and Federal Reserve policymakers believe that employment data from the establishment survey provide a more accurate indicator of the state of the labor market than do the household survey’s employment data and unemployment data. (The groups included in the employment estimates from the two surveys are somewhat different, as we discuss in this post.)
According to the establishment survey, there was a net increase of 130,000 nonfarm jobs during January. This increase was well above the increase of 55,000 that economists surveyed by the Wall Street Journal had forecast. Economists surveyed by Bloomberg had a higher forecast of 65,000 net jobs. The BLS revised downward its previous estimates of employment in November and December by a combined 17,000 jobs. (The BLS notes that: “Monthly revisions result from additional reports received from businesses and government agencies since the last published estimates and from the recalculation of seasonal factors.”)
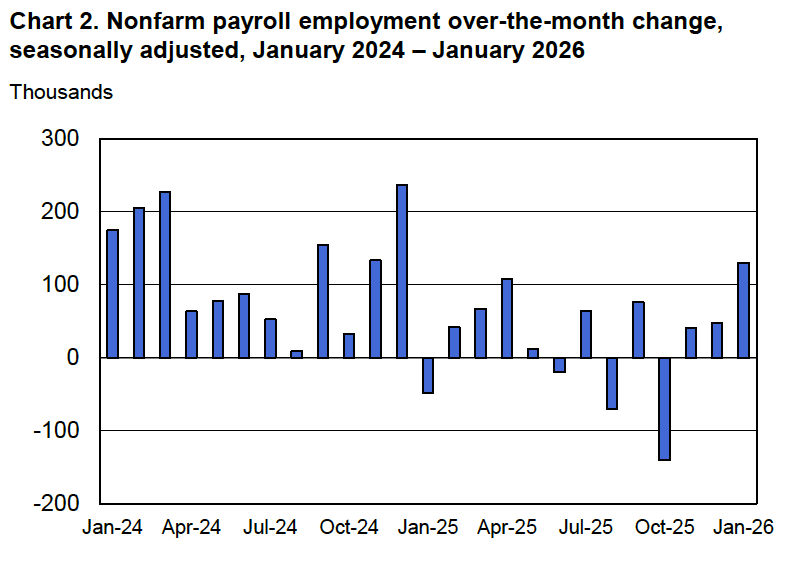
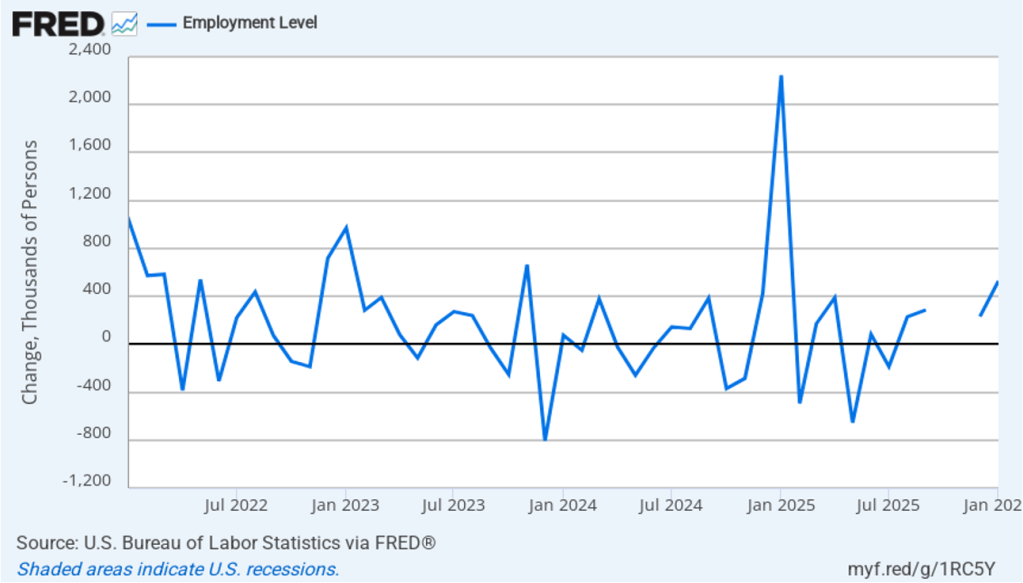
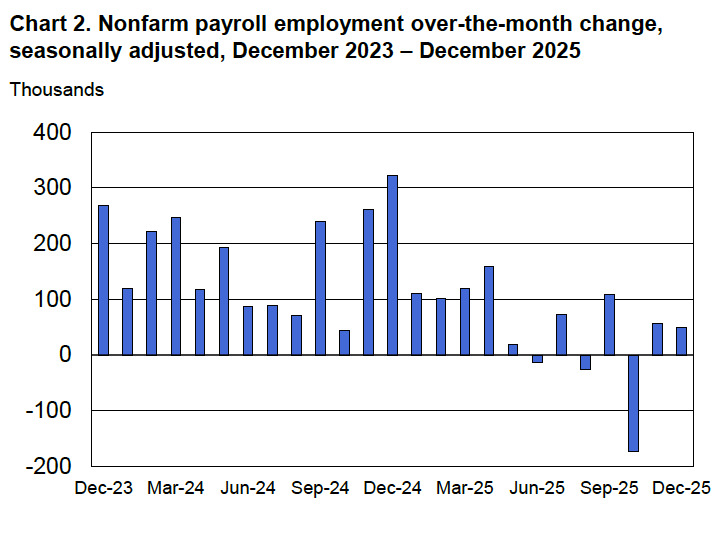
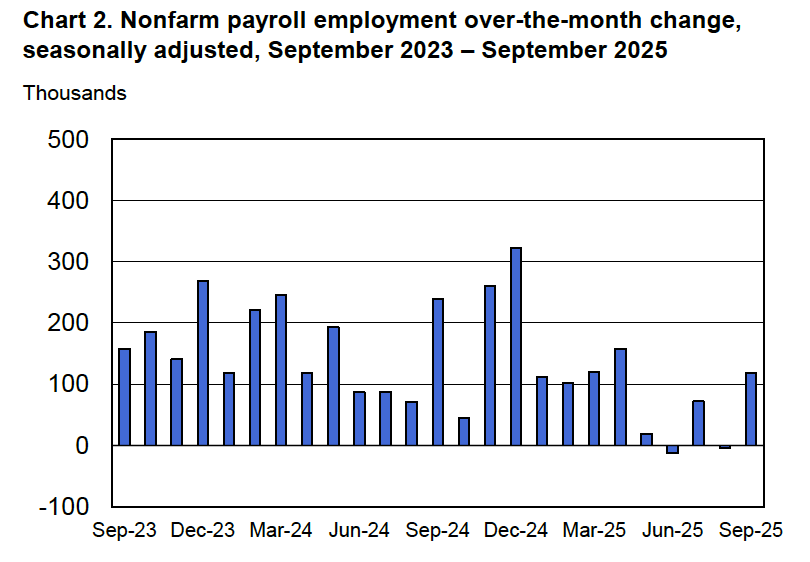
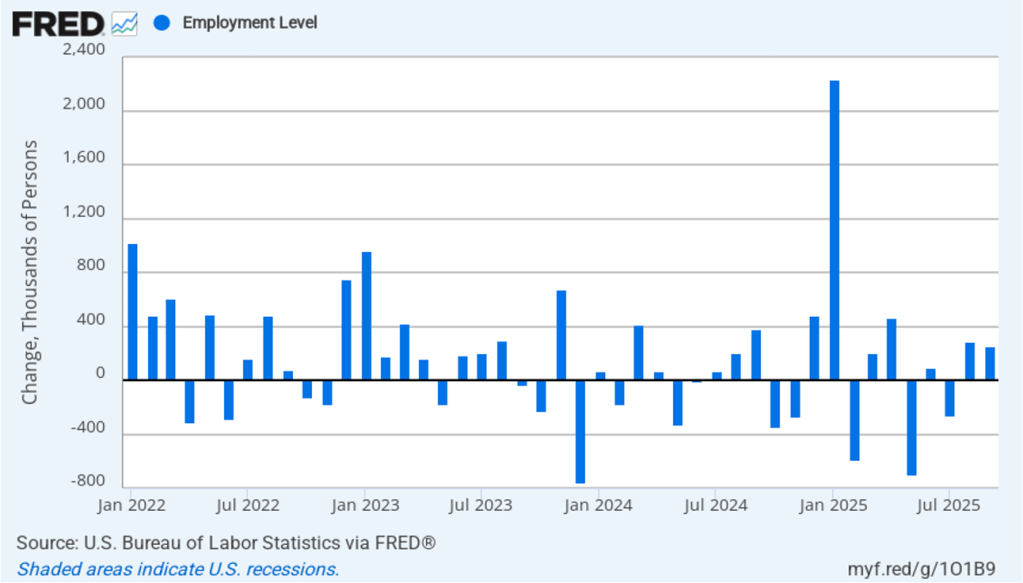
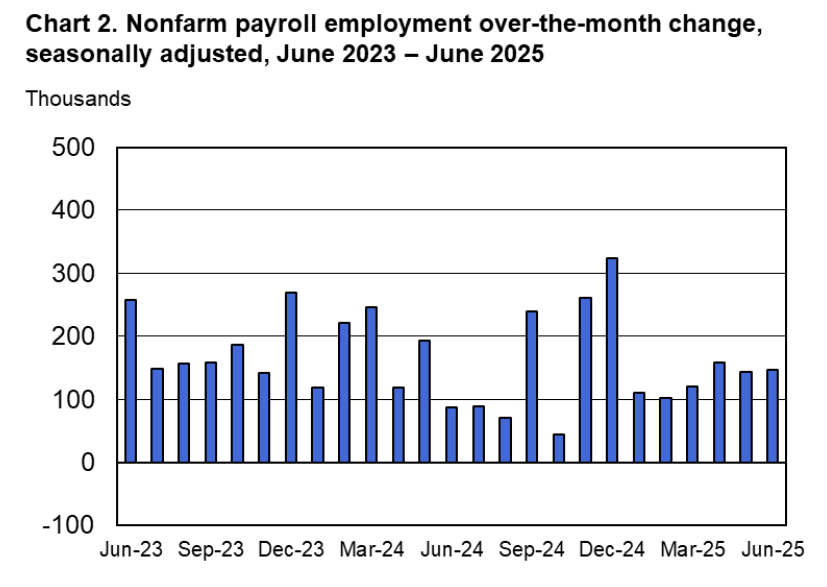
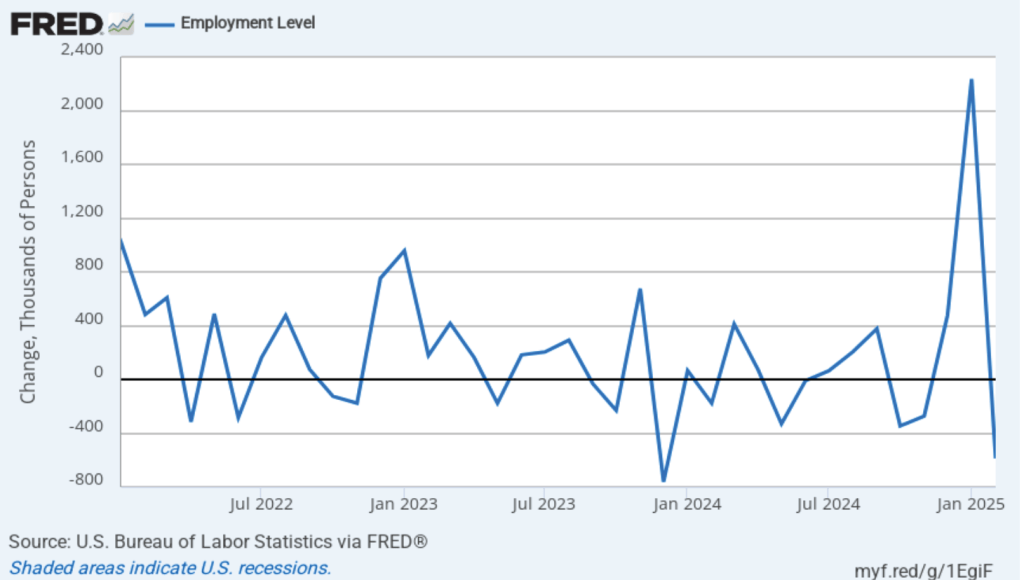
The following figure from the jobs report shows the net change in nonfarm payroll employment for each month in the last two years. The increase in net jobs in January was the largest since December 2024.
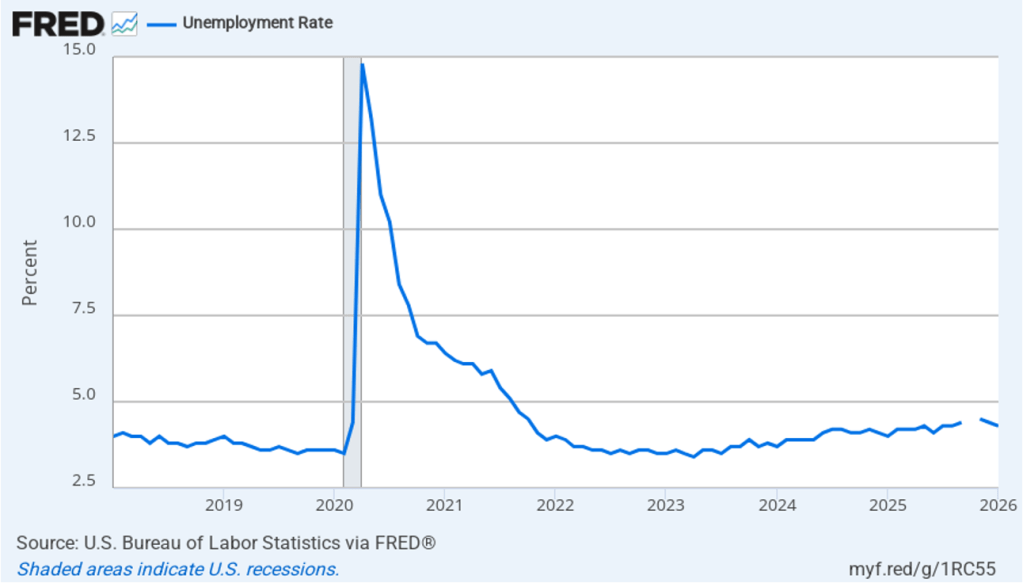
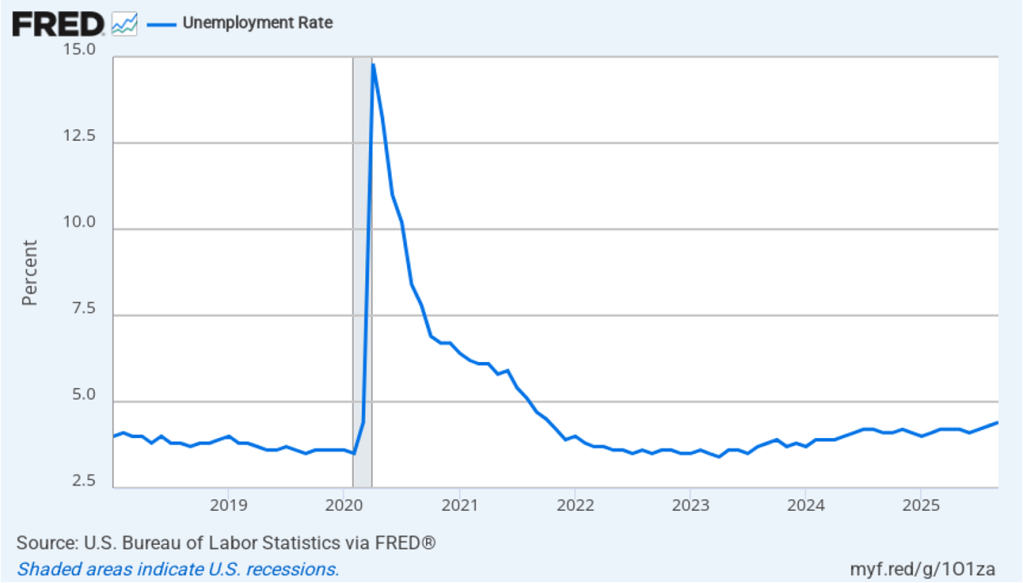
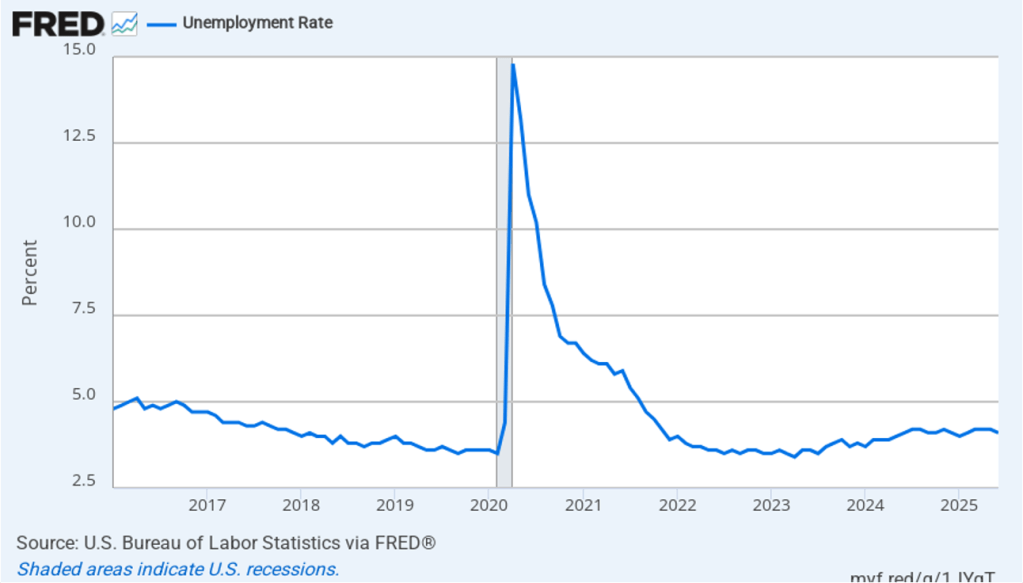
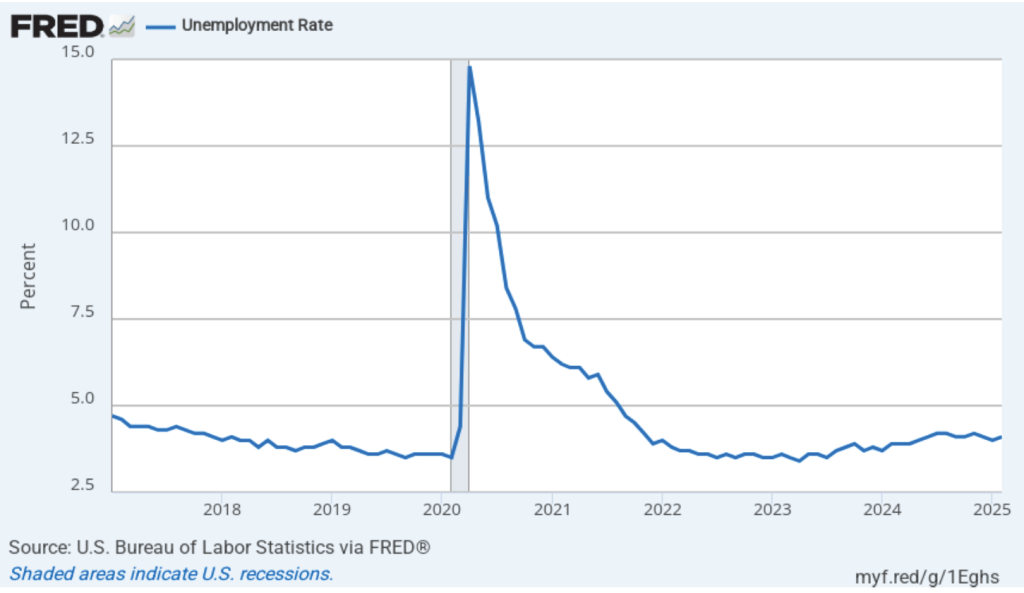
The unemployment rate, which is calculated from data in the household survey, fell from 4.4 percent in December to 4.3 percent in January. As the following figure shows, the unemployment rate has been remarkably stable over the past year and a half, staying between 4.0 percent and 4.4 percent in each month since May 2024. The Federal Open Market Committee’s current estimate of the natural rate of unemployment—the normal rate of unemployment over the long run—is 4.2 percent. So, unemployment is slightly above the natural rate. (We discuss the natural rate of unemployment in Macroeconomics, Chapter 9 and Economics, Chapter 19.)
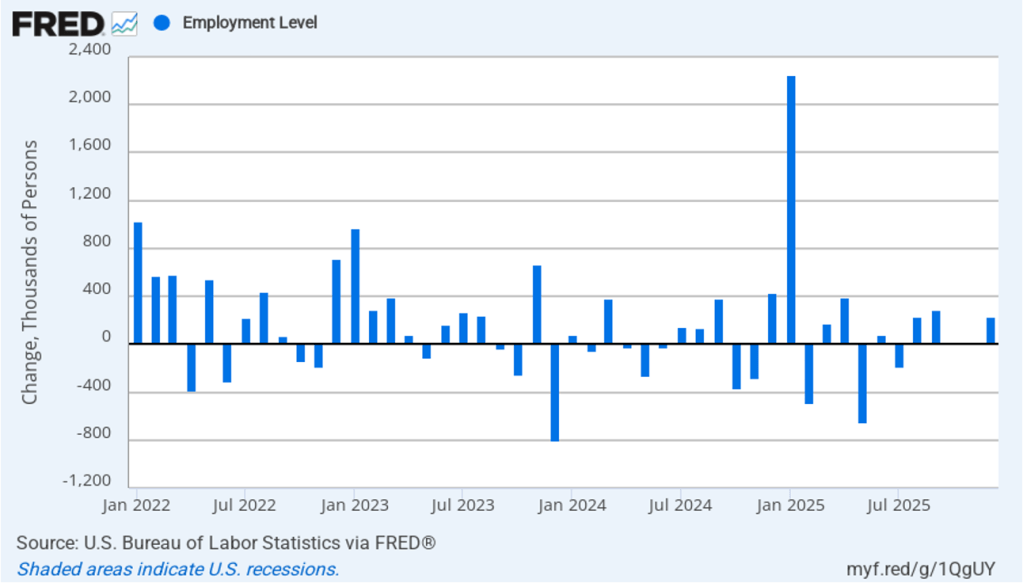
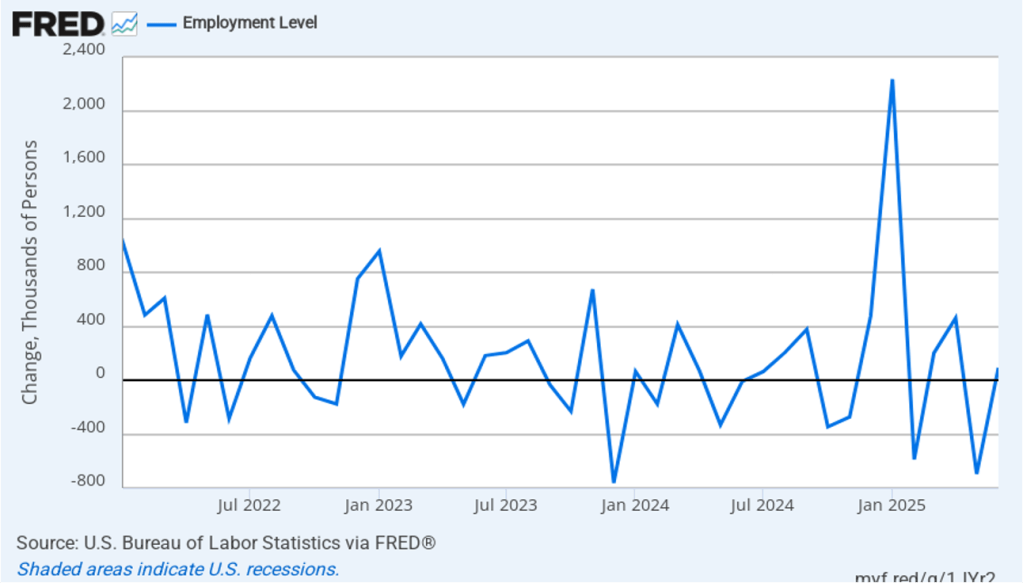
As the following figure shows, the monthly net change in jobs from the household survey moves much more erratically than does the net change in jobs from the establishment survey. As measured by the household survey, there was a net increase of 528,000 in January, far above the increase in jobs from the payroll survey. (Note that because of last year’s shutdown of the federal government, there are no data for October or November.) In any particular month, the story told by the two surveys can be inconsistent. In this case, both surveys indicate unexpectedly strong job growth, with the increase in household employment being particularly strong. (In this blog post, we discuss the differences between the employment estimates in the two surveys.)
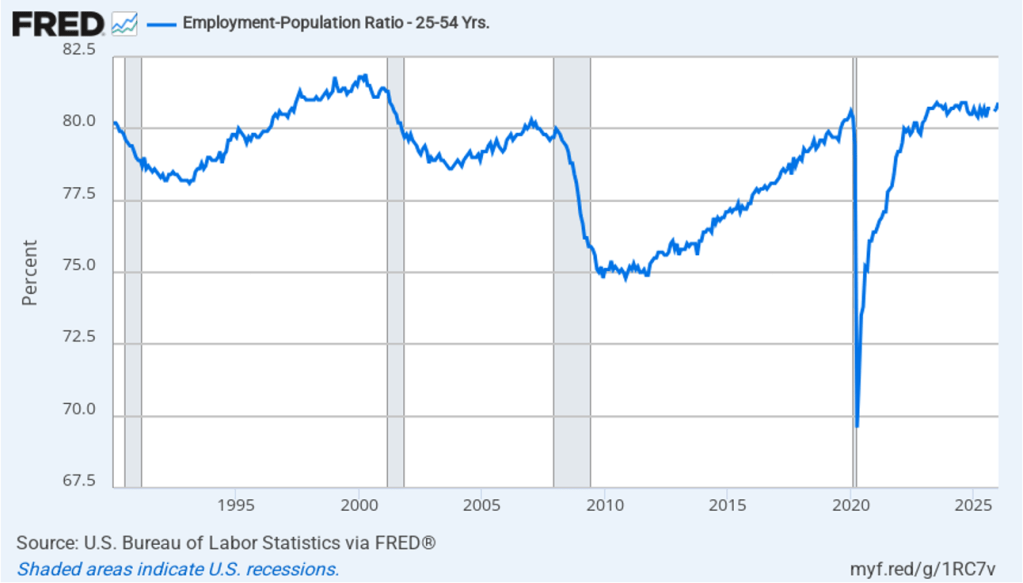
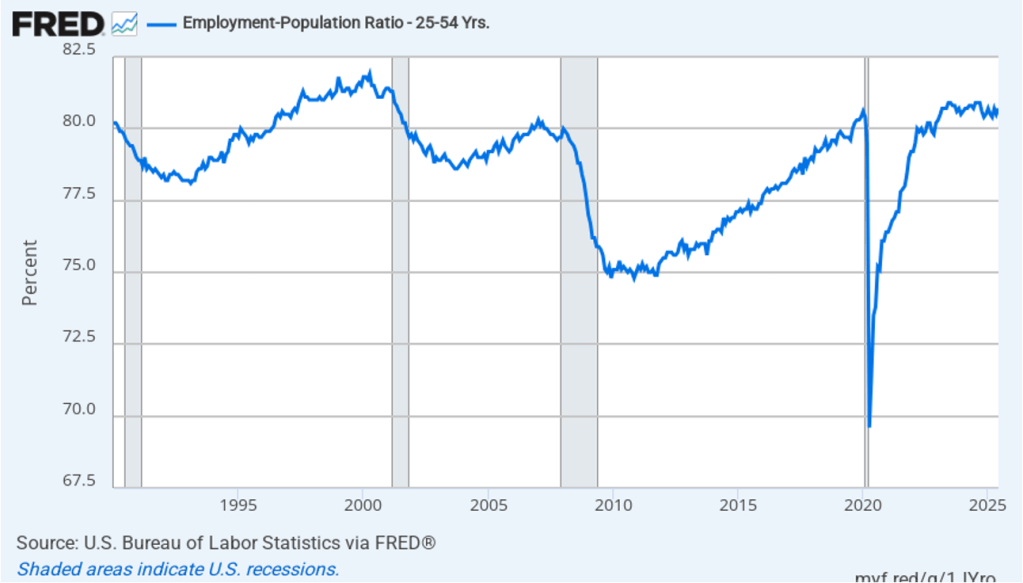
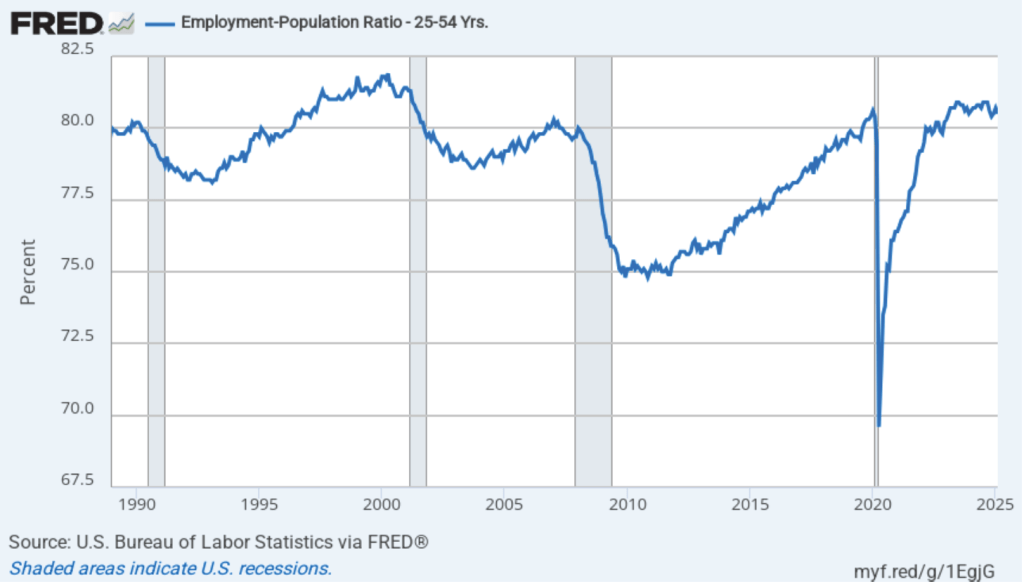
The household survey has another important labor market indicator: the employment-population ratio forprime age workers—those workers aged 25 to 54. In January the ratio was 80.9 percent, the highest since September 2024. In addition to matching the recent highs reached in mid-2024, the prime-age employment-population ratio is above what the ratio was in any month since April 2001. The continued high levels of the prime-age employment-population ratio indicates some continuing strength in the labor market.
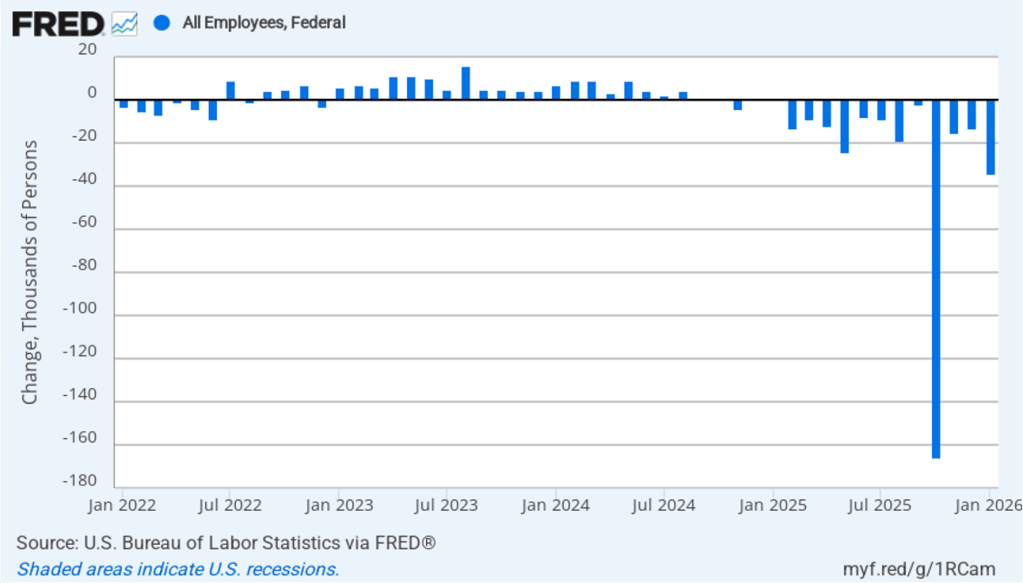
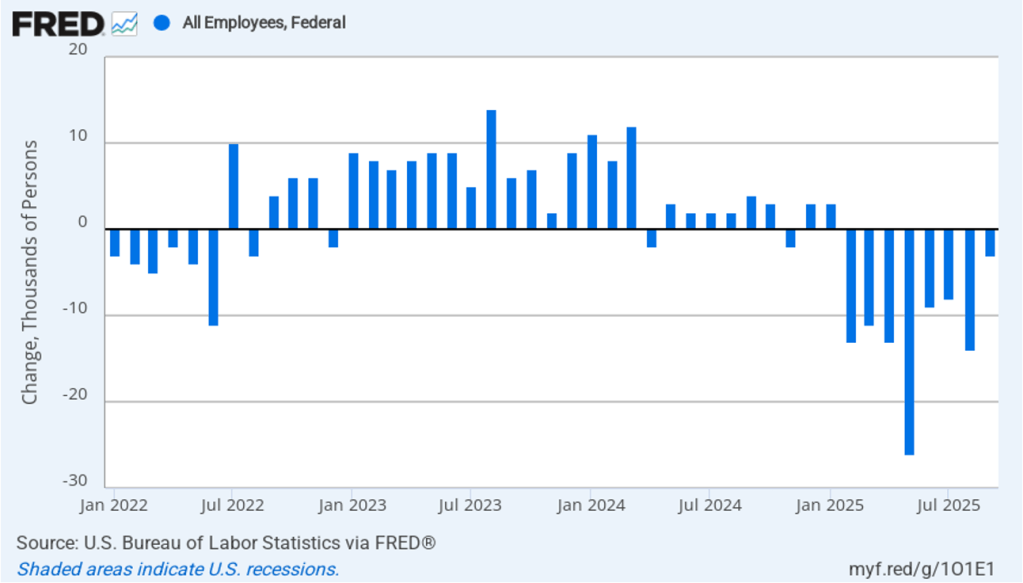
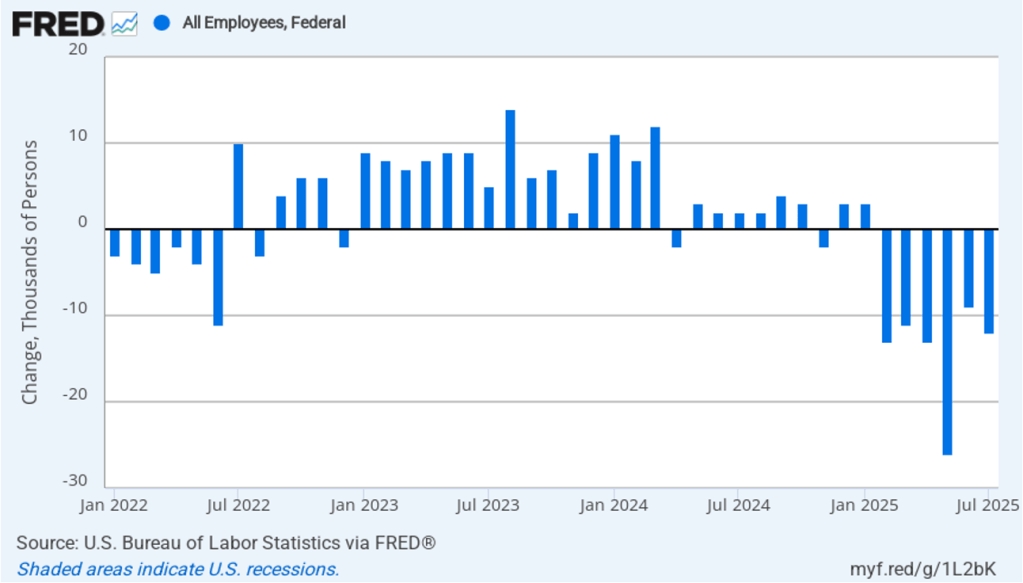
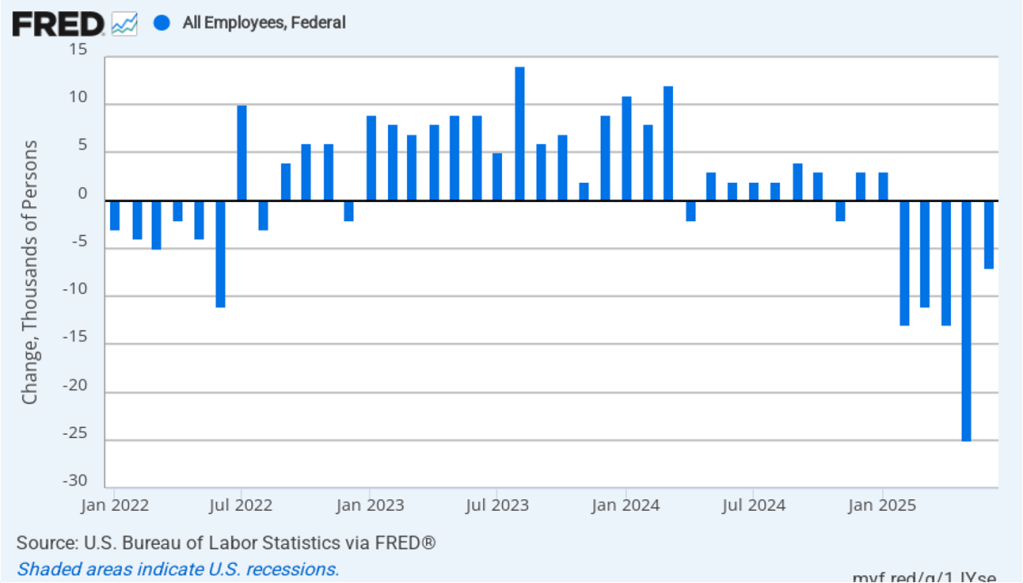
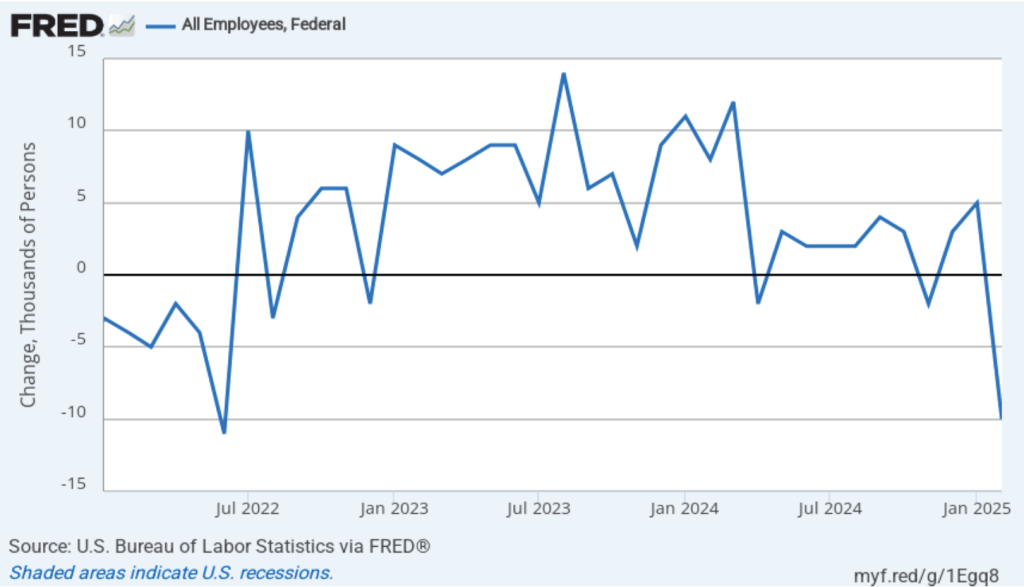
The Trump Administration’s layoffs of some federal government workers are clearly shown in the estimate of total federal employment for October, when many federal government employees exhausted their severance pay. (The BLS notes that: “Employees on paid leave or receiving ongoing severance pay are counted as employed in the establishment survey.”) As the following figure shows, there was a decline federal government employment of 166,000 in October, with additional declines in the following three months. The total decline in federal government employment since the beginning of February 2025 is 324,000.
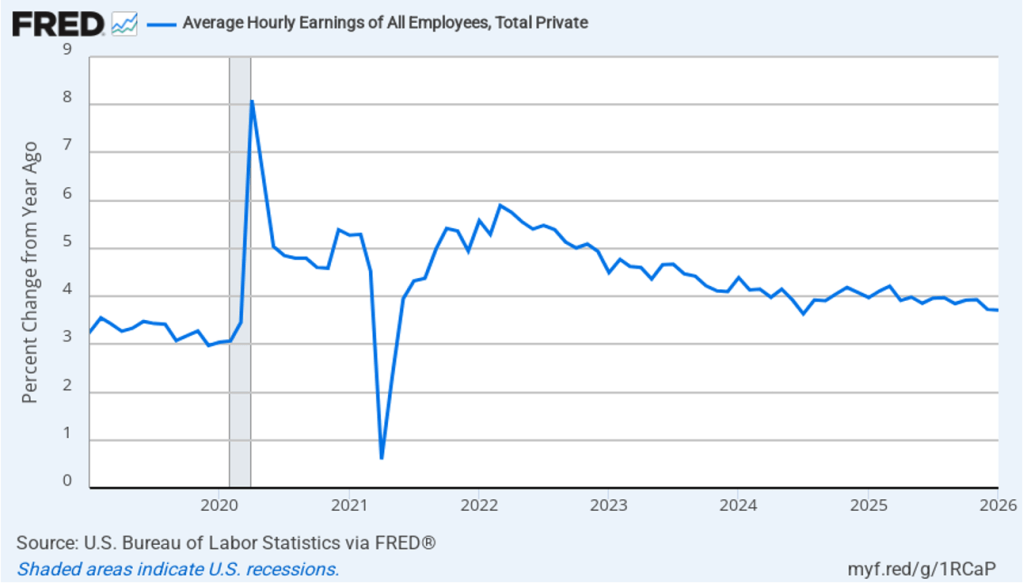
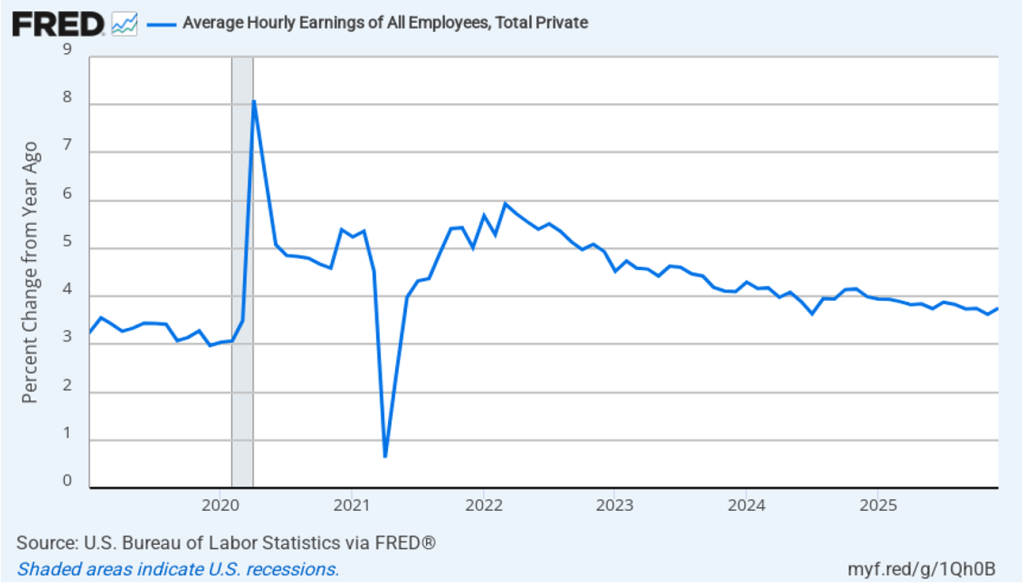
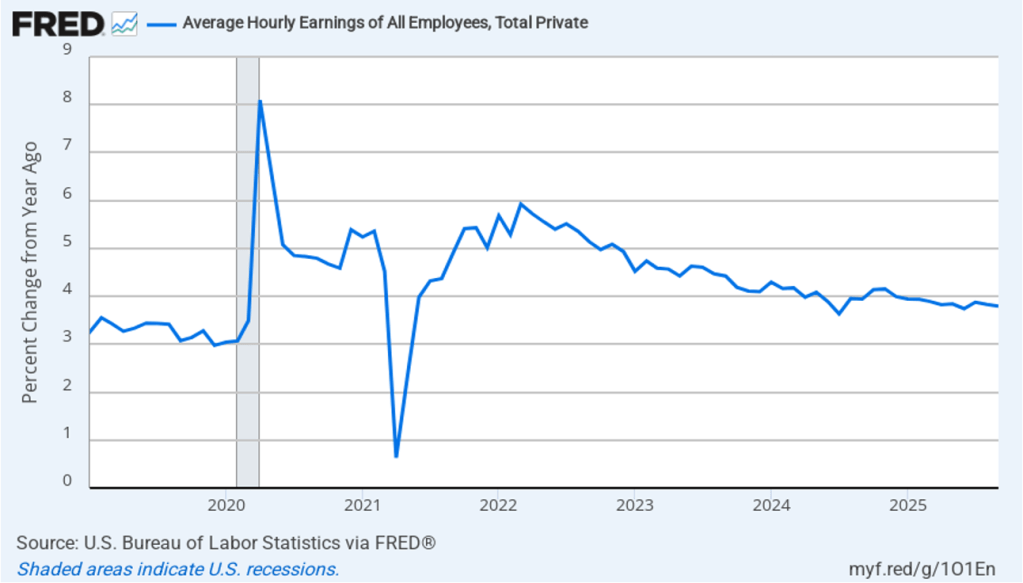
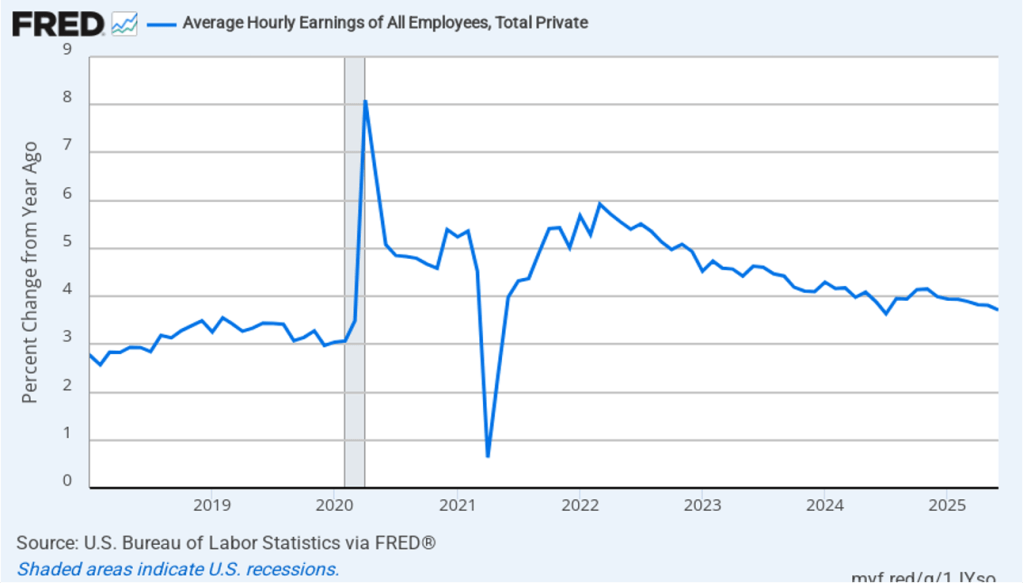
The establishment survey also includes data on average hourly earnings (AHE). As we noted in this post, many economists and policymakers believe the employment cost index (ECI) is a better measure of wage pressures in the economy than is the AHE. The AHE does have the important advantage of being available monthly, whereas the ECI is only available quarterly. The following figure shows the percentage change in the AHE from the same month in the previous year. The AHE increased 3.7 percent in January, the same as in December.
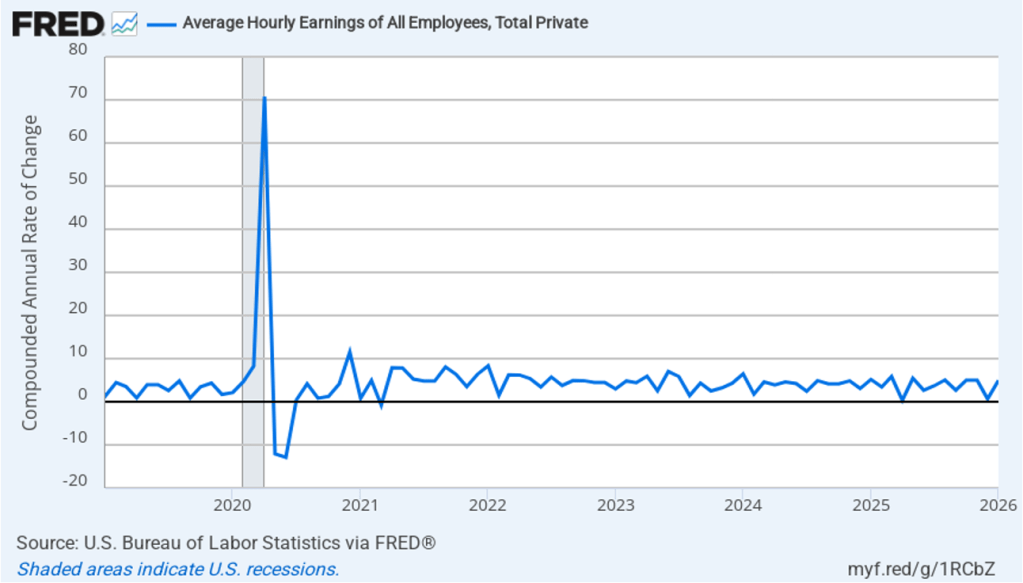
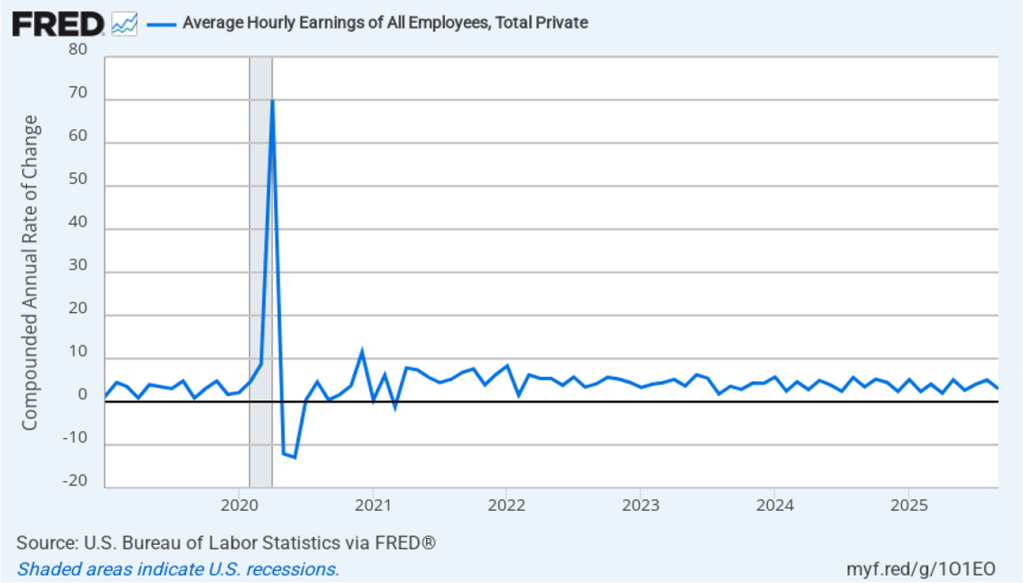
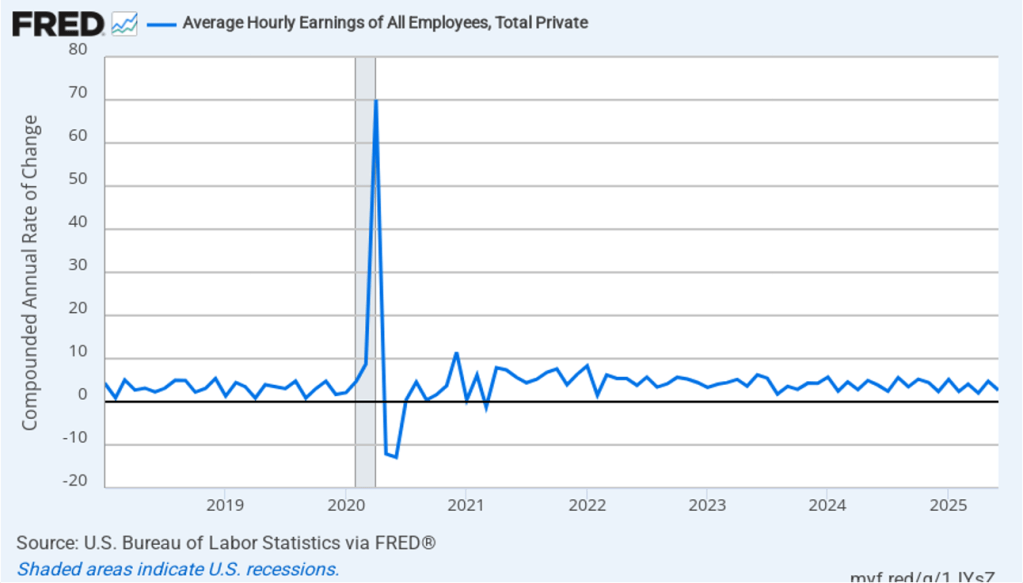
The following figure shows wage inflation calculated by compounding the current month’s rate over an entire year. (The figure above shows what is sometimes called 12-month wage inflation, whereas this figure shows 1-month wage inflation.) One-month wage inflation is much more volatile than 12-month wage inflation—note the very large swings in 1-month wage inflation in April and May 2020 during the business closures caused by the Covid pandemic. In January, the 1-month rate of wage inflation was 5.0 percent, up from 0.7 percent in December. This increase in wage growth may be an indication of a strengthening labor market. But one month’s data from such a volatile series may not accurately reflect longer-run trends in wage inflation.
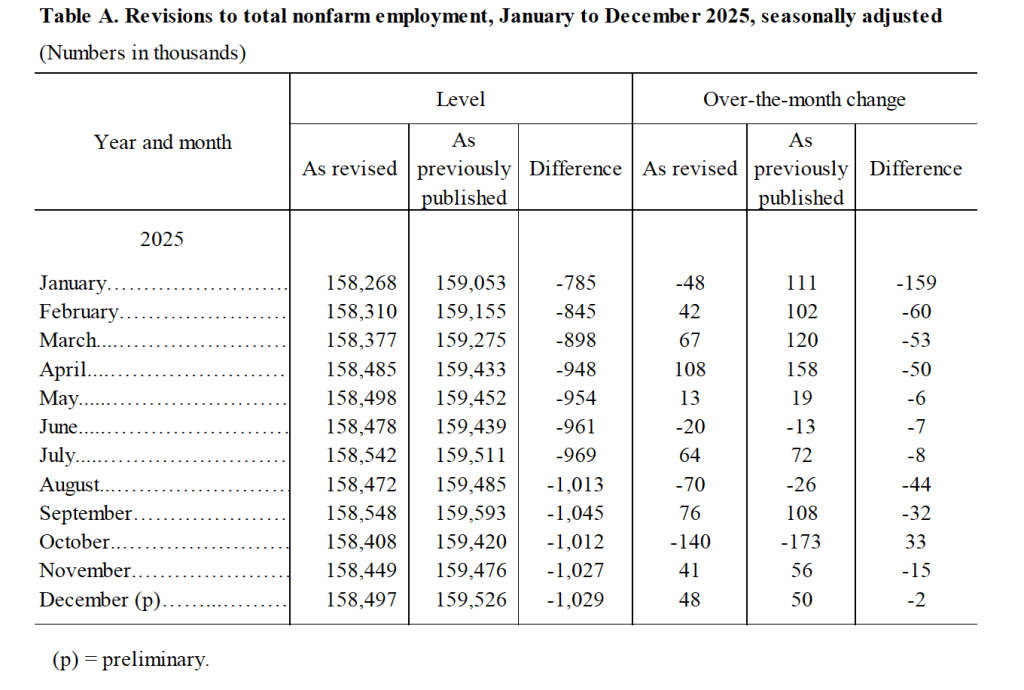
In today’s jobs report, the BLS also included its final annual benchmark revision to the establishment employment data. (We discussed the preliminary annual revision in this blog post last September.) The following table from the jobs report indicates that the revision was quite substantial. The revised estimate of payroll employment is 1,029,000 jobs lower than the original estimate. The increase in total nonfarm employment in 2025 was revised down to only 181,000 from the original estimate of 584,000. Leaving aside the collapse in employment in 2020 during the Covid pandemic, job growth in 2025 was the slowest since 2010 in the immediate aftermath of the Great Recession of 2007–2009.
Despite the large downward revision to job growth in 2025, the strong job growth for January in today’s jobs report makes it unlikely that the Federal Reserve’s policymaking Federal Open Market Committee (FOMC) will lower its target for the federal funds rate at its next meeting on March 17–18. The probability that investors in the federal funds futures market assign to the FOMC keeping its target rate unchanged at that meeting jumped from 79.9 percent yesterday to 92.1 percent after the release of today’s jobs report.
This morning (January 9), the Bureau of Labor Statistics (BLS) released its “Employment Situation” report (often called the “jobs report”) for December. Both the increase in employment and the unemployment rate were lower than had been expected.
The jobs report has two estimates of the change in employment during the month: one estimate from the establishment survey, often referred to as the payroll survey, and one from the household survey. As we discuss in Macroeconomics, Chapter 9, Section 9.1 (Economics, Chapter 19, Section 19.1), many economists and Federal Reserve policymakers believe that employment data from the establishment survey provide a more accurate indicator of the state of the labor market than do the household survey’s employment data and unemployment data. (The groups included in the employment estimates from the two surveys are somewhat different, as we discuss in this post.)
According to the establishment survey, there was a net increase of 50,000 nonfarm jobs during December. This increase was below the increase of 75,000 net new jobs that economists surveyed by FactSet had forecast. Economists surveyed by the Wall Street Journal had forecast an increase of 71,000 jobs. In addition, the BLS revised downward its previous estimates of employment in October and November by a combined 76,000 jobs. (The BLS notes that: “Monthly revisions result from additional reports received from businesses and government agencies since the last published estimates and from the recalculation of seasonal factors.”)
During 2025, the U.S. economy experienced an average monthly net increase of 49,000 jobs, down from an average monthly net increase of 168,000 jobs during 2024.
The following figure from the jobs report shows the net change in nonfarm payroll employment for each month in the last two years. The figure illustrates that monthly job growth has moved erratically since April. The Trump administration announced sharp increases in U.S. tariffs on April 2. Media reports indicate that some firms have slowed hiring due to the effects of the tariffs or in anticipation of those effects.
The unemployment rate decreased from 4.5 percent in November to 4.4 percent in December. The unemployment rate is below the 4.5 percent rate economists surveyed by FactSet had forecast. As the following figure shows, the unemployment rate had been remarkably stable over the past year, staying between 4.0 percent and 4.2 percent in each month May 2024 to July 2025 before breaking out of that range in August. Not that the gap in the figure for October reflects the fact that the federal government shutdown resulted in the BLS not conducting a household survey in that month.
Each month, the Federal Reserve Bank of Atlanta estimates how many net new jobs are required to keep the unemployment rate stable. Given a slowing in the growth of the working-age population due to the aging of the U.S. population and a sharp decline in immigration, the Atlanta Fed currently estimates that the economy would have to create 113,487 net new jobs each month to keep the unemployment rate stable at 4.4 percent. If this estimate is accurate, continuing monthly net job increases of only 50,000 would result in a rising unemployment rate.
As the following figure shows, the monthly net change in jobs from the household survey moves much more erratically than does the monthly net change in jobs from the establishment survey. As measured by the household survey, there was a net increase of 232,000 jobs in December. (There is no employment estimate from the household survey for October or November.) As an indication of the volatility in the employment changes in the household survey note the very large swings in net new jobs in January and February. In any particular month, the story told by the two surveys can be inconsistent, as was the case this month with employment increasing much more in the household survey than in the employment survey. (In this blog post, we discuss the differences between the employment estimates in the two surveys.)
The household survey has another important labor market indicator: the employment-population ratio forprime age workers—those aged 25 to 54. In December the ratio rose to 80.7 percent from 80.6 percent in November. The prime-age employment-population ratio is somewhat below the high of 80.9 percent in mid-2024, but is still above what the ratio was in any month during the period from January 2008 to February 2020. The increase in the prime-age employment-population ratio is a particular bright spot in this month’s jobs report.
The following figure shows monthly net changes in federal government employment as measured by the establishment survey. Following the very large net decrease of 179,000 federal government jobs in October, the data for the last two months were more typical of the changes in earlier years with a net increase of 3,000 federal jobs in November and 2,000 jobs in December. In these two months, changes to federal employment had only a small effect on the overall labor market.
The establishment survey also includes data on average hourly earnings (AHE). As we noted in this post, many economists and policymakers believe the employment cost index (ECI) is a better measure of wage pressures in the economy than is the AHE. The AHE does have the important advantage of being available monthly, whereas the ECI is only available quarterly. The following figure shows the percentage change in the AHE from the same month in the previous year. The AHE increased 3.8 percent in December, up from an increase of 3.6 percent in November.
The following figure shows wage inflation calculated by compounding the current month’s rate over an entire year. (The figure above shows what is sometimes called 12-month wage inflation, whereas this figure shows 1-month wage inflation.) One-month wage inflation is much more volatile than 12-month wage inflation—note the very large swings in 1-month wage inflation in April and May 2020 during the business closures caused by the Covid pandemic. In December, the 1-month rate of wage inflation was 4.0 percent, up from 3.0 percent in November. Both the 1-month and the 12-month data for average hourly earnings show that wage growth remains fairly strong.
What effect might today’s jobs report have on the decisions of the Federal Reserve’s policymaking Federal Open Market Committee (FOMC) with respect to setting its target for the federal funds rate? One indication of expectations of future changes in the FOMC’s target for the federal funds rate comes from investors who buy and sell federal funds futures contracts. (We discuss the futures market for federal funds in this blog post.) In recent weeks, investors have expected that the FOMC would leave its target for the federal funds rate unchanged at its next meeting on January 27–28. This afternoon, as the following figure shows, investors raised the probability they assign to the committee leaving its target for the federal funds rate unchanged to 95.0 percent from 88.9 percent yesterday. The relatively strong jobs report combined with measures of inflation remaining above the Fed’s 2 percent annual target, makes it likely that the committee will wait to receive additional data on employment, inflation, and GDP before adjusting its federal funds rate target.
If not for the shutdown of the federal government, the Bureau of Labor Statistics (BLS) would have already released its “Employment Situation” report (often called the “jobs report”) for September and October by now. The September jobs report was released today based largely on data collected before the shutdown.
The jobs report has two estimates of the change in employment during the month: one estimate from the establishment survey, often referred to as the payroll survey, and one from the household survey. As we discuss in Macroeconomics, Chapter 9, Section 9.1 (Economics, Chapter 19, Section 19.1), many economists and Federal Reserve policymakers believe that employment data from the establishment survey provide a more accurate indicator of the state of the labor market than do the household survey’s employment data and unemployment data. (The groups included in the employment estimates from the two surveys are somewhat different, as we discuss in this post.)
Because the household survey wasn’t conducted in October, the data in the October report that relies on the household survey won’t be included when the BLS releases establishment employment data for October on December 16. The data for September released today showed the labor market was stronger than expected in that month.
According to the establishment survey, there was a net increase of 119,00 nonfarm jobs during September. This increase was well above the increase of 50,000 that economists surveyed by FactSet had forecast. Economists surveyed by the Wall Street Journal had also forecast a net increase of 50,000 jobs. The relatively large increase in employment in September was partially offset by the BLS revising downward by a combined 33,000 jobs its previous estimates of employment in July and August. The estimate for August was revised from a net gain of 22,000 to a net loss of 4,000. (The BLS notes that: “Monthly revisions result from additional reports received from businesses and government agencies since the last published estimates and from the recalculation of seasonal factors.”)
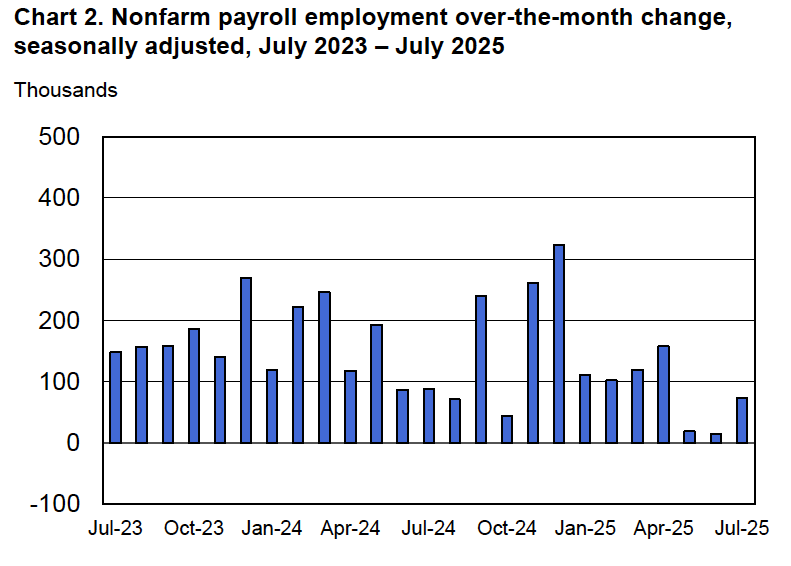
The following figure from the jobs report shows the net change in nonfarm payroll employment for each month in the last two years. The figure makes clear the striking deceleration in job growth beginning in May. The Trump administration announced sharp increases in U.S. tariffs on April 2. Media reports indicate that some firms have slowed hiring due to the effects of the tariffs or in anticipation of those effects.
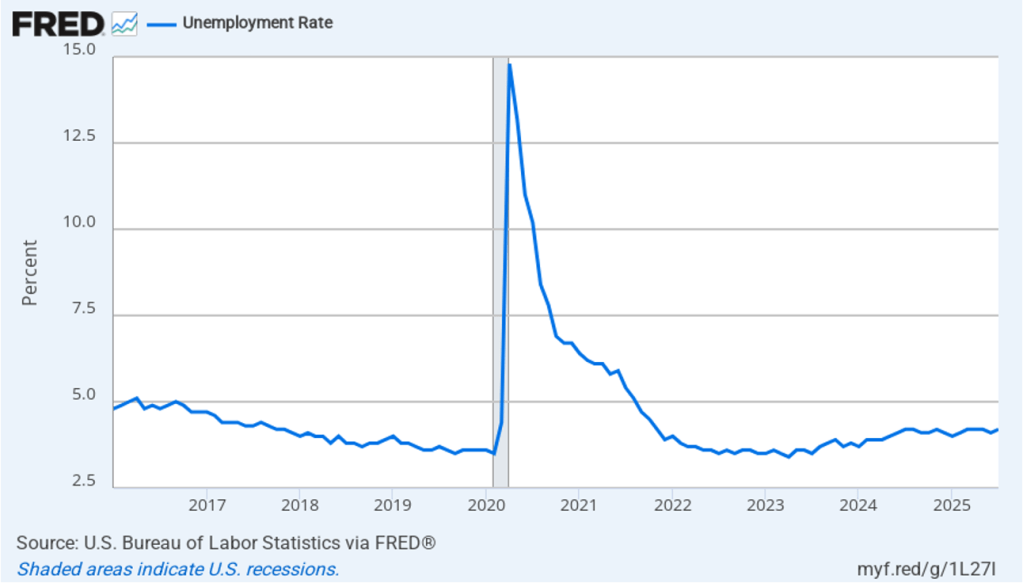
As shown in the following figure, the unemployment rate increased from 4.3 percent in August to 4.4 percent in September, the highest rate since October 2021. The unemployment rate is above the 4.3 percent rate economists surveyed by FactSet had forecast. The unemployment rate had been remarkably stable, staying between 4.0 percent and 4.2 percent in each month from May 2024 to July 2025, before breaking out of that range in August. In September, the members of the Federal Open Market Committee (FOMC) forecast that the unemployment rate during the fourth quarter of 2025 would average 4.5 percent. The FOMC’s current estimate of the natural rate of unemployment—the normal rate of unemployment over the long run—is 4.2 percent. (We discuss the natural rate of unemployment in Macroeconomics, Chapter 9 and Economics, Chapter 19.)
Each month, the Federal Reserve Bank of Atlanta estimates how many net new jobs are required to keep the unemployment rate stable. Given slower growth in the working-age population due to the aging of the U.S. population and a sharp decline in immigration, the Atlanta Fed currently estimates that the economy would have to create 111,878 net new jobs each month to keep the unemployment rate stable at 4.4 percent. If this estimate is accurate, if the average monthly net job increase from May through September of 38,600 were to continue, the result would be a rising unemployment rate.
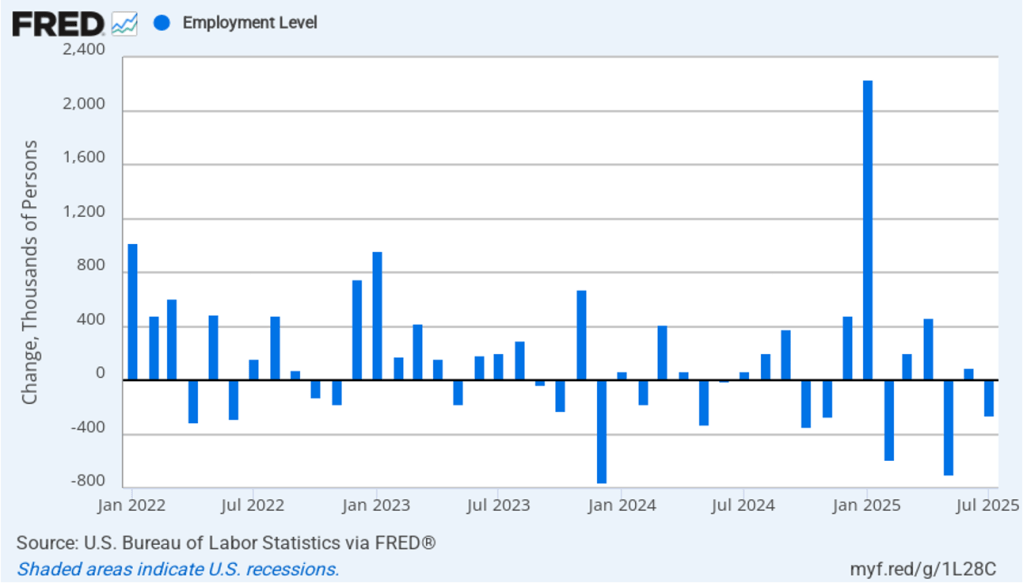
As the following figure shows, the monthly net change in jobs from the household survey moves much more erratically than does the net change in jobs from the establishment survey. As measured by the household survey, there was a net increase of 251,000 jobs in September, following a net increase of 288,000 jobs in August. As an indication of the volatility in the employment changes in the household survey note the very large swings in net new jobs in January and February. In any particular month, the story told by the two surveys can be inconsistent. as was the case in September with employment increasing much more in the household survey than in the employment survey. (In this blog post, we discuss the differences between the employment estimates in the two surveys.)
The household survey has another important labor market indicator: the employment-population ratio forprime age workers—those aged 25 to 54. In September the ratio was 80.7 percent, the same as in August. The prime-age employment-population ratio is somewhat below the high of 80.9 percent in mid-2024, but is still above what the ratio was in any month during the period from January 2008 to February 2020. The continued high levels of the prime-age employment-population ratio indicates strength in the labor market.
It is still unclear how many federal workers have been laid off since the Trump Administration took office. The establishment survey shows a decline in federal government employment of 3,000 in September and a total decline of 97,000 since the beginning of February 2025. However, the BLS notes that: “Employees on paid leave or receiving ongoing severance pay are counted as employed in the establishment survey.” It’s possible that as more federal employees end their period of receiving severance pay, future jobs reports may report a larger decline in federal employment. To this point, the decline in federal employment has had only a small effect on the overall labor market.
The establishment survey also includes data on average hourly earnings (AHE). As we noted in this post, many economists and policymakers believe the employment cost index (ECI) is a better measure of wage pressures in the economy than is the AHE. The AHE does have the important advantage of being available monthly, whereas the ECI is only available quarterly. The following figure shows the percentage change in the AHE from the same month in the previous year. The AHE increased 3.8 percent in September, the same as in August.
The following figure shows wage inflation calculated by compounding the current month’s rate over an entire year. (The figure above shows what is sometimes called 12-month wage inflation, whereas this figure shows 1-month wage inflation.) One-month wage inflation is much more volatile than 12-month wage inflation—note the very large swings in 1-month wage inflation in April and May 2020 during the business closures caused by the Covid pandemic. In September, the 1-month rate of wage inflation was 3.0 percent, down from 5.1 percent in August. This slowdown in wage growth may be an indication of a weakening labor market. But one month’s data from such a volatile series may not accurately reflect longer-run trends in wage inflation.
What effect might today’s jobs report have on the decisions of the Federal Reserve’s policymaking Federal Open Market Committee (FOMC) with respect to setting its target range for the federal funds rate? The minutes from the FOMC’s last meeting on October 28–29 indicate that committee members had “strongly differing views” over whether to cut the target range by 0.25 percentage point (25 basis points) at its next meeting on December 9–10 or to leave the target range unchanged.
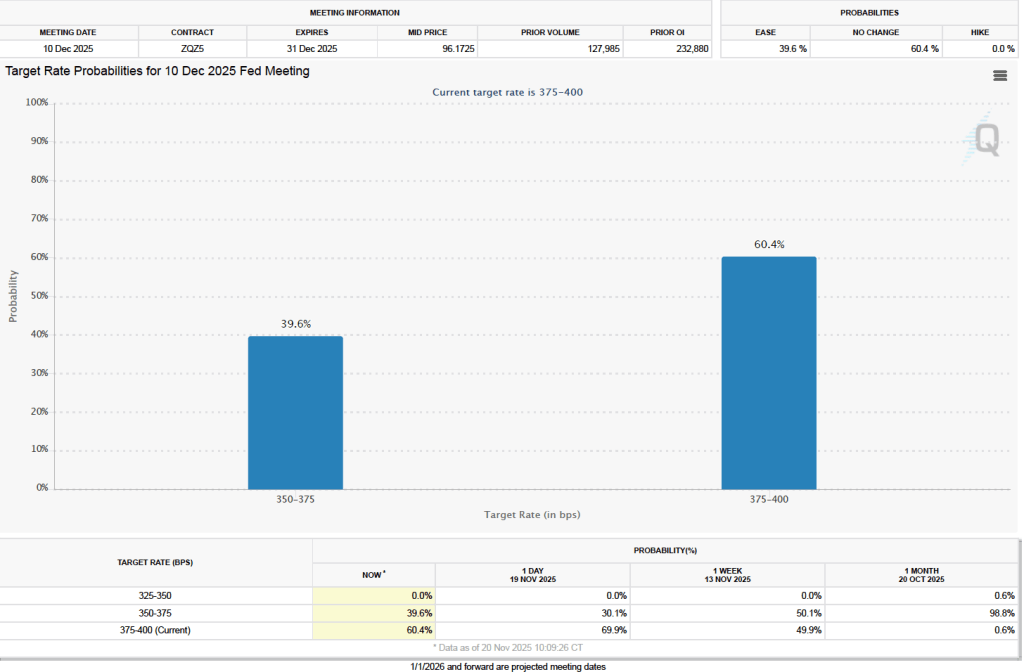
One indication of expectations of future changes in the FOMC’s target for the federal funds rate comes from investors who buy and sell federal funds futures contracts. (We discuss the futures market for federal funds in this blog post.) A month ago, investors assigned a 98.8 percent probability of the committee cutting its target range to 3.50 percent to 3.75 percent at its December meeting. Since that time indications have increased that output and employment growth have continued to be relatively strong and that inflation is stuck above the Fed’s 2 percent annual target. This morning, as the following figure shows, investors assign a probability of 60. 4 percent to the committee keeping its target unchanged at 3.75 percent to 4.00 percent at the December meeting. Committee members will also release their Summary of Economic Projections (SEP) at that meeting. The SEP, along with Fed Chair Powell’s remarks at his press conference following the meeting, should provide additional information on the monetary policy path the committee intends to follow in the coming months.
Fed Governor Christopher Wallace on October 21, 2025 at the Fed’s Payment Innovation Conference (photo from federalreserve.gov)
The current partial shutdown of the federal government has delayed the release by the Bureau of Labor Statistics (BLS) of its “Employment Situation” report (often called the “jobs report”). The report had originally been scheduled to be released on October 3. In a recent blog post we discussed how well the employment data collected by the private payroll processing firm Automatic Data Processing (ADP) serves as an alternative measure of the state of the labor market. In that post we showed that ADP data on total private payroll employment tracks fairly well the BLS data on total private employment from its establishment survey (often called the payroll survey) .
An article in today’s Wall Street Journal reports that ADP has stopped providing the Fed with early access to its data. Apparently, as a public service ADP had been providing its data to the Fed a week before the data was publicly released. The article notes that ADP stopped providing the data soon after this speech delievered by Fed Governor Christopher Wallace in late August. In a footnote to the speech Wallace refers to “data that Federal Reserve staff maintains in collaboration with the employment services firm ADP.” The article points out, though, that Waller’s speech was only one of several times since 2019 that a Fed official has publicly mentioned receiving data from ADP.
Losing early access to the ADP data comes at a difficult time for the Fed, given that the BLS employment data are not available. In addition, the labor market has shown signs of weakening even though growth has remained strong in measures of output. If payroll employment has been falling, rather than growing slowly as it was in the August jobs report, that knowledge would affect the deliberations of the Fed’s policymaking Federal Open Market Committee (FOMC) at its next meeting on October 28–29. Serious deterioration in the labor market could lead the FOMC to cut its target for the federal funds rate by more than the expected 0.25 percentage point (25 basis points).
In a speech in 2019, Fed Chair Jerome Powell noted that the Fed staff had used ADP data to develop a new measure of payroll employment. Had that measure been available in 2008, Powell argued, the FOMC would have realized earlier than it did that employment was being severely affected by the deepening of the financial crisis:
“[I]n the first eight months of 2008, as the Great Recession was getting underway, the official monthly employment data showed total job losses of about 750,000. A later benchmark revision told a much bleaker story, with declines of about 1.5 million. Our new measure, had it been available in 2008, would have been much closer to the revised data, alerting us that the job situation might be considerably worse than the official data suggested.”
The Wall Street Journal article notes that Powell has urged ADP to resume sharing its employment data with the Fed.
This morning (August 1), the Bureau of Labor Statistics (BLS) released its “Employment Situation” report (often called the “jobs report”) for July. The data in the report show that the labor market was weaker than expected in July. There have been many stories in the media about firms becoming cautious in hiring as a result of the Trump administration’s tariff increases. Some large firms—including Microsoft, Walt Disney, Walmart, and Proctor and Gamble—have announced layoffs. In addition, real GDP growth slowed during the first half of the year. Nevertheless, until today it appeared that employment growth remained strong.
The jobs report has two estimates of the change in employment during the month: one estimate from the establishment survey, often referred to as the payroll survey, and one from the household survey. As we discuss in Macroeconomics, Chapter 9, Section 9.1 (Economics, Chapter 19, Section 19.1), many economists and Federal Reserve policymakers believe that employment data from the establishment survey provide a more accurate indicator of the state of the labor market than do the household survey’s employment data and unemployment data. (The groups included in the employment estimates from the two surveys are somewhat different, as we discuss in this post.)
According to the establishment survey, there was a net increase of only 73,000 nonfarm jobs during July. This increase was below the increase of 1115,000 that economists surveyed by Factset had forecast. In addition, the BLS revised downward its previous estimates of employment in May and June by a combined 258,000 jobs. (The BLS notes that: “Monthly revisions result from additional reports received from businesses and government agencies since the last published estimates and from the recalculation of seasonal factors.”) The following figure from the jobs report shows the net change in nonfarm payroll employment for each month in the last two years. The figure shows the striking deceleration in job growth during the second quarter of this year.
The unemployment rate increased from 4.1 percent in June to 4.2 percent in July, which is the same rate as economists surveyed had forecast. As the following figure shows, the unemployment rate has been remarkably stable over the past year, staying between 4.0 percent and 4.2 percent in each month since May 2024. In June, the members of the Federal Open Market Committee (FOMC) forecast that the unemployment rate for 2025 would average 4.5 percent. The unemployment rate would have to rise significantly in the second half of the year for that forecast to be accurate.
Each month, the Federal Reserve Bank of Atlanta estimates how many net new jobs are required to keep the unemployment rate stable. Given a slowing in the growth of the working-age population due to the aging of the U.S. population and a sharp decline in immigration, the Atlanta Fed currently estimates that the economy would have to create 111,573 net new jobs each month to keep the unemployment rate stable at 4.2 percent. If this estimate is accurate, continuing monthly net job increases of 73,000 would result in a slowly rising unemployment rate.
As the following figure shows, the monthly net change in jobs from the household survey moves much more erratically than does the net change in jobs from the establishment survey. As measured by the household survey, there was a net decrease of 260,000 jobs in July, following an increase of 93,000 jobs in June. As an indication of the volatility in the employment changes in the household survey note the very large swings in net new jobs in January and February. In any particular month, the story told by the two surveys can be inconsistent with employment increasing in one survey while falling in the other, which was the case this month. (In this blog post, we discuss the differences between the employment estimates in the two surveys.)
The household survey has another important labor market indicator: the employment-population ratio forprime age workers—those aged 25 to 54. In July the ratio declined to 80.4 percent from 80.7 percent in June. The prime-age employment-population ratio is somewhat below the high of 80.9 percent in mid-2024, but is still above what the ratio was in any month during the period from January 2008 to November 2019. Further declines in the prime-age employment-population ratio would be a strong indication of a softening labor market.
It is still unclear how many federal workers have been laid off since the Trump Administration took office. The establishment survey shows a decline in federal government employment of 12,000 in June and a total decline of 84,000 since the beginning of February 2025. However, the BLS notes that: “Employees on paid leave or receiving ongoing severance pay are counted as employed in the establishment survey.” It’s possible that as more federal employees end their period of receiving severance pay, future jobs reports may report a larger decline in federal employment. To this point, the decline in federal employment has been too small to have a significant effect on the overall labor market.
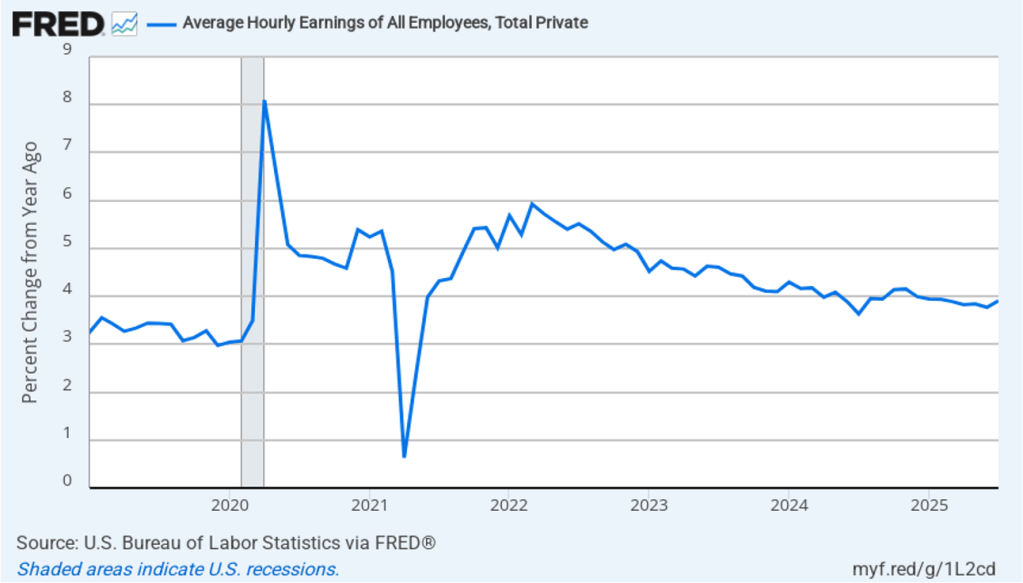
The establishment survey also includes data on average hourly earnings (AHE). As we noted in this post, many economists and policymakers believe the employment cost index (ECI) is a better measure of wage pressures in the economy than is the AHE. The AHE does have the important advantage of being available monthly, whereas the ECI is only available quarterly. The following figure shows the percentage change in the AHE from the same month in the previous year. The AHE increased 3.9 percent in July, up from an increase of 3.8 percent in June.
The following figure shows wage inflation calculated by compounding the current month’s rate over an entire year. (The figure above shows what is sometimes called 12-month wage inflation, whereas this figure shows 1-month wage inflation.) One-month wage inflation is much more volatile than 12-month wage inflation—note the very large swings in 1-month wage inflation in April and May 2020 during the business closures caused by the Covid pandemic. In July, the 1-month rate of wage inflation was 4.0 percent, up from 3.0 percent in June. If the July rate of wage inflation is sustained, it would complicate the Fed’s task of achieving its 2 percent target rate of price inflation. But one month’s data from such a volatile series may not accurately reflect longer-run trends in wage inflation.
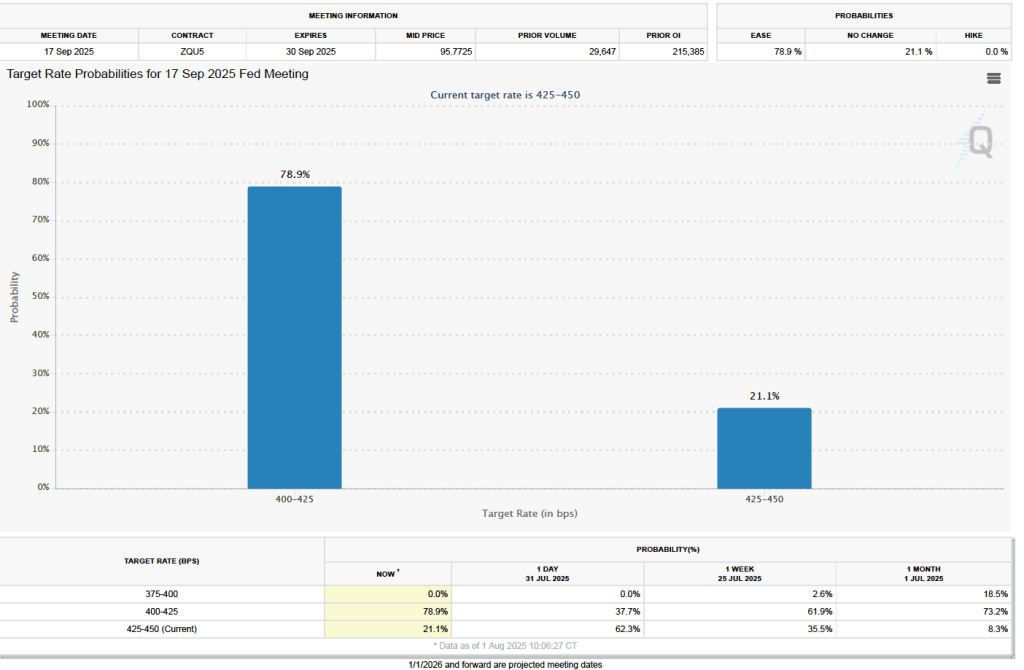
What effect might today’s jobs report have on the decisions of the Federal Reserve’s policymaking Federal Open Market Committee (FOMC) with respect to setting its target for the federal funds rate? One indication of expectations of future changes in the FOMC’s target for the federal funds rate comes from investors who buy and sell federal funds futures contracts. (We discuss the futures market for federal funds in this blog post.) Yesterday, as we noted in a blog post, investors assigned a 60.8 percent probability to the committee keeping its target unchanged at 4.25 percent to 4.50 percent at its September 16–17 meeting. As the following figure shows, there has been a sharp change in investors’ expectations. As of this morning, investors are assigning a 78.9 percent probability to the committee cutting its target by 0.25 percentage point (25 basis points) to a range of 4.00 percent to 4.25 percent.
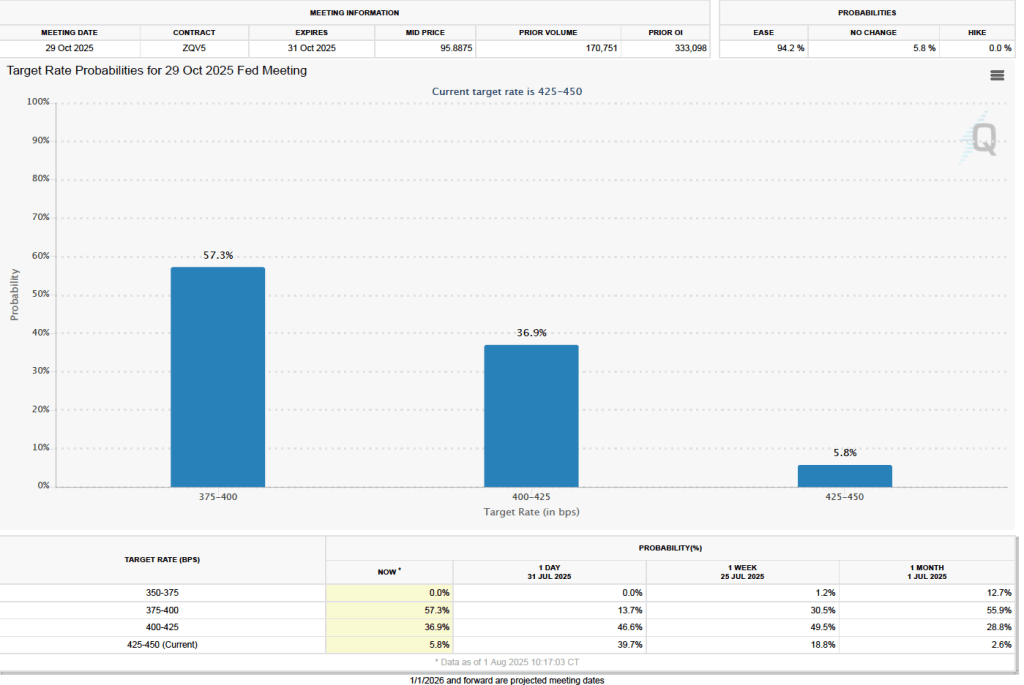
There is a similarly dramatic change in investors’ expectations of the target range for the federal funds rate following the FOMC’s October 28–29 meeting. As the following figure shows, investors now assign a probability of 57.3 percent to the committee lowering its target range to 3.75 percent to 4.00 percent at that meeting. Yesterday, investors assigned a probability of only 13.7 percent to that outcome.
This morning (July 3), the Bureau of Labor Statistics (BLS) released its “Employment Situation” report (often called the “jobs report”) for June. The data in the report show that the labor market was stronger than expected in June. There have been many stories in the media about businesspeople becoming pessimistic as a result of the large tariff increases the Trump Administration announced on April 2—some of which have since been reduced—and some large firms—including Microsoft and Walt Disney—have announced layoffs. In addition, yesterday payroll processing firm ADP estimated that private sector employment had declined by 33,000 in June. But despite these signs of weakness in the labor market, as the headline in the Wall Street Journal put it “Hiring Defied Expectations in June.”
The jobs report has two estimates of the change in employment during the month: one estimate from the establishment survey, often referred to as the payroll survey, and one from the household survey. As we discuss in Macroeconomics, Chapter 9, Section 9.1 (Economics, Chapter 19, Section 19.1), many economists and Federal Reserve policymakers believe that employment data from the establishment survey provide a more accurate indicator of the state of the labor market than do the household survey’s employment data and unemployment data. (The groups included in the employment estimates from the two surveys are somewhat different, as we discuss in this post.)
According to the establishment survey, there was a net increase of 147,000 nonfarm jobs during June. This increase was above the increase of 1115,000 that economists surveyed had forecast. In addition, the BLS revised upward its previous estimates of employment in April and May by a combined 16,000 jobs. (The BLS notes that: “Monthly revisions result from additional reports received from businesses and government agencies since the last published estimates and from the recalculation of seasonal factors.”) The following figure from the jobs report shows the net change in nonfarm payroll employment for each month in the last two years.
The unemployment rate declined from 4.2 in May to 4.1 percent in June. Economists surveyed had forecast an increase in the unemployment rate to 4.3 percent. As the following figure shows, the unemployment rate has been remarkably stable over the past year, staying between 4.0 percent and 4.2 percent in each month since May 2024. In June, the members of the Federal Open Market Committee (FOMC) forecast that the unemployment rate for 2025 would average 4.5 percent. The unemployment rate would have to rise significantly in the second half of the year for that forecast to be accurate.
Each month, the Federal Reserve Bank of Atlanta estimates how many net new jobs are required to keep the unemployment rate stable. Given a slowing in the growth of the working-age population due the aging of the U.S. population and a sharp decline in immigration, the Atlanta Fed currently estimates that the economy would have to create 113,500 net new jobs each month to keep the unemployment rate stable at 4.1 percent.
As the following figure shows, the monthly net change in jobs from the household survey moves much more erratically than does the net change in jobs from the establishment survey. As measured by the household survey, there was a net increase of 93,000 jobs in June, following a decrease of 696,000 jobs in May. As an indication of the volatility in the employment changes in the household survey note the very large swings in net new jobs in January and February. In any particular month, the story told by the two surveys can be inconsistent with employment increasing in one survey while falling in the other. This month, the two surveys were consistent in both showing a net increase in employment. (In this blog post, we discuss the differences between the employment estimates in the two surveys.)
The household survey has another important labor market indicator. The employment-population ratio forprime age workers—those aged 25 to 54—rose from 80.5 percent in May to 80.7 percent in June. The prime-age employment-population ratio is somewhat below the high of 80.9 percent in mid-2024, but is above what the ratio was in any month during the period from January 2008 to January 2020.
It is still unclear how many federal workers have been laid off since the Trump Administration took office. The establishment survey shows a decline in total federal government employment of 7,000 in June and a total decline of 69,000 since the beginning of February. However, the BLS notes that: “Employees on paid leave or receiving ongoing severance pay are counted as employed in the establishment survey.” It’s possible that as more federal employees end their period of receiving severance pay, future jobs reports may report a larger decline in federal employment. To this point, the decline in federal employment has been too small to have a significant effect on the overall labor market.
The establishment survey also includes data on average hourly earnings (AHE). As we noted in this post, many economists and policymakers believe the employment cost index (ECI) is a better measure of wage pressures in the economy than is the AHE. The AHE does have the important advantage of being available monthly, whereas the ECI is only available quarterly. The following figure shows the percentage change in the AHE from the same month in the previous year. The AHE increased 3.7 percent in June, down from an increase of 3.8 percent in May.
The following figure shows wage inflation calculated by compounding the current month’s rate over an entire year. (The figure above shows what is sometimes called 12-month wage inflation, whereas this figure shows 1-month wage inflation.) One-month wage inflation is much more volatile than 12-month wage inflation—note the very large swings in 1-month wage inflation in April and May 2020 during the business closures caused by the Covid pandemic. In June, the 1-month rate of wage inflation was 2.7 percent, down significantly from 4.8 percent in May. If the 1-month increase in AHE is sustained, it would indicate that the Fed may have an easier time achieving its 2 percent target rate of price inflation. But one month’s data from such a volatile series may not accurately reflect longer-run trends in wage inflation.
Before today’s jobs reports the signs that the labor market was weakening, which we discussed earlier, had led some economists and policymakers to speculate that a weak jobs report would lead the FOMC to cut its target range for the federal funds rate at its next meeting on July 29–30. That now seems very unlikely.
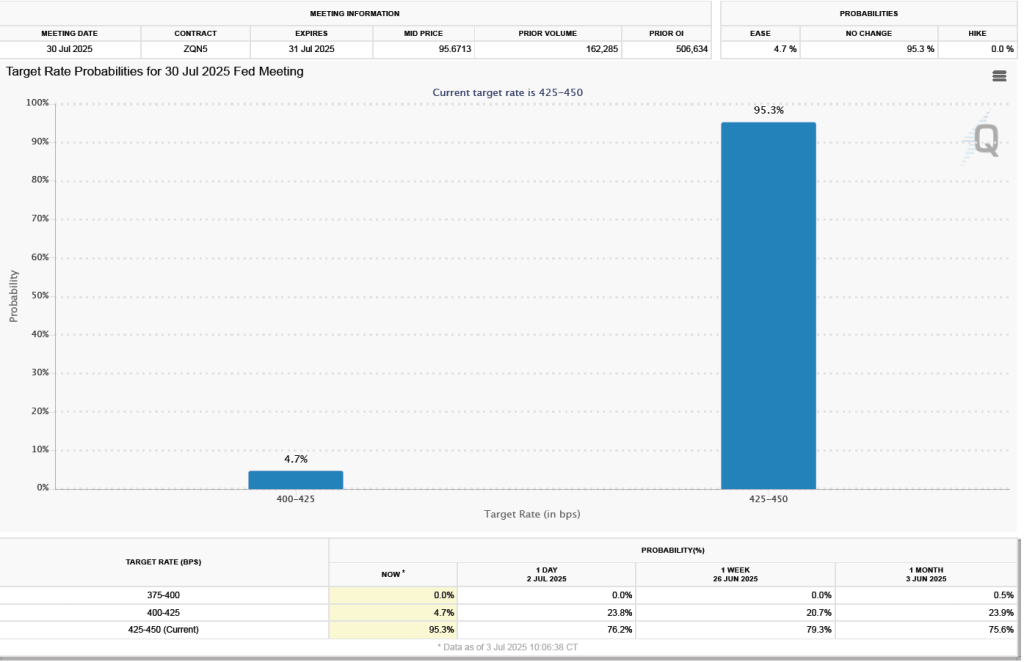
One indication of expectations of future changes in the FOMC’s target for the federal funds rate comes from investors who buy and sell federal funds futures contracts. (We discuss the futures market for federal funds in this blog post.) As shown in the following figure, today investors assign a 95.3 percent probability to the committee keeping its target unchanged at 4.25 percent to 4.50 percent at the July meeting.
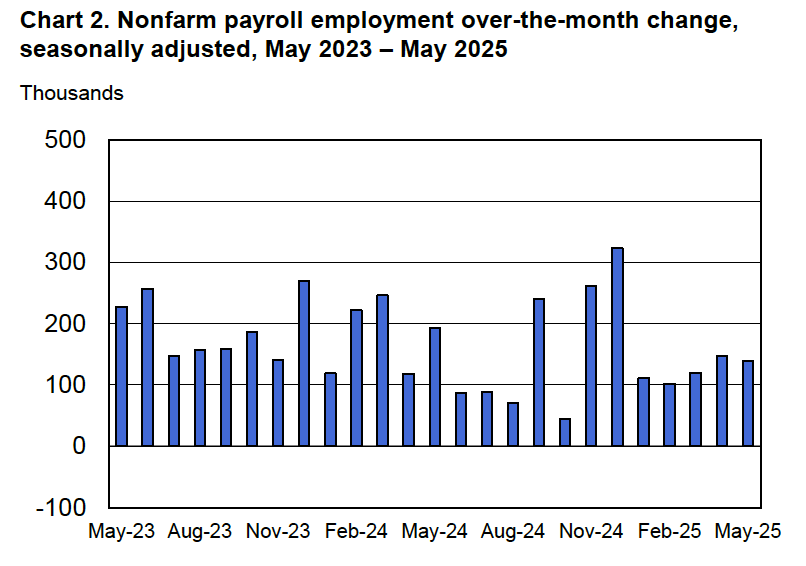
This morning (June 6), the Bureau of Labor Statistics (BLS) released its “Employment Situation” report (often called the “jobs report”) for May. The data in the report show that the labor market continues to be strong. There have been many stories in the media about businesspeople becoming pessimistic as a result of the large tariff increases the Trump Administration announced on April 2—some of which have since been reduced—but we don’t see the effects in the employment data. Some firms may be maintaining employment until they receive greater clarity about where tariff rates will end up. Similarly, although there are some indications that consumer spending may be slowing, to this point, the effects are not evident in the labor market.
The jobs report has two estimates of the change in employment during the month: one estimate from the establishment survey, often referred to as the payroll survey, and one from the household survey. As we discuss in Macroeconomics, Chapter 9, Section 9.1 (Economics, Chapter 19, Section 19.1), many economists and Federal Reserve policymakers believe that employment data from the establishment survey provide a more accurate indicator of the state of the labor market than do the household survey’s employment data and unemployment data. (The groups included in the employment estimates from the two surveys are somewhat different, as we discuss in this post.)
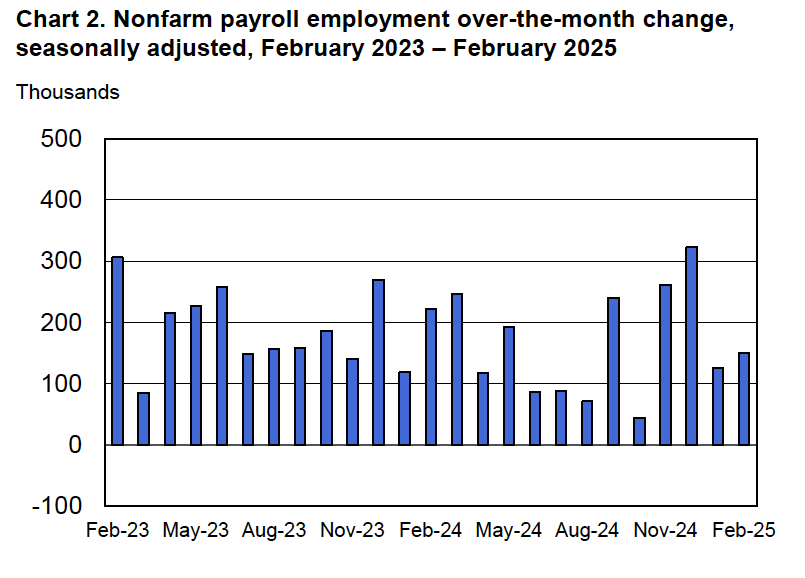
According to the establishment survey, there was a net increase of 139,000 nonfarm jobs during May. This increase was above the increase of 125,000 that economists surveyed had forecast. Somewhat offsetting this increase, the BLS revised downward its previous estimates of employment in March and April by a combined 95,000 jobs. (The BLS notes that: “Monthly revisions result from additional reports received from businesses and government agencies since the last published estimates and from the recalculation of seasonal factors.”) The following figure from the jobs report shows the net change in nonfarm payroll employment for each month in the last two years.
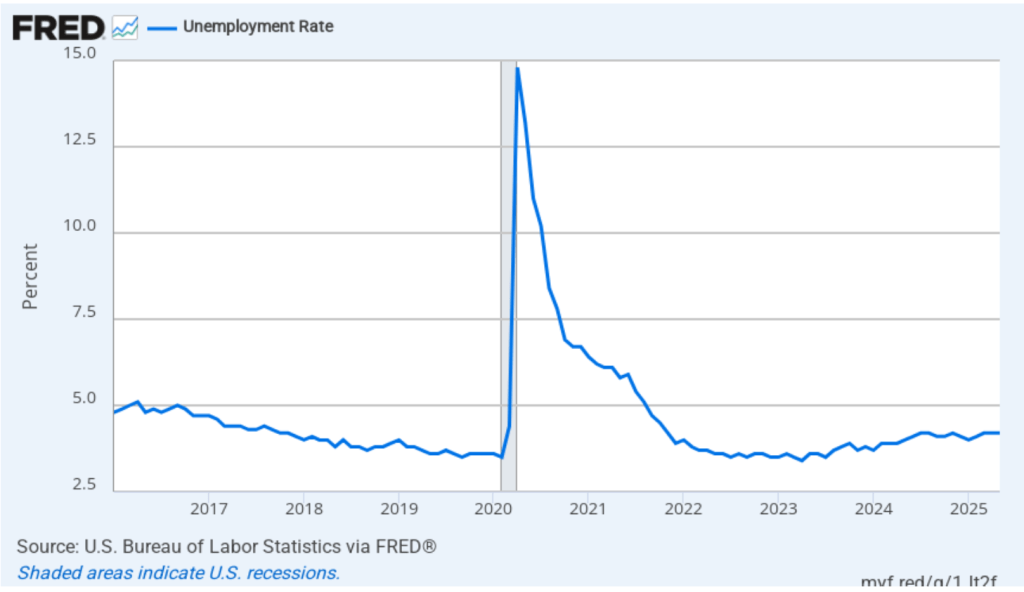
The unemployment rate was unchanged to 4.2 percent in May. As the following figure shows, the unemployment rate has been remarkably stable over the past year, staying between 4.0 percent and 4.2 percent in each month since May 2024. In March, the members of the Federal Open Market Committee (FOMC) forecast that the unemployment rate for 2025 would average 4.4 percent.
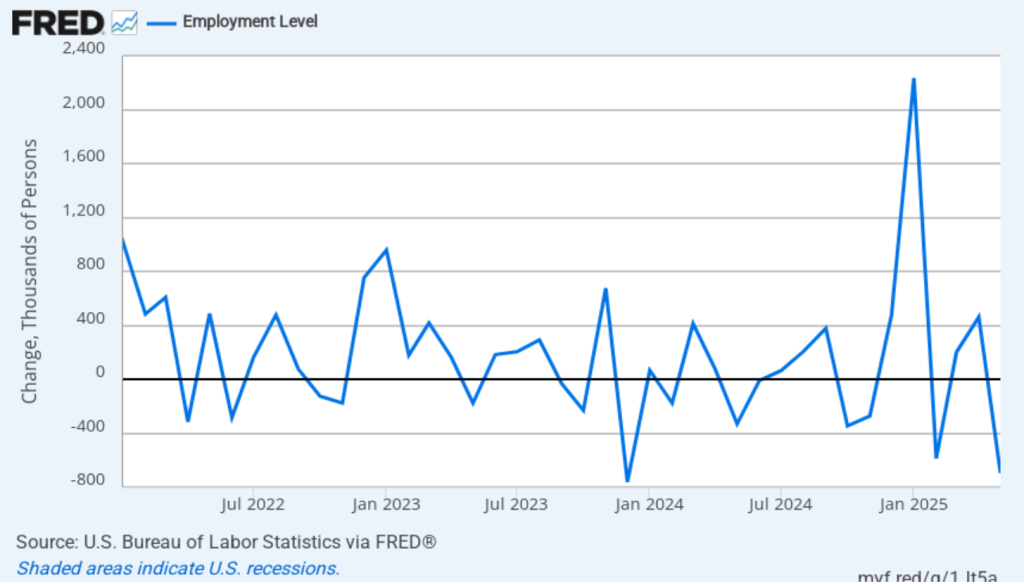
As the following figure shows, the monthly net change in jobs from the household survey moves much more erratically than does the net change in jobs from the establishment survey. As measured by the household survey, there was a net decrease of 696,000 jobs in May, following an increase of 461,000 jobs in April. As an indication of the volatility in the employment changes in the household survey note the very large swings in net new jobs in January and February. In any particular month, the story told by the two surveys can be inconsistent with employment increasing in one survey while falling in the other. This month, the discrepancy between the two surveys in their estimates of the change in net jobs was particularly large. (In this blog post, we discuss the differences between the employment estimates in the two surveys.)
The household survey has another important labor market indicator. The employment-population ratio for prime age workers—those aged 25 to 54—declined from 80.7 percent in April to 80.5 percent in May. The prime-age employment-population ratio is somewhat below the high of 80.9 percent in mid-2024, but is above what the ratio was in any month during the period from January 2008 to December 2019.
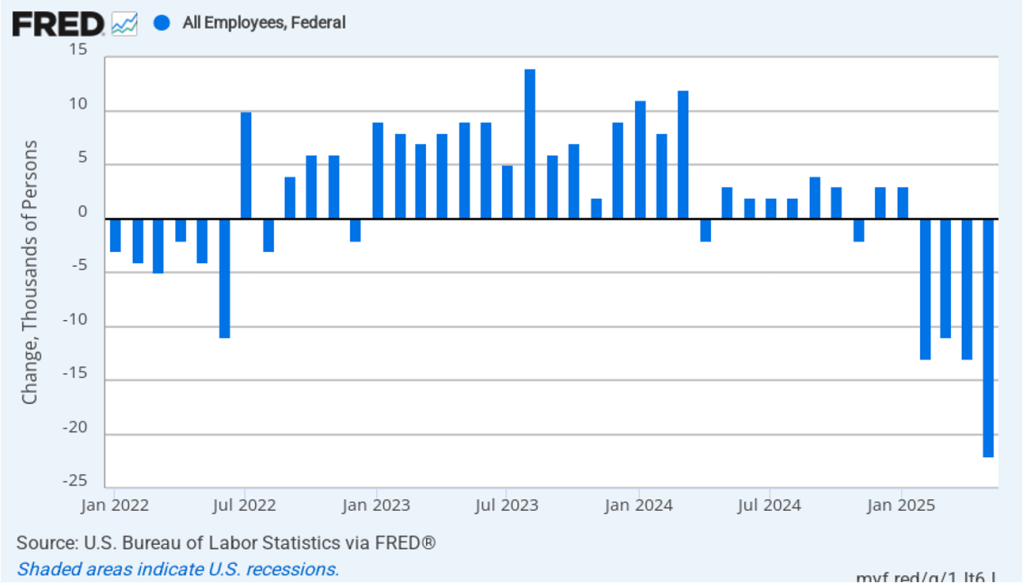
It remains unclear how many federal workers have been laid off since the Trump Administration took office. The establishment survey shows a decline in total federal government employment of 22,000 in May and a total decline of 59,000 beginning in February. However, the BLS notes that: “Employees on paid leave or receiving ongoing severance pay are counted as employed in the establishment survey.” It’s possible that as more federal employees end their period of receiving severance pay, future jobs reports may report a larger decline in federal employment. To this point, the decline in federal employment has been too small to have a significant effect on the overall labor market.
The establishment survey also includes data on average hourly earnings (AHE). As we noted in this post, many economists and policymakers believe the employment cost index (ECI) is a better measure of wage pressures in the economy than is the AHE. The AHE does have the important advantage of being available monthly, whereas the ECI is only available quarterly. The following figure shows the percentage change in the AHE from the same month in the previous year. The AHE increased 3.9 percent in May. Movements in AHE have been remarkably stable, showing increases of 3.9 percent each month since January.
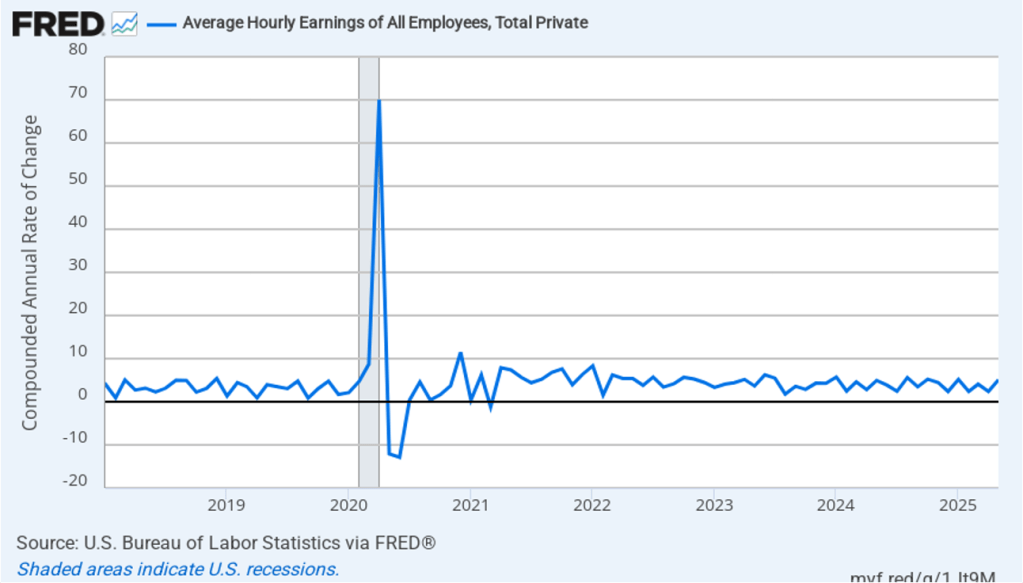
The following figure shows wage inflation calculated by compounding the current month’s rate over an entire year. (The figure above shows what is sometimes called 12-month wage inflation, whereas this figure shows 1-month wage inflation.) One-month wage inflation is much more volatile than 12-month wage inflation—note the very large swings in 1-month wage inflation in April and May 2020 during the business closures caused by the Covid pandemic. In May, the 1-month rate of wage inflation was 5.1 percent, up sharply from 2.4 percent in April. If the 1-month increase in AHE is sustained, it would indicate that the Fed will struggle to achieve its 2 percent target rate of price inflation. But one month’s data from such a volatile series may not accurately reflect longer-run trends in wage inflation.
Today’s jobs report leaves the situation facing the Federal Reserve’s policy-making Federal Open Market Committee (FOMC) largely unchanged. Looming over monetary policy, however, is the expected effect of the Trump Administration’s tariff increases. As we note in this blog post, a large unexpected increase in tariffs results in an aggregate supply shock to the economy. In terms of the basic aggregate demand and aggregate supply model that we discuss in Macroeconomics, Chapter 13 (Economics, Chapter 23), an unexpected increase in tariffs shifts the short-run aggregate supply curve (SRAS) to the left, increasing the price level and reducing the level of real GDP.
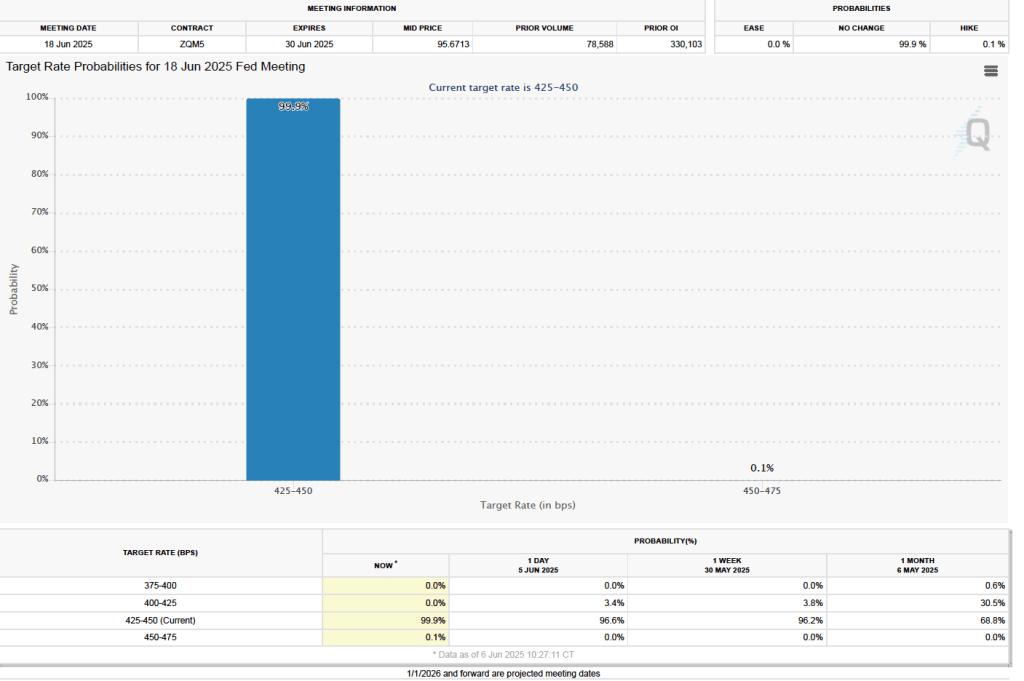
One indication of expectations of future changes in the FOMC’s target for the federal funds rate comes from investors who buy and sell federal funds futures contracts. (We discuss the futures market for federal funds in this blog post.) The data from the futures market indicate that, despite the potential effects of the tariff increases, investors don’t expect that the FOMC will cut its target for the federal funds rate at its June 17–18 meeting. As shown in the following figure, investors assign a 99.9 percent probability to the committee keeping its target unchanged at 4.25 percent to 4.50 percent at that meeting.
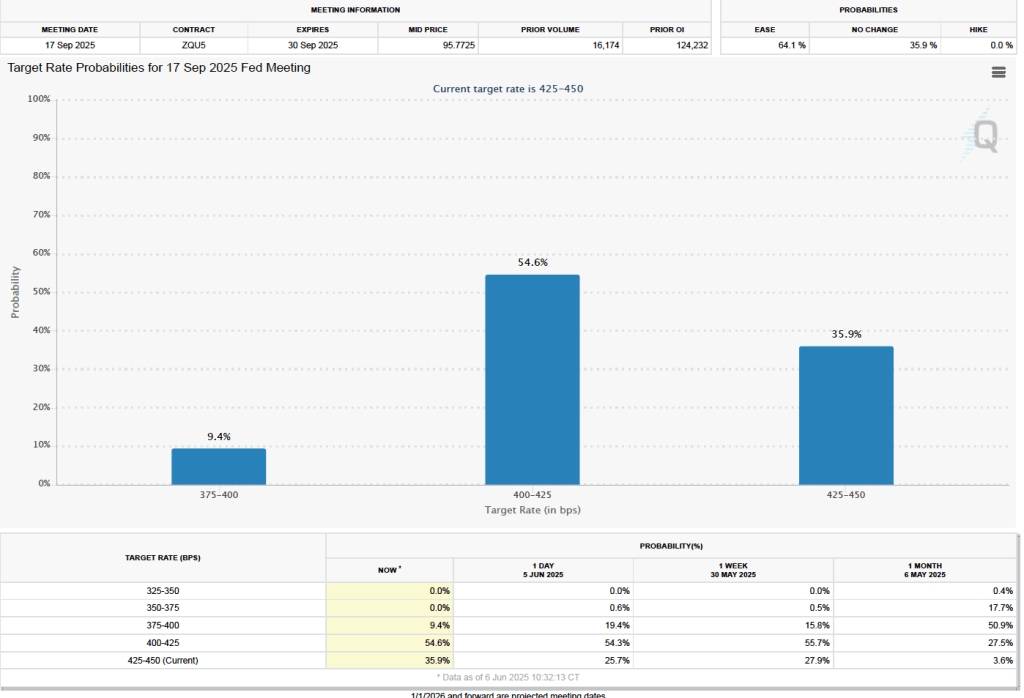
As the following figure shows, investors don’t expect the FOMC to cut its federal funds rate target until the committee’s September 16-17 meeting. Investors assign a probability of 54.6 percent that at that meeting the committee will cut its target range by 0.25 percentage point (25 basis points) to 4.00 percent to 4.25 percent. And a probability of 9.4 percent that the committee will cut its target rate by 50 baisis points to 3.75 percent to 4.00 percent. At 35.9 percent, investors assign a fairly high probability to the committee keeping its target range constant at that meeting.
In a post earlier this week, we noted that according to the usually reliable GDPNow forecast from the Federal Reserve Bank of Atlanta, real GDP in the first quarter will decline by 2.8 percent. (The forecast was updated yesterday on the basis of additional data releases to a slightly less pessimistic –2.4 percent decline.) This morning (March 7), the Bureau of Labor Statistics (BLS) released its “Employment Situation” report (often called the “jobs report”) for February. The data in the report show no sign that the U.S. economy is in a recession. We should add the caveat, however, that at the beginning of a recession the data in the jobs report can be subject to large revisions.
The jobs report has two estimates of the change in employment during the month: one estimate from the establishment survey, often referred to as the payroll survey, and one from the household survey. As we discuss in Macroeconomics, Chapter 9, Section 9.1 (Economics, Chapter 19, Section 19.1), many economists and Federal Reserve policymakers believe that employment data from the establishment survey provide a more accurate indicator of the state of the labor market than do either the employment data or the unemployment data from the household survey. (The groups included in the employment estimates from the two surveys are somewhat different, as we discuss in this post.)
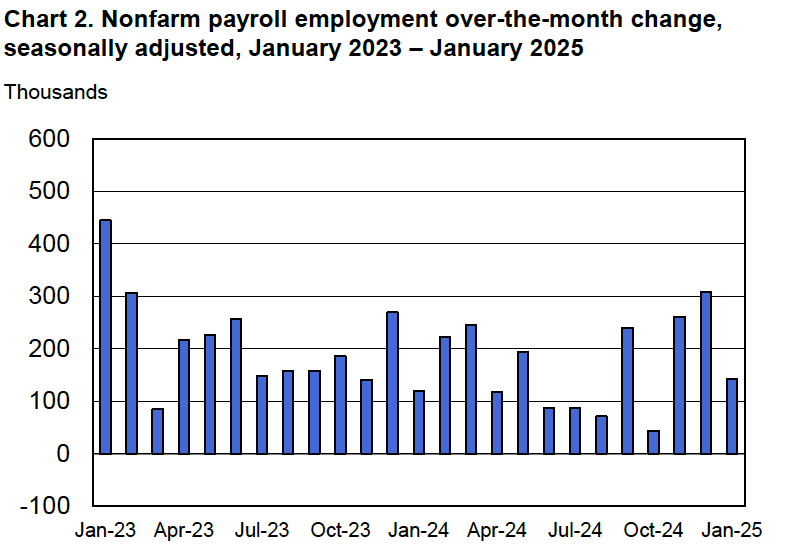
According to the establishment survey, there was a net increase of 151,000 jobs during February. This increase was below the increase of 160,000 that economists had forecast. The previously reported increase for December was revised upward, while the previously reported increase for January was revised downward. The net change in jobs, taking the revisions for those two months together, was 2,000 lower than originally estimated. (The BLS notes that: “Monthly revisions result from additional reports received from businesses and government agencies since the last published estimates and from the recalculation of seasonal factors.”) The following figure from the jobs report shows the net change in payroll employment for each month in the last two years.
The unemployment rate rose slightly to 4.1 percent in February from 4.0 percent in January. As the following figure shows, the unemployment rate has been remarkably stable in recent months, staying between 4.0 percent and 4.2 percent in each month since May 2024. Last December, the members of the Federal Open Market Committee (FOMC) forecast that the unemployment rate for 2025 would average 4.3 percent.
As the following figure shows, the net change in jobs from the household survey moves much more erratically than does the net change in jobs from the establishment survey. The net change in jobs as measured by the household survey for February showed a sharp decrease of 588,000 jobs following a very large increase of 2,234,000 jobs in January. In any particular month, the story told by the two surveys can be inconsistent with employment increasing in one survey while falling in the other. The difference was particularly dramatic this month. (In this blog post, we discuss the differences between the employment estimates in the two surveys.)
Another concerning sign in the household survey is the fall in the employment-population ratio for prime age workers—those aged 25 to 54. The ratio declined from 80.7 percent in January to 80.5 percent in February. Although the employment-population is still high relative to the average level since 2001, it’s now well below the high of 80.9 percent in mid-2024. Continuing declines in this ratio would indicate a significant softening in the labor market.
It’s unclear how many federal workers have been laid off since the Trump Administration took office. The household survey shows a decline in total federal government employment of 10,000 in February. The household survey was conducted in the week that included February 12, so, it’s possible that next month’s jobs report may find a more significant decline.
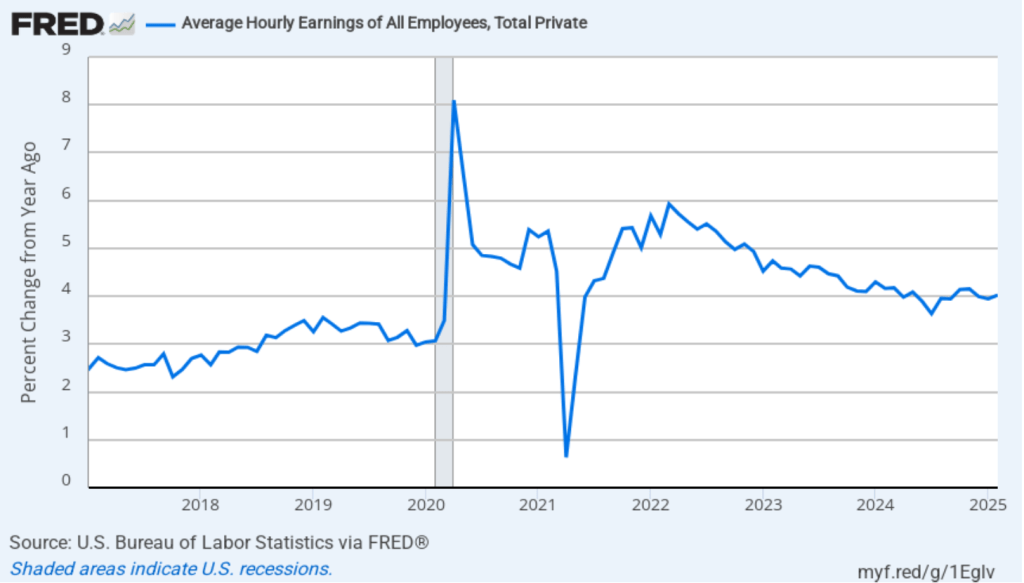
The establishment survey also includes data on average hourly earnings (AHE). As we noted in this post, many economists and policymakers believe the employment cost index (ECI) is a better measure of wage pressures in the economy than is the AHE. The AHE does have the important advantage of being available monthly, whereas the ECI is only available quarterly. The following figure shows the percentage change in the AHE from the same month in the previous year. The AHE increased 4.0 percent in February, up slightly from 3.9 percent in January.
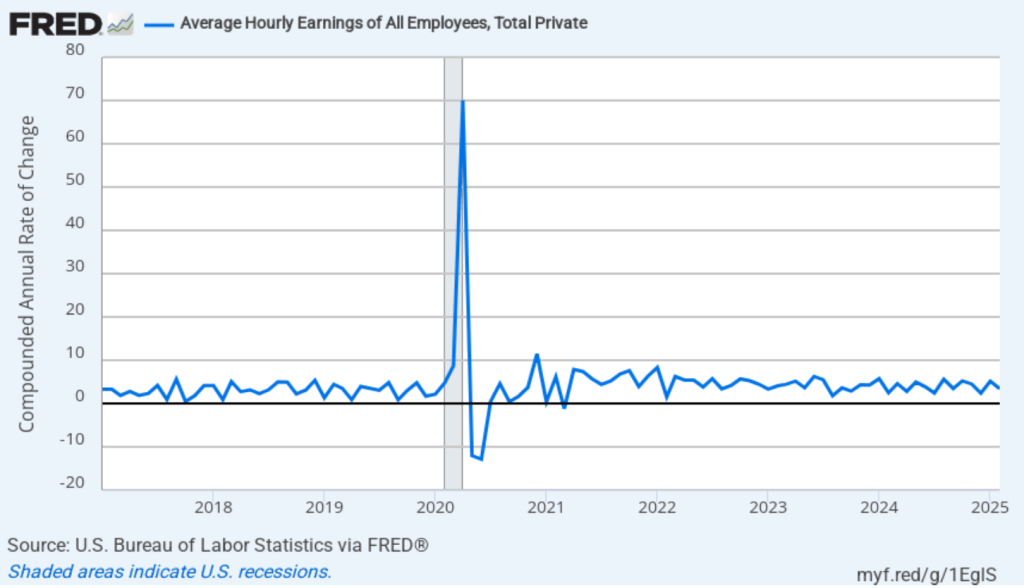
The following figure shows wage inflation calculated by compounding the current month’s rate over an entire year. (The figure above shows what is sometimes called 12-month wage inflation, whereas this figure shows 1-month wage inflation.) One-month wage inflation is much more volatile than 12-month wage inflation—note the very large swings in 1-month wage inflation in April and May 2020 during the business closures caused by the Covid pandemic. The February 1-month rate of wage inflation was 3.4 percent, a decline from the surprisingly high 5.2 percent rate in December. Whether measured as a 12-month increase or as a 1-month increase, AHE is still increasing somewhat more rapidly than is consistent with the Fed achieving its 2 percent target rate of price inflation.
Today’s jobs report leaves the situation facing the Federal Reserve’s policy-making Federal Open Market Committee (FOMC) largely unchanged. There are some indications that the economy may be weakening, as shown by some of the data in the jobs report and by some of the data incorporated by the Atlanta Fed in its pessimistic nowcast of first quarter real GDP. But the Fed hasn’t yet brought inflation down to its 2 percent annual target. In addition, it’s unclear how the Trump Administration’s policies—particularly with respect to tariff increases—might affect the economy. Speaking today at an event at the University of Chicago, Fed Chair Jerome Powell observed the following:
“Looking ahead, the new Administration is in the process of implementing significant policy changes in four distinct areas: trade, immigration, fiscal policy, and regulation. It is the net effect of these policy changes that will matter for the economy and for the path of monetary policy. While there have been recent developments in some of these areas, especially trade policy, uncertainty around the changes and their likely effects remains high. As we parse the incoming information, we are focused on separating the signal from the noise as the outlook evolves. We do not need to be in a hurry, and are well positioned to wait for greater clarity.”
The likeliest outcome is that the FOMC will keep its target for the federal funds rate unchanged, perhaps for several meetings, unless additional data are released that clearly show the economy to be weakening.
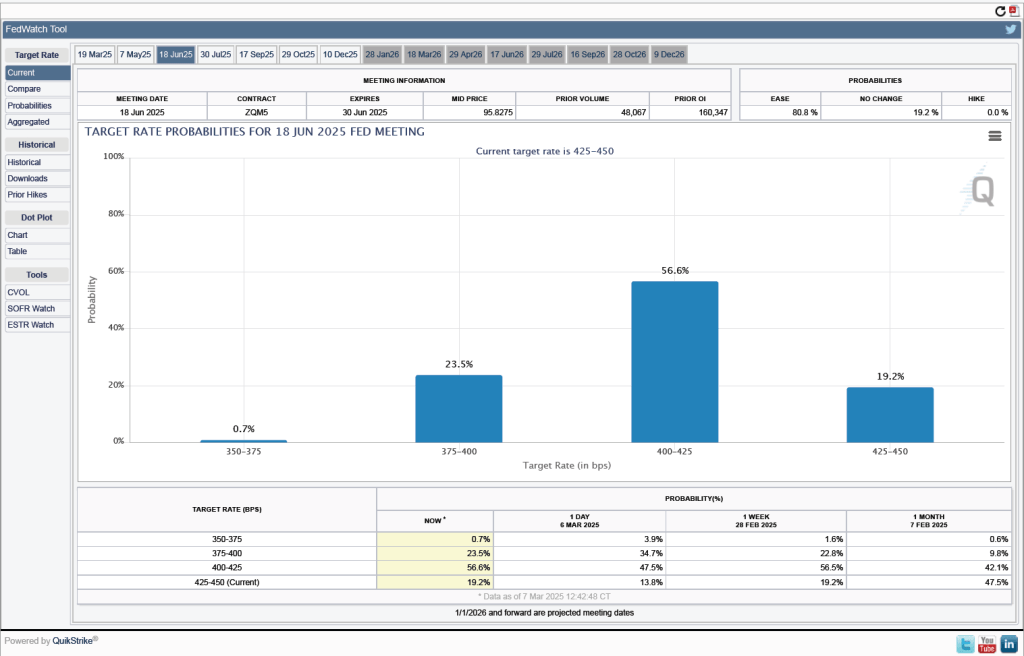
One indication of expectations of future cuts in the target for the federal funds rate comes from investors who buy and sell federal funds futures contracts. (We discuss the futures market for federal funds in this blog post.) The data from the futures market indicates that investors don’t expect that the FOMC will cut its target for the federal funds rate at either its March 18–19 or May 6–7 meetings. As shown in the following figure, only at the FOMC’s June 17–18 meeting do investors assign a greater than 50 percent probability to the committee cutting its target. As of this afternoon, investors assign a probability of only 19.2 percent to the FOMC keeping its target unchanged at 4.25 percent to 4.50 percent at that meeting. They assign a probability of 80.8 percent to the committee cutting its target rate by at least 0.25 percentage point (25 basis points) at that meeting.
This morning (February 7), the Bureau of Labor Statistics (BLS) released its “Employment Situation” report (often called the “jobs report”) for January. This report was particularly interesting because it includes data reflecting the annual benchmark revision to the establishment, or payroll, survey and the annual revision of the household survey data to match new population estimates from the Census Bureau.
According to the establishment survey, there was a net increase of 143,000 jobs during January. This increase was below the increase of 169,000 to 175,000 that economists had forecast in surveys by the Wall Street Journal and bloomberg.com. The somewhat weak increase in jobs during January was offset by upward revisions to the initial estimates for November and December. The previously reported increases in employment for those months were revised upward by a total of 100,000 jobs. (The BLS notes that: “Monthly revisions result from additional reports received from businesses and government agencies since the last published estimates and from the recalculation of seasonal factors.”)
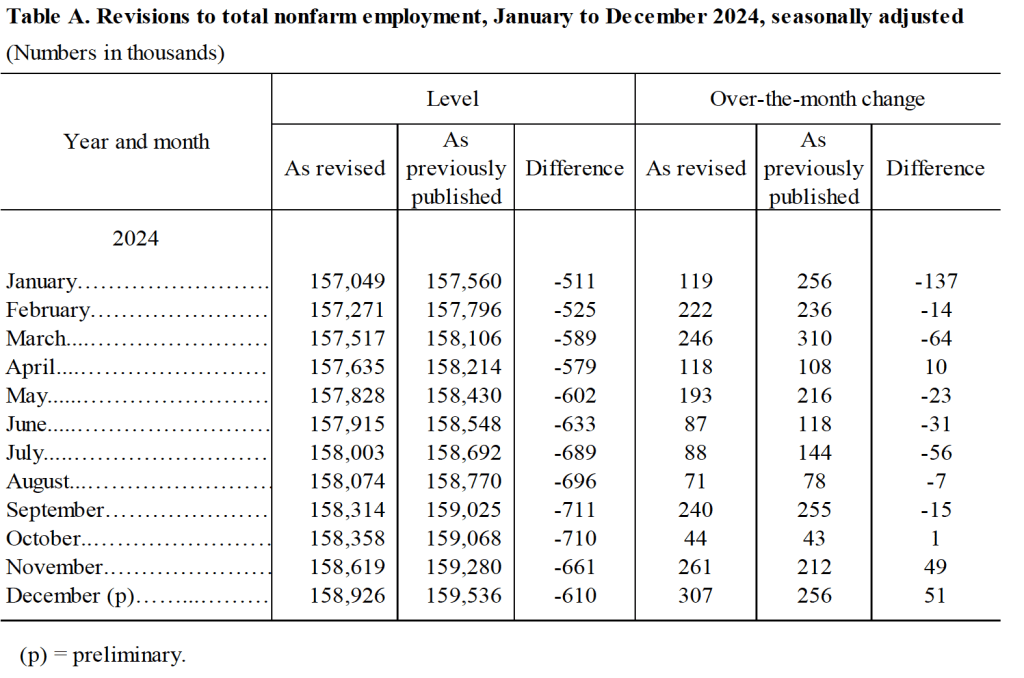
The BLS also announced the results of its annual revision of the payroll employment data benchmarked to March 2024. The revisions are mainly based on data from the Quarterly Census of Employment and Wages (QCEW). The data in payroll survey are derived from a sample of 300,000 establishments, whereas the QCEW is based on a much more comprehensive count of workers covered by state unemployment insurance programs. The revisions indicated that growth in payroll employment between March 2023 and March 2024 had been overstated by 598,000 jobs. Although large in absolute scale, the revisions equal only 0.4 percent of total employment. In addition, as we discussed in this blog post last August, initially the BLS had estimated that the overstatement in employment gains during this period was an even larger 818,000 jobs. (The BLS provides a comprehensive discuss of its revisions to the establishment employment data here.)
The following table shows the revised estimates for each month of 2024, based on the new benchmarking.
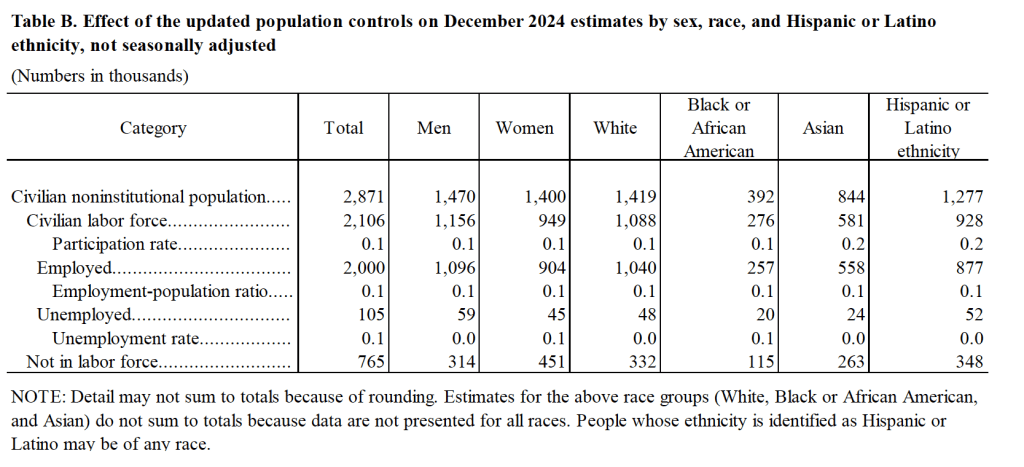
The BLS also revised the household survey data to reflect the latest population estimates from the census bureau. Unlike with the establishment data, the BLS doesn’t adjust the historical household data in light of the population benchmarking. However, the BLS did include two tables in this month’s jobs report illustrating the effect of the new population benchmark. The following table from the report shows the effect of the benchmarking on some labor market data for December 2024. The revision increases the estimate of the civilian noninstitutional population by nearly 3 million, most of which is attributable to an increase in the estimated immigrant population. The increase in the estimate of the number of employed workers was also large at 2 million. (The BLS provides a discussion of the effects of its population benchmarking here.)
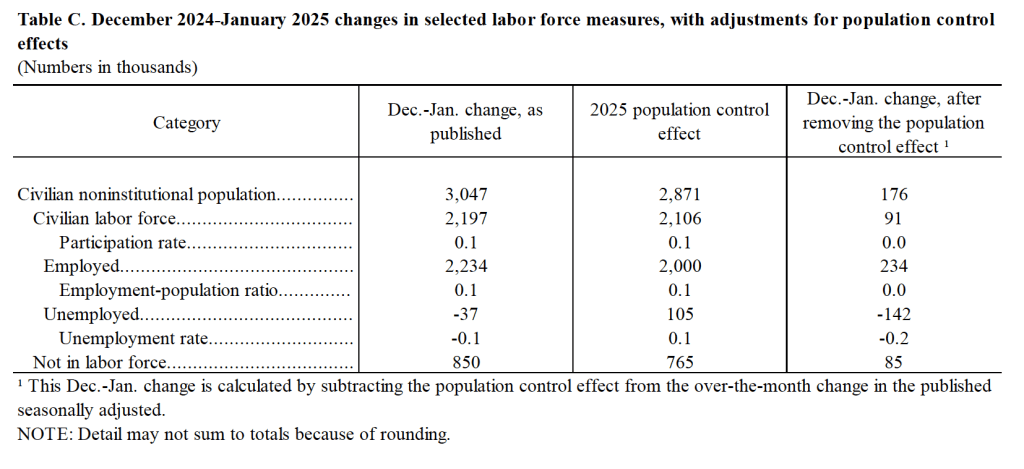
The following table shows how the population benchmarking affects changes in estimates of labor market variables between December 2024 and January 2025. The population benchmarking increases the net number of jobs created in January by 234,000 and reduces the increase in the number of persons unemployed by 142,000.
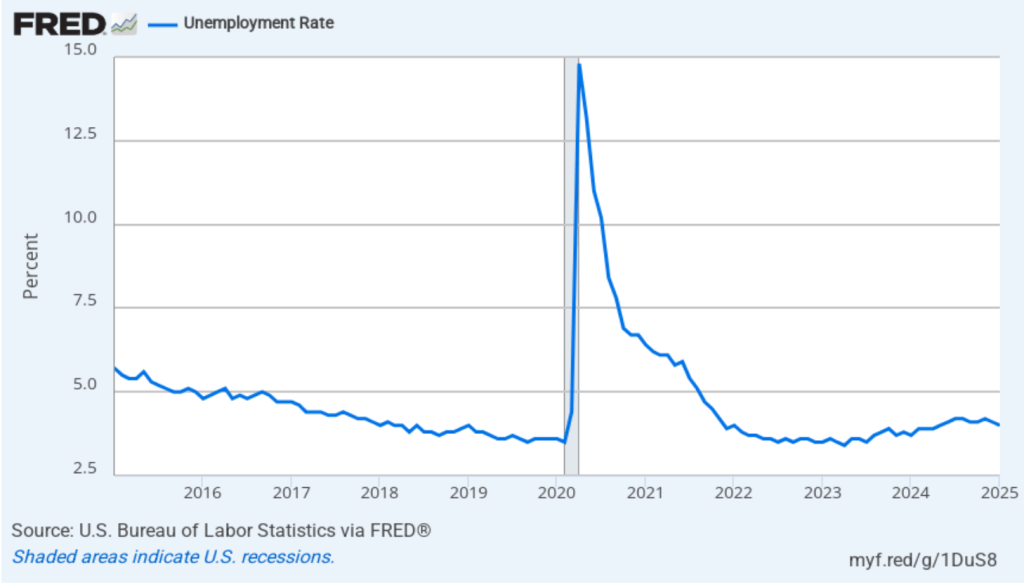
As the following figure shows, the unemployment rate, as reported in the household survey, decreased from 4.1 percent in December to 4.0 percent in January. The figure shows that the unemployment rate has fluctuated in a fairly narrow range over the past year.
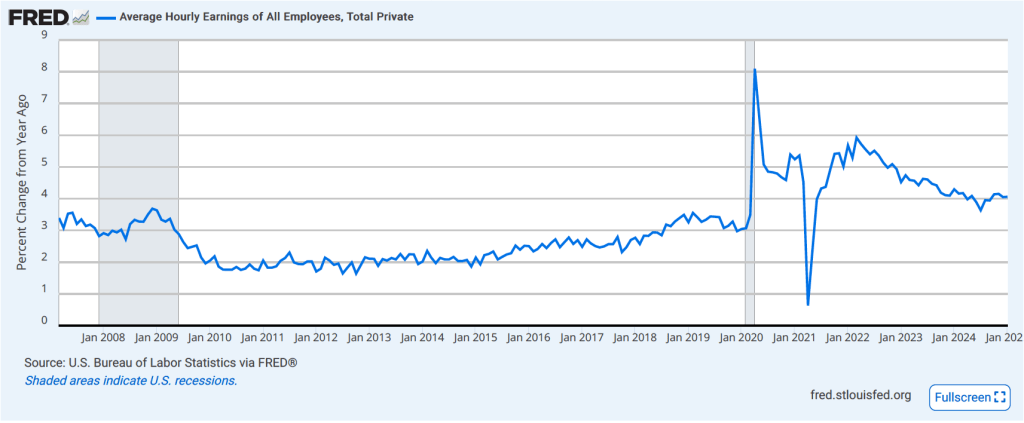
The establishment survey also includes data on average hourly earnings (AHE). As we’ve noted in previous posts, many economists and policymakers believe the employment cost index (ECI) is a better measure of wage pressures in the economy than is the AHE. The AHE does have the important advantage of being available monthly, whereas the ECI is only available quarterly. The following figure shows the percentage change in the AHE from the same month in the previous year. AHE increased 4.1 percent in January, which was unchanged from the December increase. By this measure, wage growth is still somewhat higher than is consistent with annual price inflation running at the Fed’s target of 2 percent.
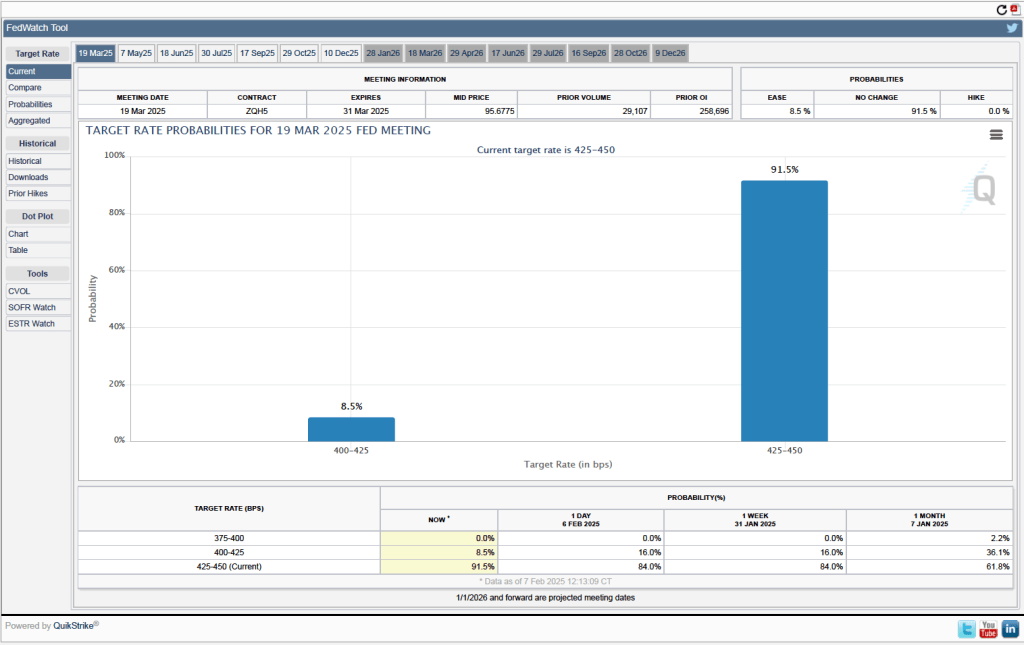
There isn’t much in today’s jobs report to change the consensus view that the Fed’s policymaking Federal Open Market Committee (FOMC) will leave its target for the federal funds rate unchanged at its next meeting on March 18-19. One indication of expectations of future rate cuts comes from investors who buy and sell federal funds futures contracts. (We discuss the futures market for federal funds in this blog post.) As shown in the following figure, today these investors assign a probability of 91.5 percent to the FOMC keeping its target range for the federal funds rate unchanged at the current range of 4.25 percent to 4.50 percent at the March meeting. Investors assign a probability of only 8.5 percent to the FOMC cutting its target range by 25 basis points at that meeting.