Strong Jobs Report with No Sign of Recession

Image generated by GTP-4o

In a post earlier this week, we noted that according to the usually reliable GDPNow forecast from the Federal Reserve Bank of Atlanta, real GDP in the first quarter will decline by 2.8 percent. (The forecast was updated yesterday on the basis of additional data releases to a slightly less pessimistic –2.4 percent decline.) This morning (March 7), the Bureau of Labor Statistics (BLS) released its “Employment Situation” report (often called the “jobs report”) for February. The data in the report show no sign that the U.S. economy is in a recession. We should add the caveat, however, that at the beginning of a recession the data in the jobs report can be subject to large revisions.

The jobs report has two estimates of the change in employment during the month: one estimate from the establishment survey, often referred to as the payroll survey, and one from the household survey. As we discuss in Macroeconomics, Chapter 9, Section 9.1 (Economics, Chapter 19, Section 19.1), many economists and Federal Reserve policymakers believe that employment data from the establishment survey provide a more accurate indicator of the state of the labor market than do either the employment data or the unemployment data from the household survey. (The groups included in the employment estimates from the two surveys are somewhat different, as we discuss in this post.)

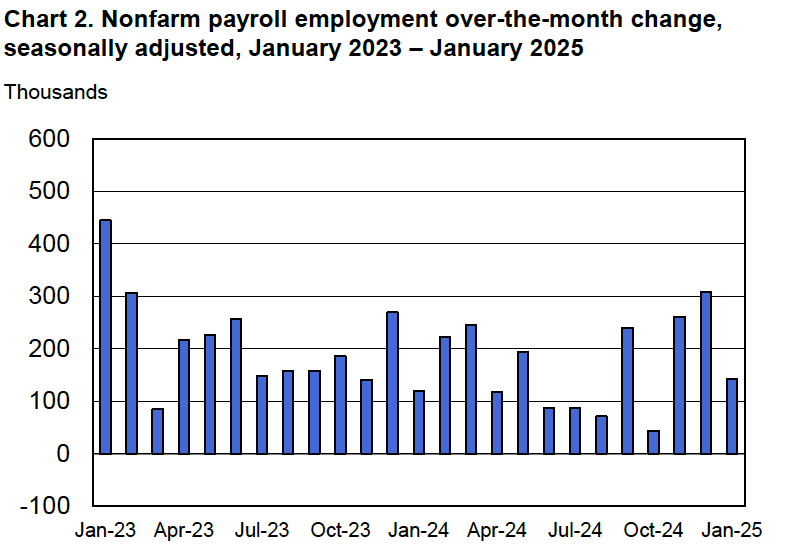
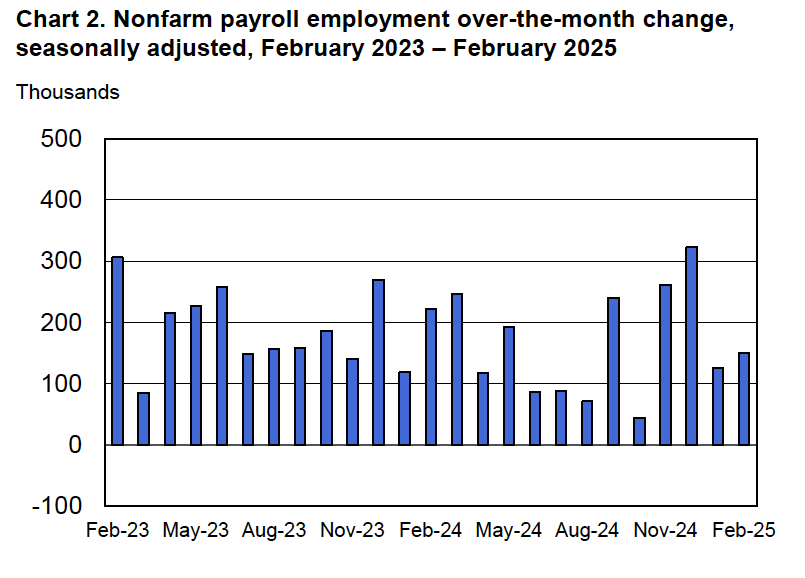
According to the establishment survey, there was a net increase of 151,000 jobs during February. This increase was below the increase of 160,000 that economists had forecast. The previously reported increase for December was revised upward, while the previously reported increase for January was revised downward. The net change in jobs, taking the revisions for those two months together, was 2,000 lower than originally estimated. (The BLS notes that: “Monthly revisions result from additional reports received from businesses and government agencies since the last published estimates and from the recalculation of seasonal factors.”) The following figure from the jobs report shows the net change in payroll employment for each month in the last two years.
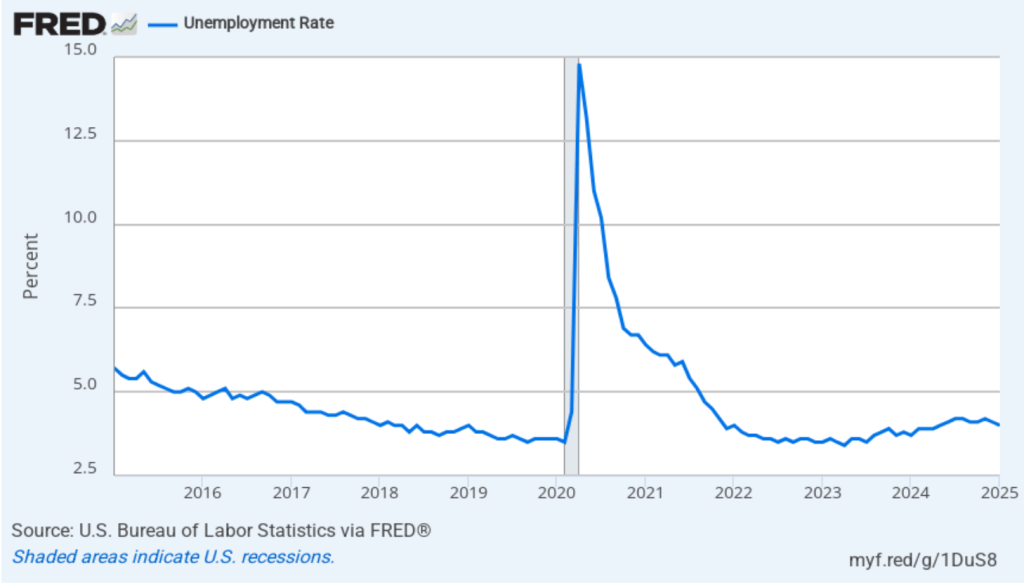
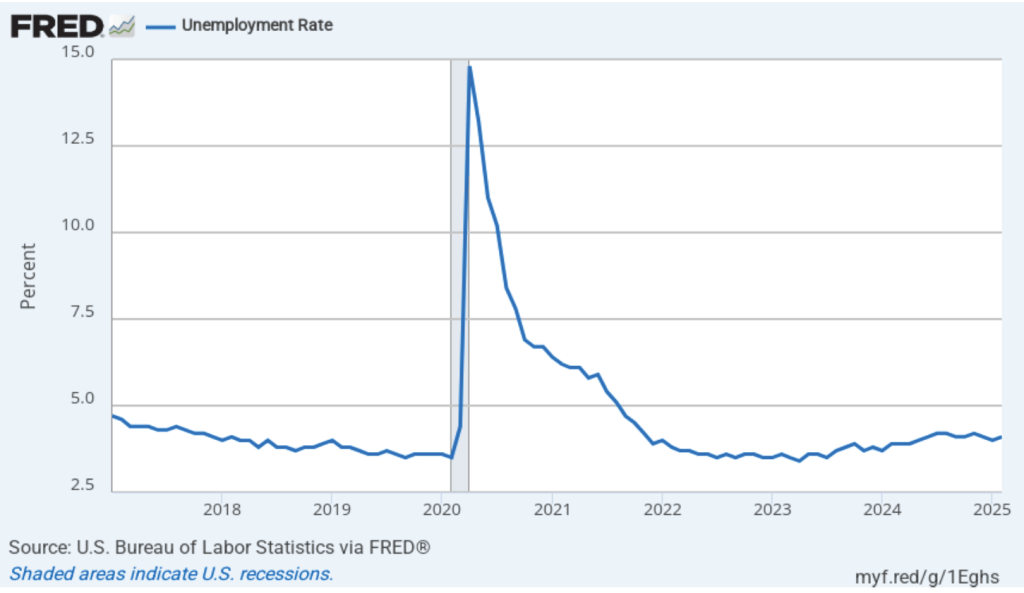
The unemployment rate rose slightly to 4.1 percent in February from 4.0 percent in January. As the following figure shows, the unemployment rate has been remarkably stable in recent months, staying between 4.0 percent and 4.2 percent in each month since May 2024. Last December, the members of the Federal Open Market Committee (FOMC) forecast that the unemployment rate for 2025 would average 4.3 percent.
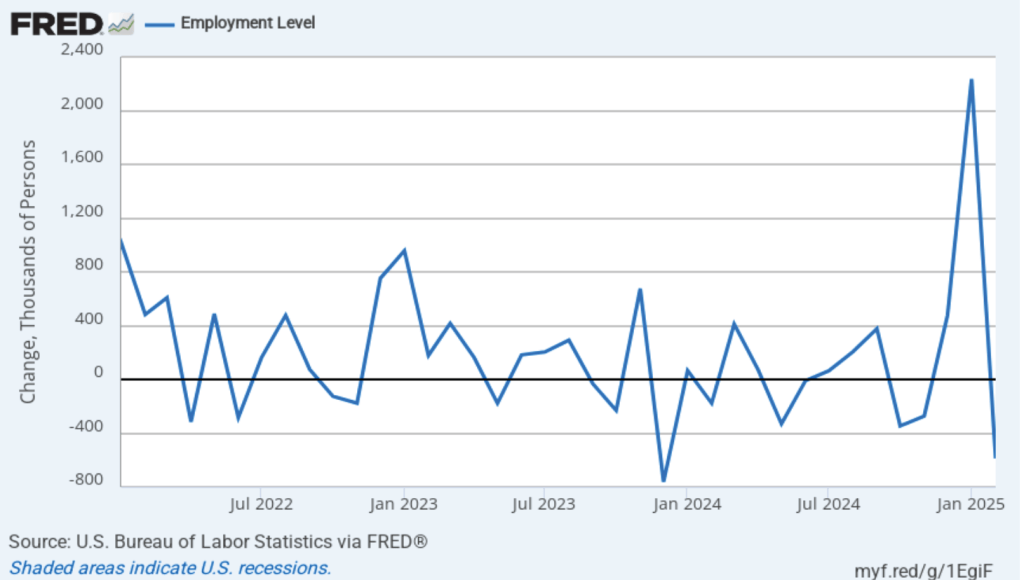
As the following figure shows, the net change in jobs from the household survey moves much more erratically than does the net change in jobs from the establishment survey. The net change in jobs as measured by the household survey for February showed a sharp decrease of 588,000 jobs following a very large increase of 2,234,000 jobs in January. In any particular month, the story told by the two surveys can be inconsistent with employment increasing in one survey while falling in the other. The difference was particularly dramatic this month. (In this blog post, we discuss the differences between the employment estimates in the two surveys.)
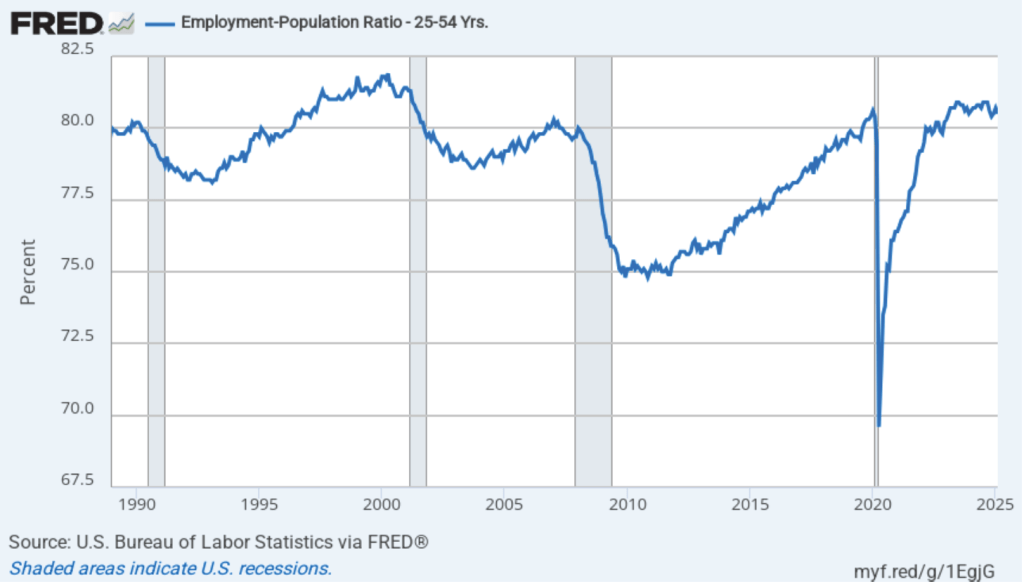
Another concerning sign in the household survey is the fall in the employment-population ratio for prime age workers—those aged 25 to 54. The ratio declined from 80.7 percent in January to 80.5 percent in February. Although the employment-population is still high relative to the average level since 2001, it’s now well below the high of 80.9 percent in mid-2024. Continuing declines in this ratio would indicate a significant softening in the labor market.
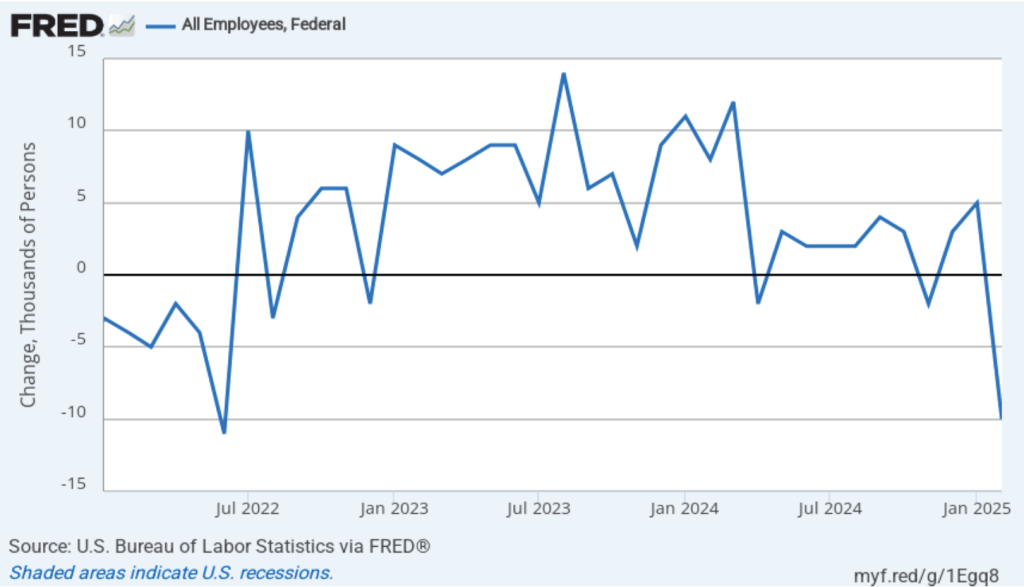
It’s unclear how many federal workers have been laid off since the Trump Administration took office. The household survey shows a decline in total federal government employment of 10,000 in February. The household survey was conducted in the week that included February 12, so, it’s possible that next month’s jobs report may find a more significant decline.
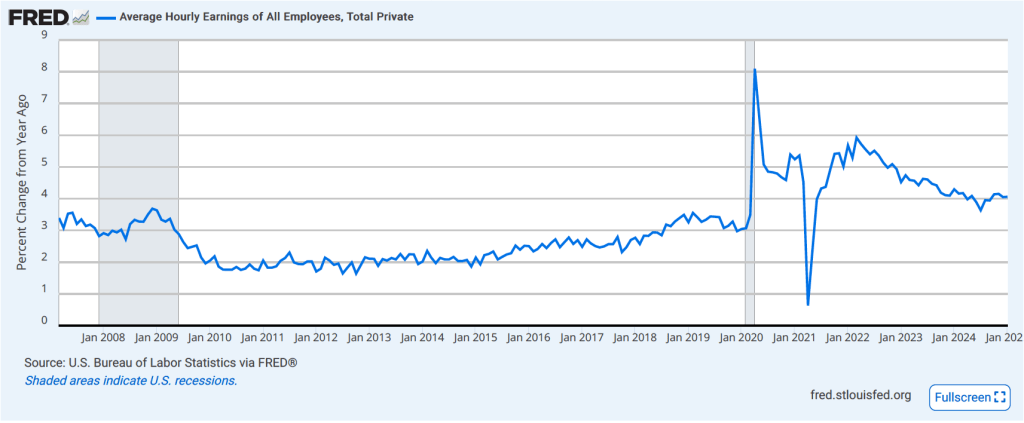
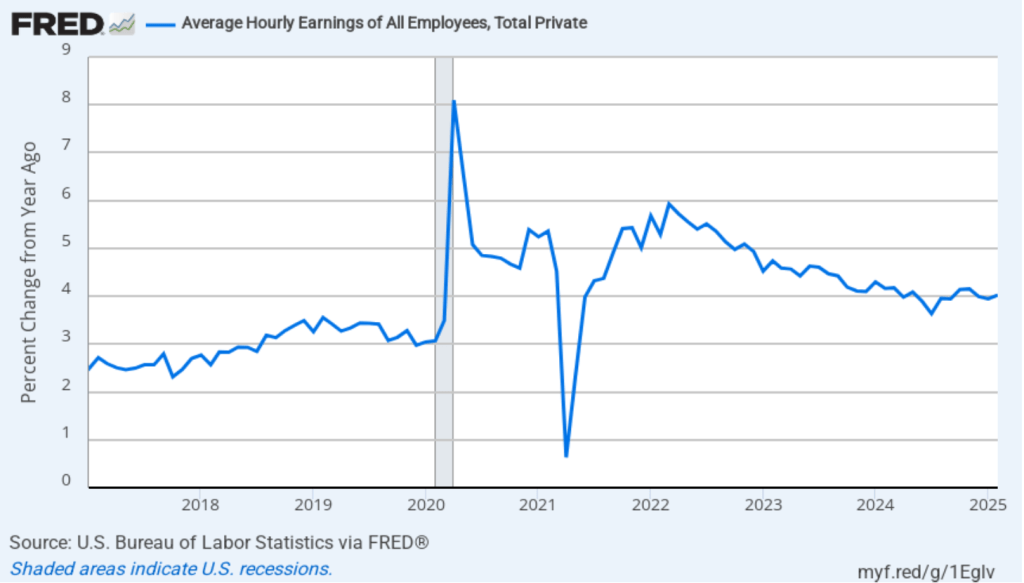
The establishment survey also includes data on average hourly earnings (AHE). As we noted in this post, many economists and policymakers believe the employment cost index (ECI) is a better measure of wage pressures in the economy than is the AHE. The AHE does have the important advantage of being available monthly, whereas the ECI is only available quarterly. The following figure shows the percentage change in the AHE from the same month in the previous year. The AHE increased 4.0 percent in February, up slightly from 3.9 percent in January.
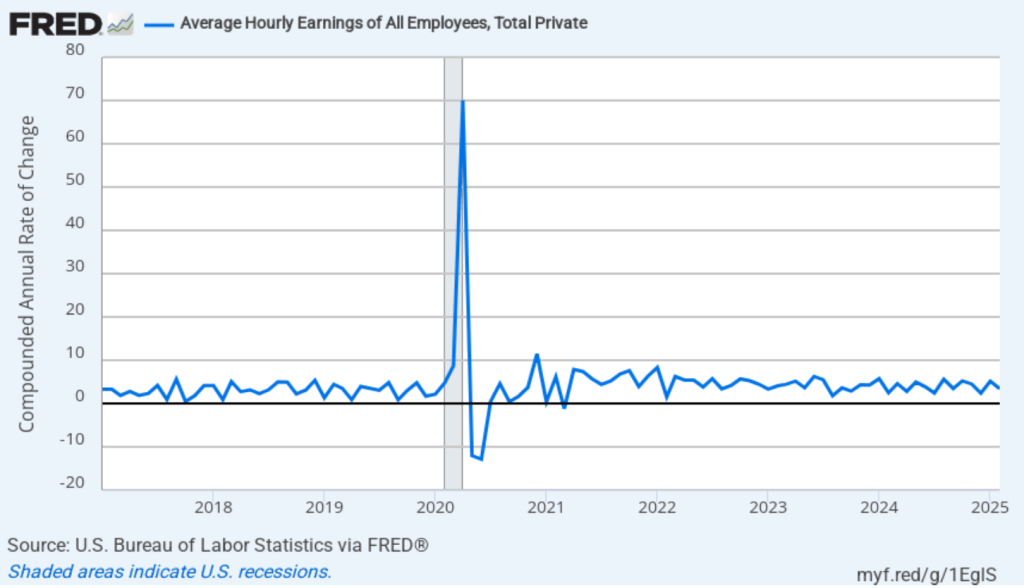
The following figure shows wage inflation calculated by compounding the current month’s rate over an entire year. (The figure above shows what is sometimes called 12-month wage inflation, whereas this figure shows 1-month wage inflation.) One-month wage inflation is much more volatile than 12-month wage inflation—note the very large swings in 1-month wage inflation in April and May 2020 during the business closures caused by the Covid pandemic. The February 1-month rate of wage inflation was 3.4 percent, a decline from the surprisingly high 5.2 percent rate in December. Whether measured as a 12-month increase or as a 1-month increase, AHE is still increasing somewhat more rapidly than is consistent with the Fed achieving its 2 percent target rate of price inflation.
Today’s jobs report leaves the situation facing the Federal Reserve’s policy-making Federal Open Market Committee (FOMC) largely unchanged. There are some indications that the economy may be weakening, as shown by some of the data in the jobs report and by some of the data incorporated by the Atlanta Fed in its pessimistic nowcast of first quarter real GDP. But the Fed hasn’t yet brought inflation down to its 2 percent annual target. In addition, it’s unclear how the Trump Administration’s policies—particularly with respect to tariff increases—might affect the economy. Speaking today at an event at the University of Chicago, Fed Chair Jerome Powell observed the following:

“Looking ahead, the new Administration is in the process of implementing significant policy changes in four distinct areas: trade, immigration, fiscal policy, and regulation. It is the net effect of these policy changes that will matter for the economy and for the path of monetary policy. While there have been recent developments in some of these areas, especially trade policy, uncertainty around the changes and their likely effects remains high. As we parse the incoming information, we are focused on separating the signal from the noise as the outlook evolves. We do not need to be in a hurry, and are well positioned to wait for greater clarity.”

The likeliest outcome is that the FOMC will keep its target for the federal funds rate unchanged, perhaps for several meetings, unless additional data are released that clearly show the economy to be weakening.

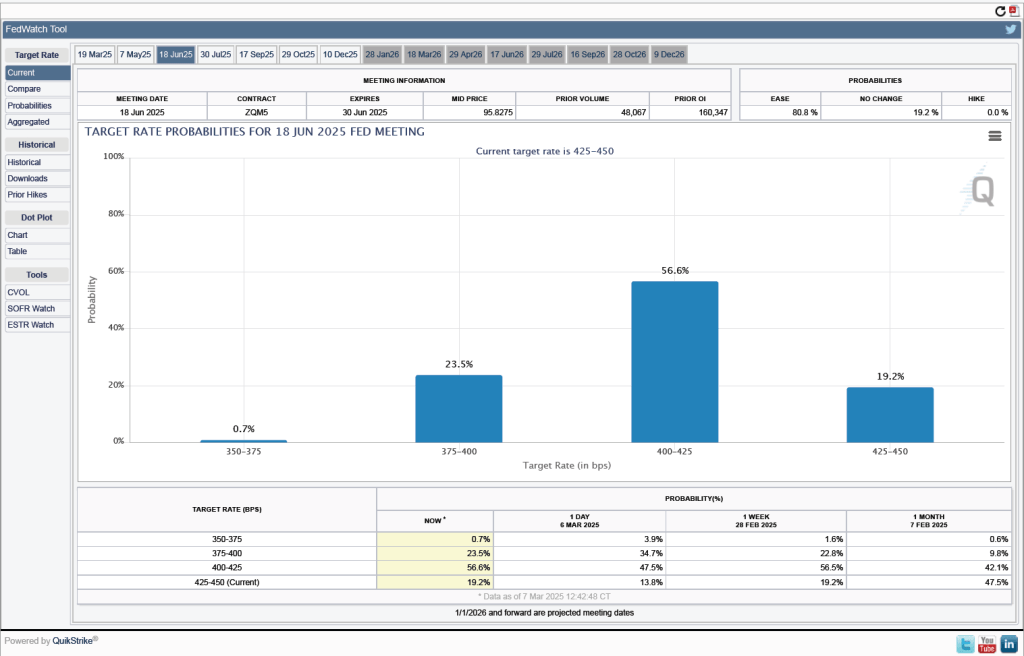
One indication of expectations of future cuts in the target for the federal funds rate comes from investors who buy and sell federal funds futures contracts. (We discuss the futures market for federal funds in this blog post.) The data from the futures market indicates that investors don’t expect that the FOMC will cut its target for the federal funds rate at either its March 18–19 or May 6–7 meetings. As shown in the following figure, only at the FOMC’s June 17–18 meeting do investors assign a greater than 50 percent probability to the committee cutting its target. As of this afternoon, investors assign a probability of only 19.2 percent to the FOMC keeping its target unchanged at 4.25 percent to 4.50 percent at that meeting. They assign a probability of 80.8 percent to the committee cutting its target rate by at least 0.25 percentage point (25 basis points) at that meeting.
Strong Jobs Report in the Context of Annual Revisions to the Establishment and Household Surveys

Photo courtesy of Lena Buonanno

This morning (February 7), the Bureau of Labor Statistics (BLS) released its “Employment Situation” report (often called the “jobs report”) for January. This report was particularly interesting because it includes data reflecting the annual benchmark revision to the establishment, or payroll, survey and the annual revision of the household survey data to match new population estimates from the Census Bureau.

According to the establishment survey, there was a net increase of 143,000 jobs during January. This increase was below the increase of 169,000 to 175,000 that economists had forecast in surveys by the Wall Street Journal and bloomberg.com. The somewhat weak increase in jobs during January was offset by upward revisions to the initial estimates for November and December. The previously reported increases in employment for those months were revised upward by a total of 100,000 jobs. (The BLS notes that: “Monthly revisions result from additional reports received from businesses and government agencies since the last published estimates and from the recalculation of seasonal factors.”)

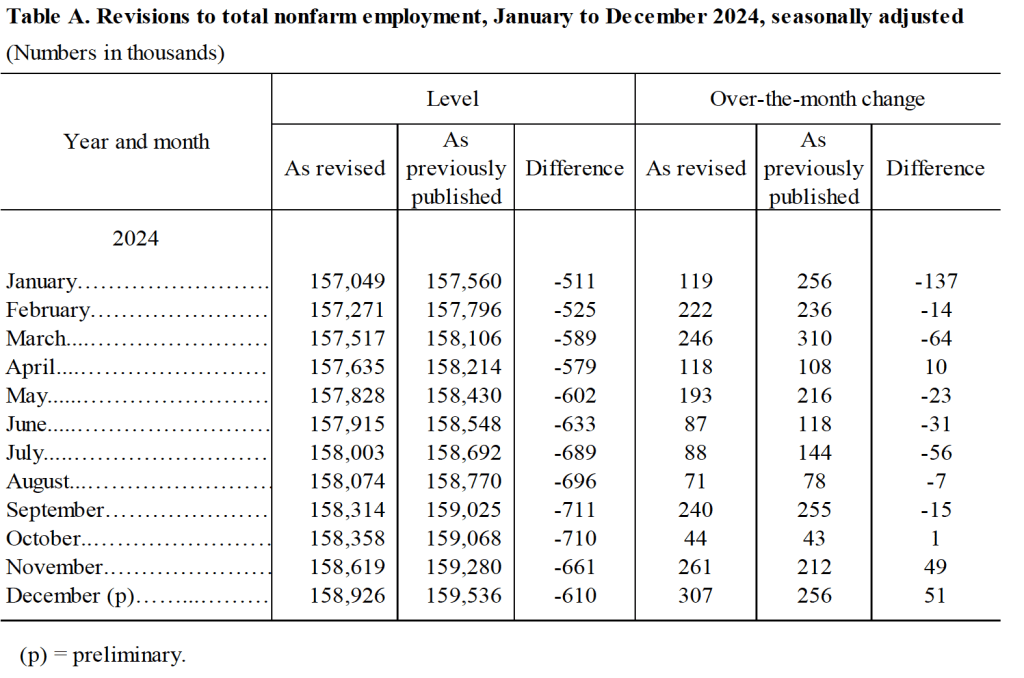
The BLS also announced the results of its annual revision of the payroll employment data benchmarked to March 2024. The revisions are mainly based on data from the Quarterly Census of Employment and Wages (QCEW). The data in payroll survey are derived from a sample of 300,000 establishments, whereas the QCEW is based on a much more comprehensive count of workers covered by state unemployment insurance programs. The revisions indicated that growth in payroll employment between March 2023 and March 2024 had been overstated by 598,000 jobs. Although large in absolute scale, the revisions equal only 0.4 percent of total employment. In addition, as we discussed in this blog post last August, initially the BLS had estimated that the overstatement in employment gains during this period was an even larger 818,000 jobs. (The BLS provides a comprehensive discuss of its revisions to the establishment employment data here.)

The following table shows the revised estimates for each month of 2024, based on the new benchmarking.

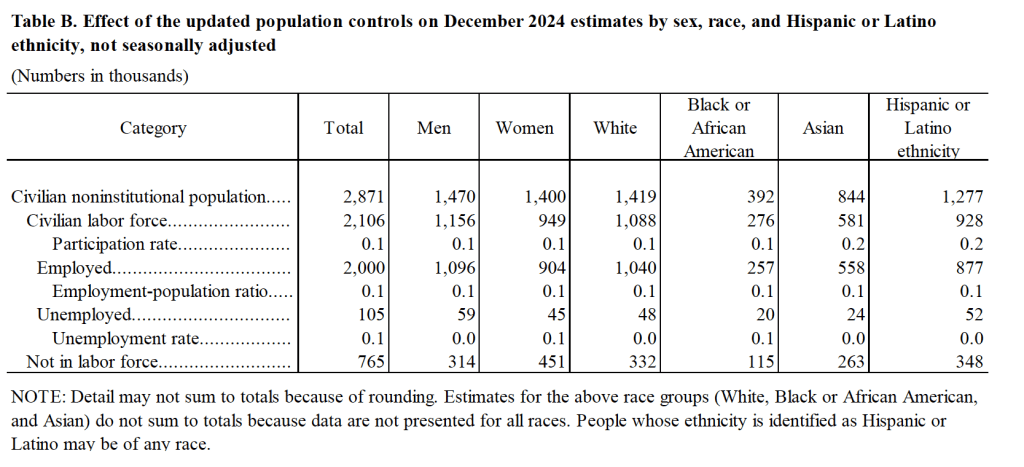
The BLS also revised the household survey data to reflect the latest population estimates from the census bureau. Unlike with the establishment data, the BLS doesn’t adjust the historical household data in light of the population benchmarking. However, the BLS did include two tables in this month’s jobs report illustrating the effect of the new population benchmark. The following table from the report shows the effect of the benchmarking on some labor market data for December 2024. The revision increases the estimate of the civilian noninstitutional population by nearly 3 million, most of which is attributable to an increase in the estimated immigrant population. The increase in the estimate of the number of employed workers was also large at 2 million. (The BLS provides a discussion of the effects of its population benchmarking here.)

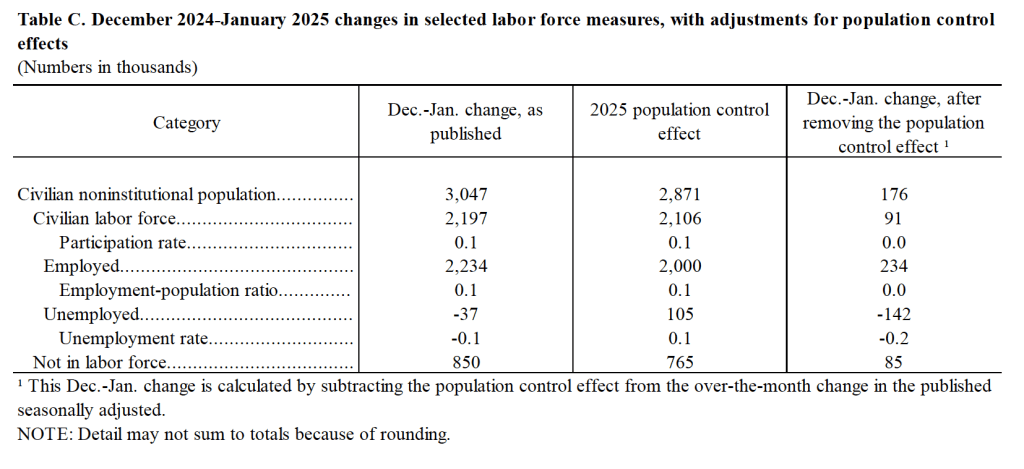
The following table shows how the population benchmarking affects changes in estimates of labor market variables between December 2024 and January 2025. The population benchmarking increases the net number of jobs created in January by 234,000 and reduces the increase in the number of persons unemployed by 142,000.

As the following figure shows, the unemployment rate, as reported in the household survey, decreased from 4.1 percent in December to 4.0 percent in January. The figure shows that the unemployment rate has fluctuated in a fairly narrow range over the past year.

The establishment survey also includes data on average hourly earnings (AHE). As we’ve noted in previous posts, many economists and policymakers believe the employment cost index (ECI) is a better measure of wage pressures in the economy than is the AHE. The AHE does have the important advantage of being available monthly, whereas the ECI is only available quarterly. The following figure shows the percentage change in the AHE from the same month in the previous year. AHE increased 4.1 percent in January, which was unchanged from the December increase. By this measure, wage growth is still somewhat higher than is consistent with annual price inflation running at the Fed’s target of 2 percent.

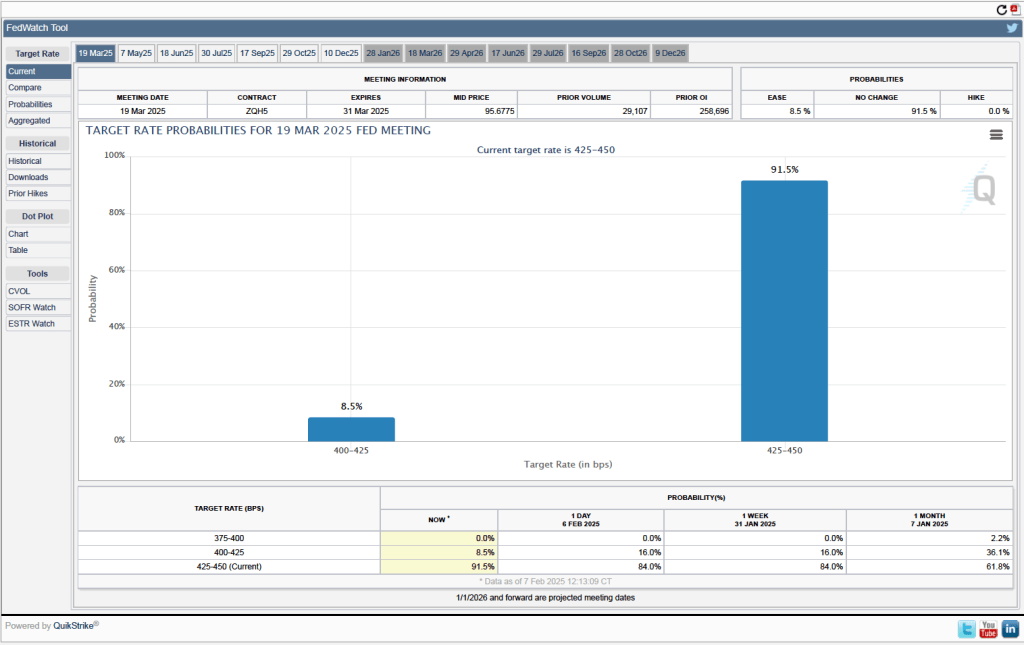
There isn’t much in today’s jobs report to change the consensus view that the Fed’s policymaking Federal Open Market Committee (FOMC) will leave its target for the federal funds rate unchanged at its next meeting on March 18-19. One indication of expectations of future rate cuts comes from investors who buy and sell federal funds futures contracts. (We discuss the futures market for federal funds in this blog post.) As shown in the following figure, today these investors assign a probability of 91.5 percent to the FOMC keeping its target range for the federal funds rate unchanged at the current range of 4.25 percent to 4.50 percent at the March meeting. Investors assign a probability of only 8.5 percent to the FOMC cutting its target range by 25 basis points at that meeting.

Weaker Than Expected Jobs Report Likely Due to the Effects of Hurricanes and Strikes

Image generated by GTP-4o.

The Bureau of Labor Statistics (BLS) releases the “Employment Situation” report (often called the “jobs report”) monthly.  Economists and policymakers follow this report closely because it provides important insight into the current state of the U.S. economy. The October jobs report was released this morning, November 1 As sometimes happens, the data in the report were distorted by unusual events last month, primarily the effects of hurricanes and strikes. The BLS reported the results of its surveys without attempting to correct for these events. With respect to hurricanes, the BLS noted:

“No changes were made to either the establishment or household survey estimation procedures for the October data. It is likely that payroll employment estimates in some industries were affected by the hurricanes; however, it is not possible to quantify the net effect on the over-the-month change in national employment, hours, or earnings estimates because the establishment survey is not designed to isolate effects from extreme weather events. There was no discernible effect on the national unemployment rate from the household survey.”

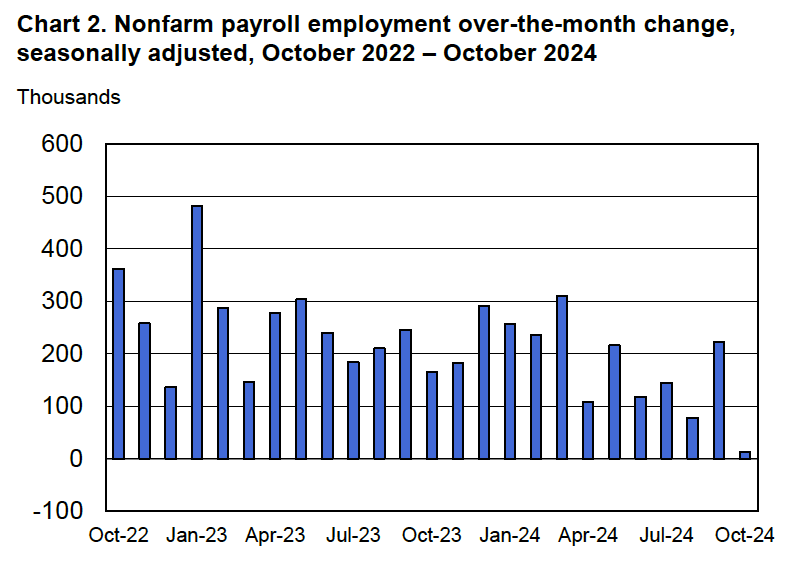
Economists who participated in various surveys had forecast that payroll employment would increase by 117,500, with the unemployment rate—which is calculated from data in the household survey—being unchanged at 4.1 percent. The forecast of the unemployment rate was accurate, as the BLS reported a 4.1 percent unemployment rate in October. But the BLS reported that payroll employment had increased by only 12,000. In addition, the BLS revised downward its estimates of the employment increases in August and September by a total of 112,000. (The BLS notes that: “Monthly revisions result from additional reports received from businesses and government agencies since the last published estimates and from the recalculation of seasonal factors.”) The following figure, taken from the BLS report, shows the net changes in employment for each month during the past two years.

What had initially seemed to be particularly strong growth in employment in September, possibly indicating a significant increase in the demand for labor, has been partially reversed by the data revision.

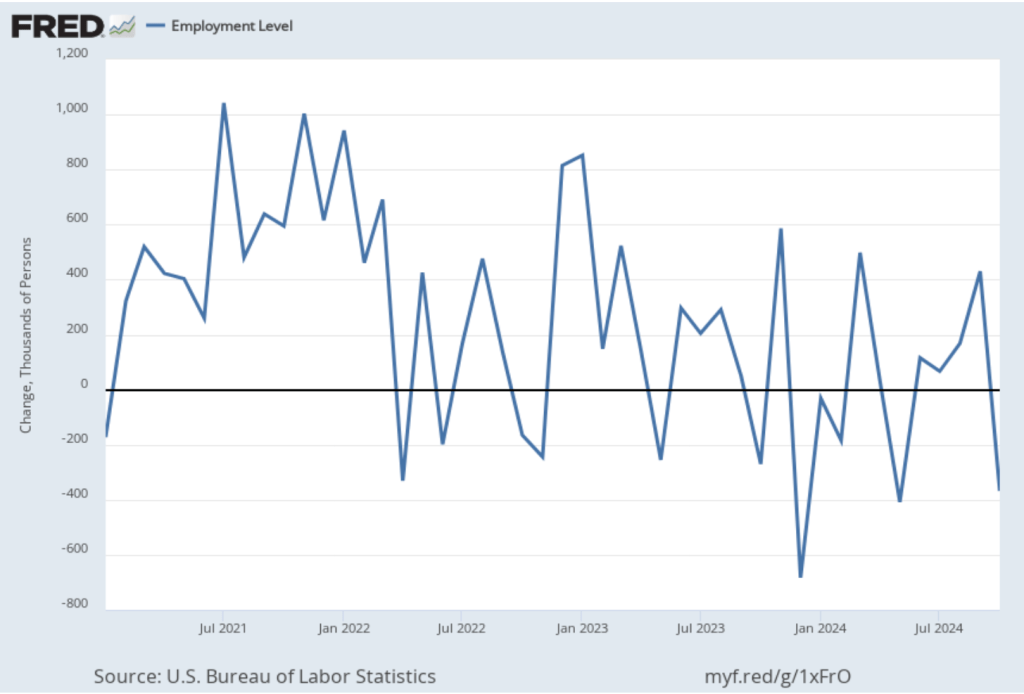
As the following figure shows, the net change in jobs from the household survey moves much more erratically than does the net change in jobs from the establishment survey. The net change in jobs as measured by the household survey for October was a decline of 368,000 jobs after an increase of 430,000 jobs in September. So, the story told by the two surveys was similar: significant weakening in the job market. But we need to keep in mind the important qualification that the job market in some areas of the country had been disrupted by unusual events during the month.

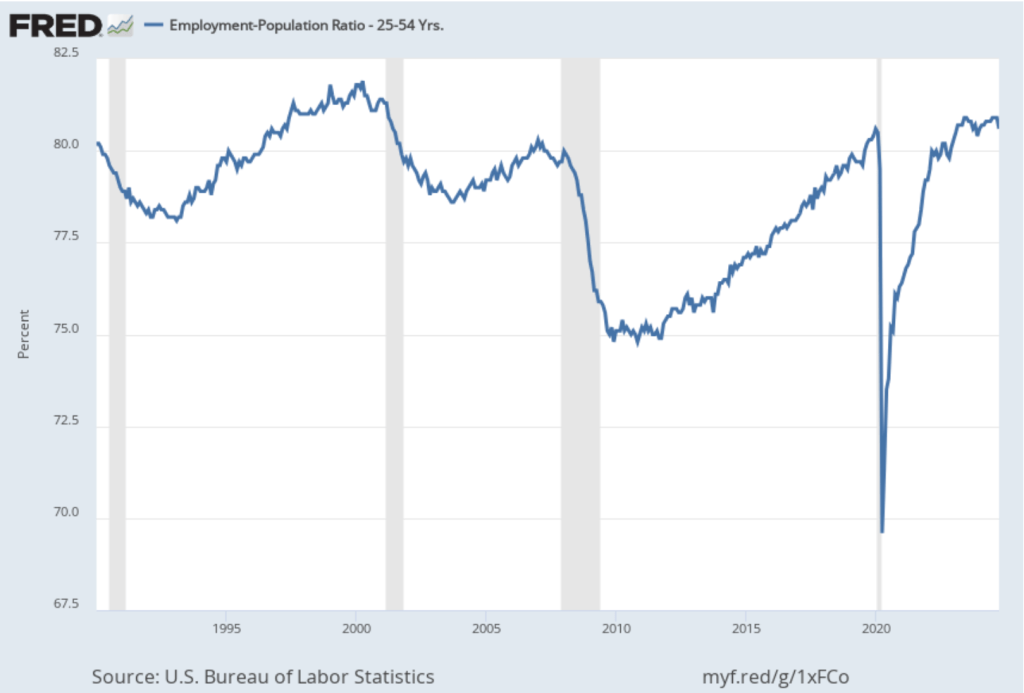
Other data in the jobs report told a more optimistic story of conditions in job market. The following figure shows the employment-population ratio for prime age workers—those aged 25 to 54. Although it declined from 80.9 percent to 80.6 percent, it remained high relative to levels seen since 2001.

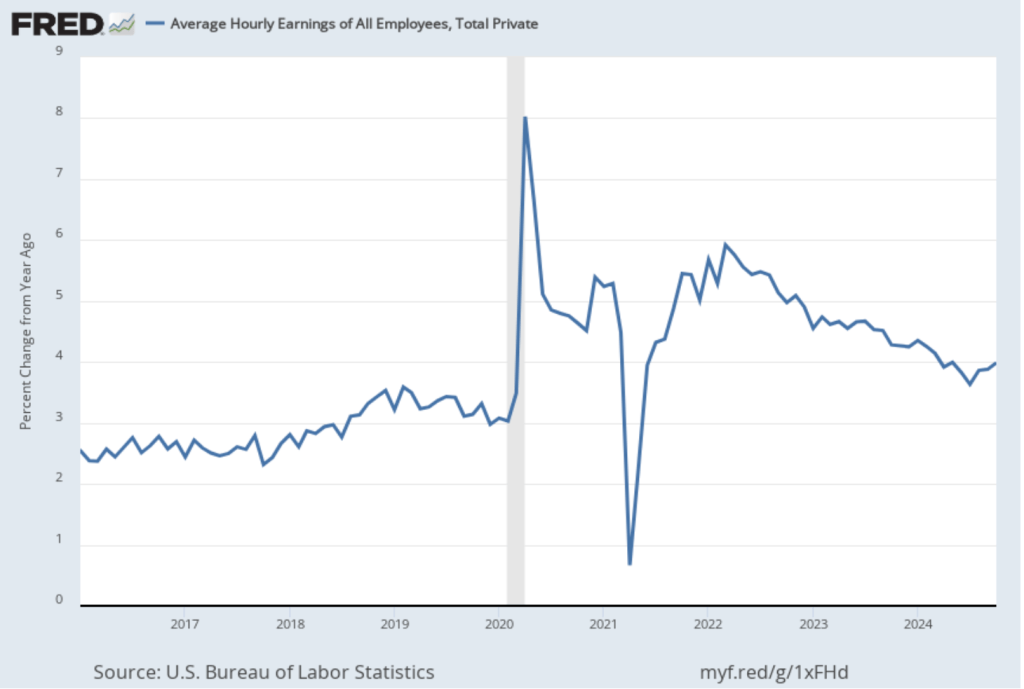
The establishment survey also includes data on average hourly earnings (AHE). As we noted in this post yesterday, many economists and policymakers believe the employment cost index (ECI) is a better measure of wage pressures in the economy than is the AHE. The AHE does have the important advantage that it is available monthly, whereas the ECI is only available quarterly. The following figure shows the percentage change in the AHE from the same month in the previous year. AHE increased 4.0 percent in October, up from a 3.9 percent increase in September.

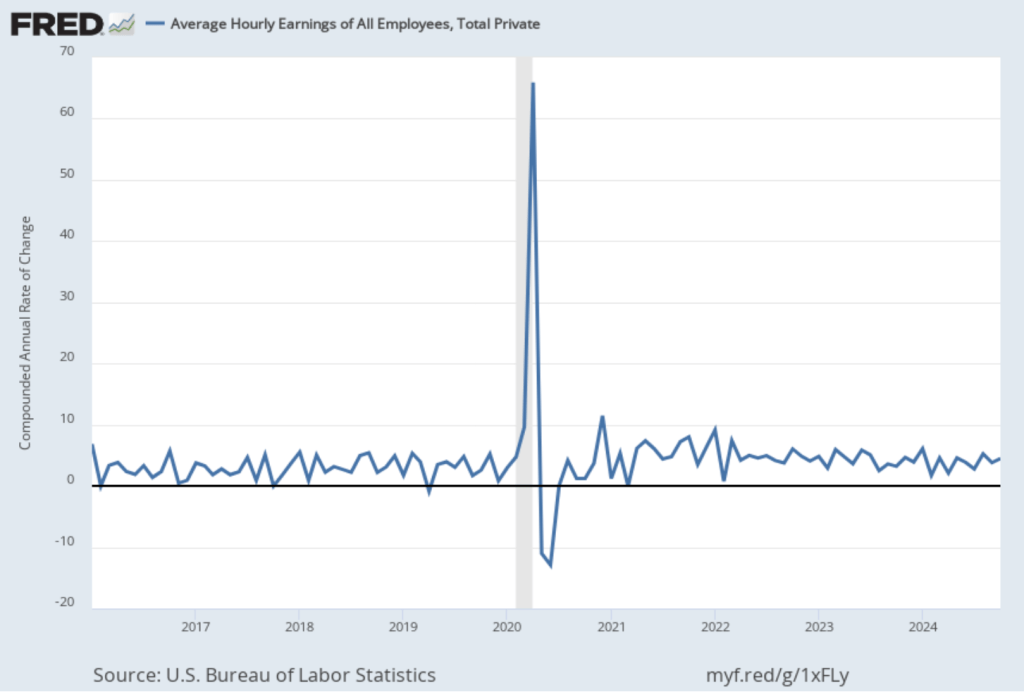
The following figure shows wage inflation calculated by compounding the current month’s rate over an entire year. (The figure above shows what is sometimes called 12-month wage inflation, whereas this figure shows 1-month wage inflation.) One-month wage inflation is much more volatile than 12-month wage inflation—note the very large swings in 1-month wage inflation in April and May 2020 during the business closures caused by the Covid pandemic.

The October 1-month rate of wage inflation was 4.5 percent, an increase from the 3.8 percent rate in September. Whether measured as a 12-month increase or as a 1-month increase, AHE is increasing more rapidly than is consistent with the Fed achieving its 2 percent target rate of price inflation.

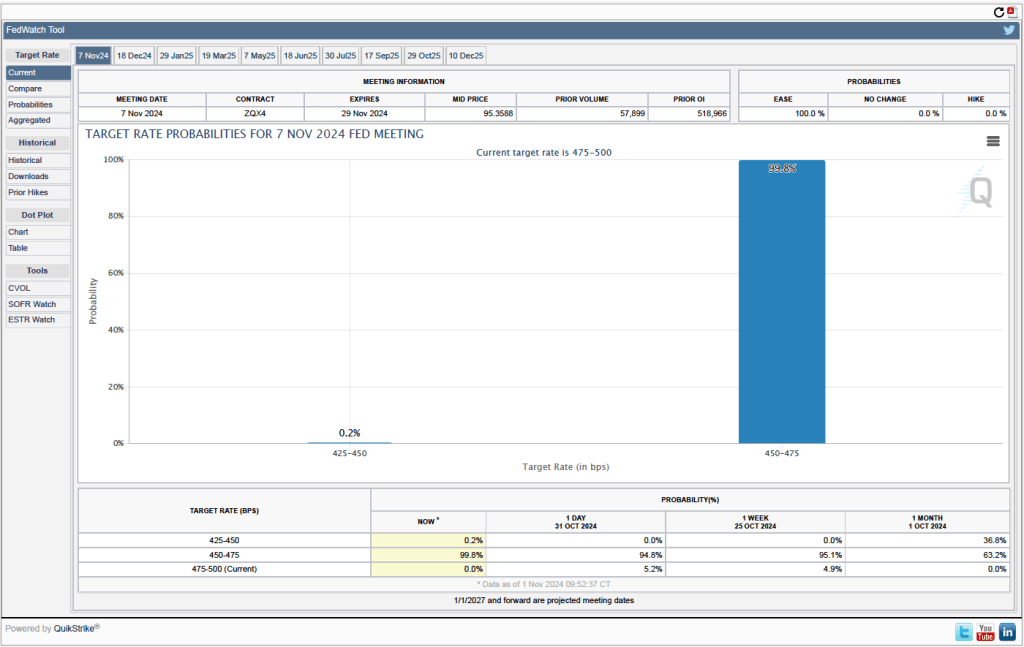
The Federal Reserve’s policy-making Federal Open Market Committee (FOMC) has its next meeting on November 6-7. What effect will this jobs report likely have on the committee’s actions at that meeting? One indication of expectations of future rate cuts comes from investors who buy and sell federal funds futures contracts. (We discuss the futures market for federal funds in this blog post.) As shown in the following figure, today these investors assign a probability of 99.8 percent to the FOMC cutting its target for the federal funds rate by 0.25 percentage point (25 basis points) at its next meeting. Investors see effectively no chance of the committee leaving its target range unchanged at the current 4.75 percent to 5.00 percent or of the committee cutting its target rate by 50 basis point cut.

Investors don’t appear to believe that the acceleration in wage growth indicated by today’s jobs report will cause the FOMC to pause its rate cutting. Nor do they appear to believe that the unexpectedly small increase in payroll employment will cause the committee to cut its target for the federal funds rate by 50 basis points.