Image generated by GTP-4o
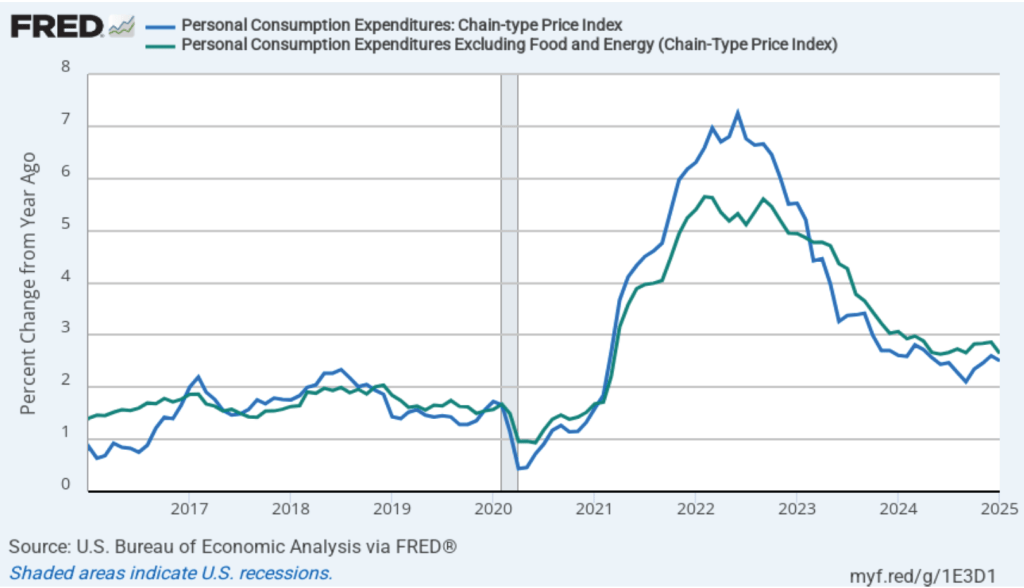
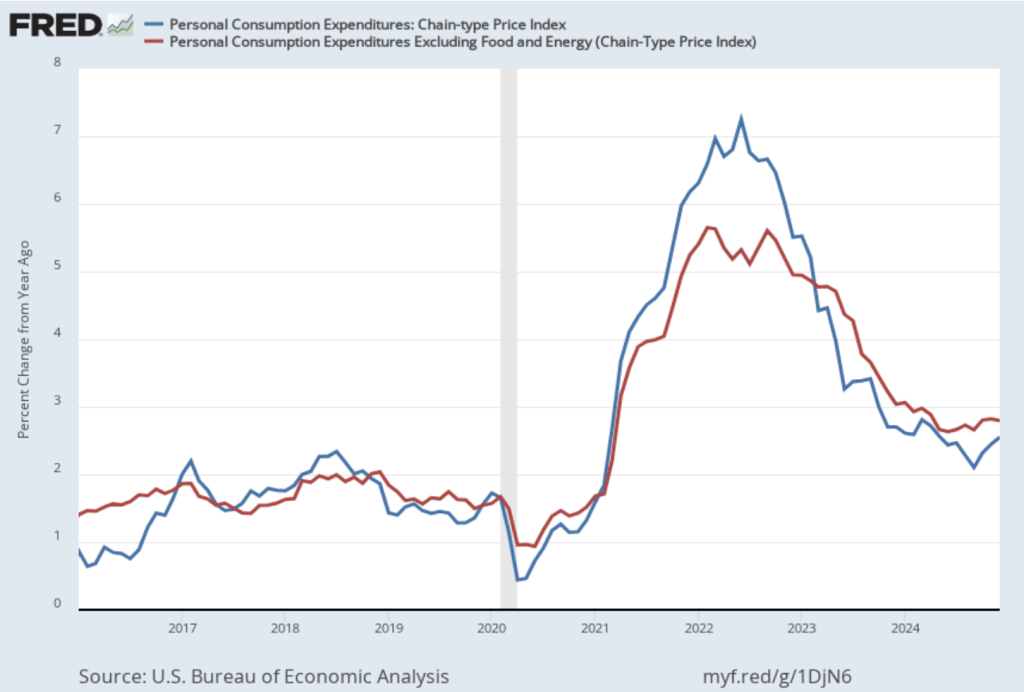
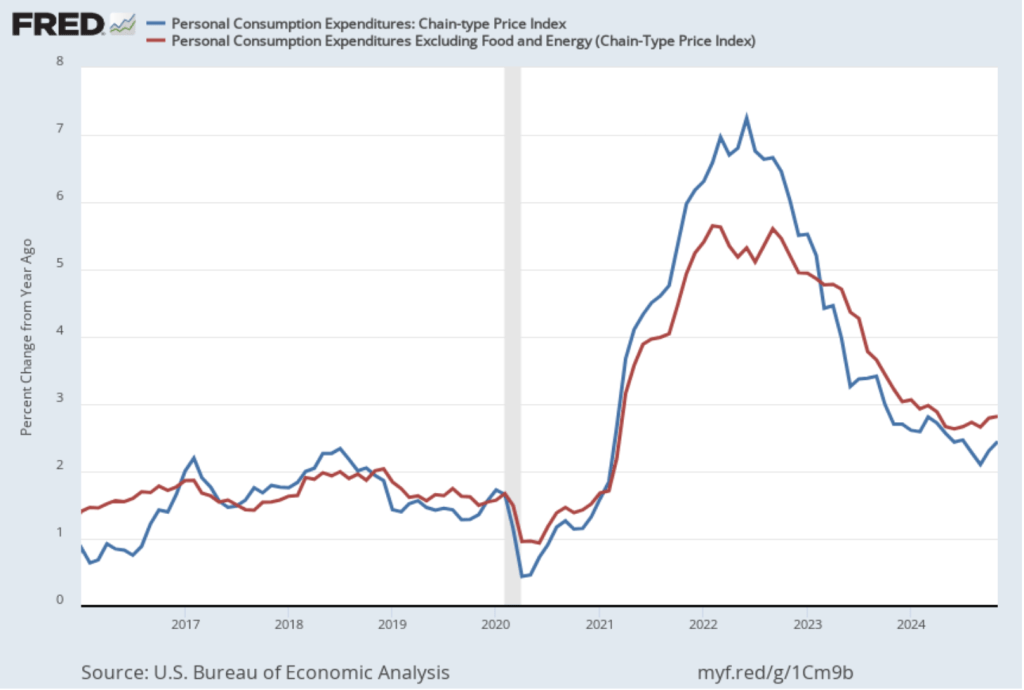
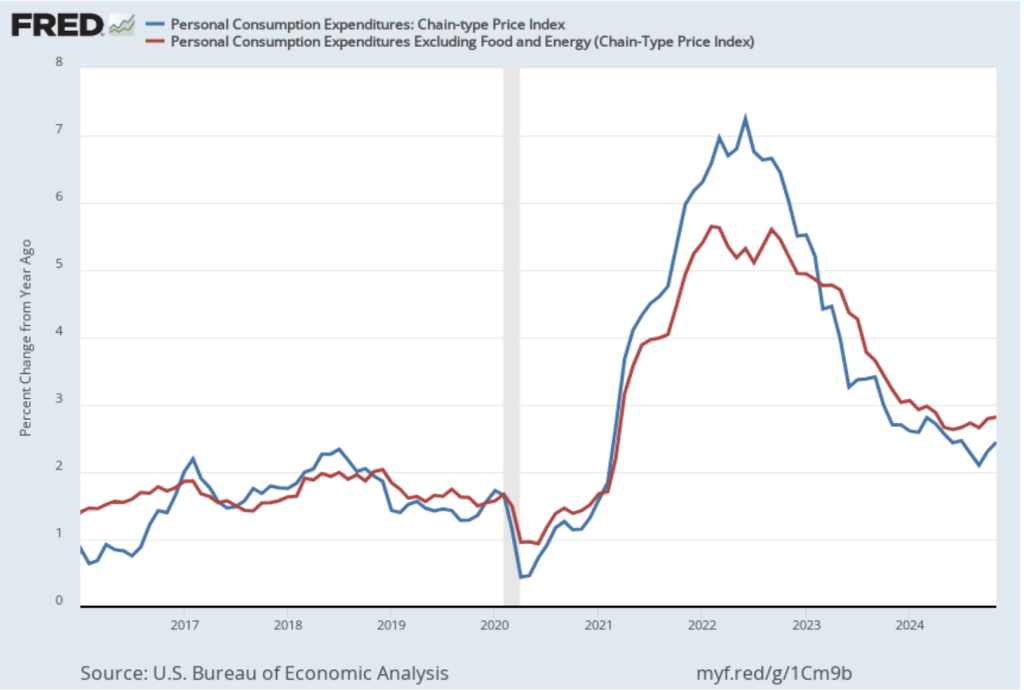
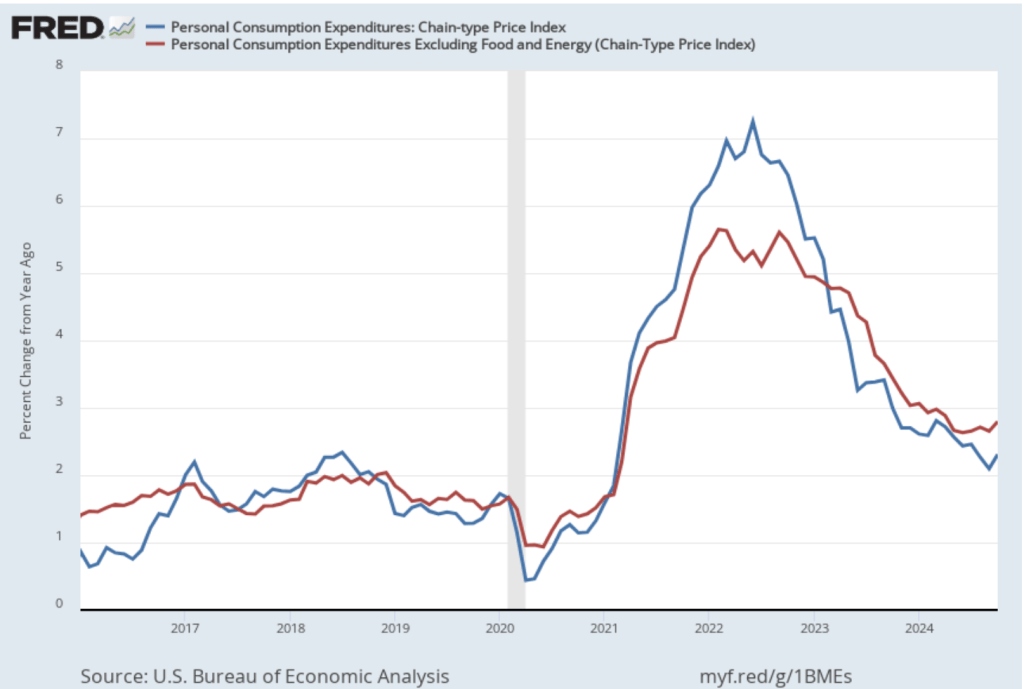
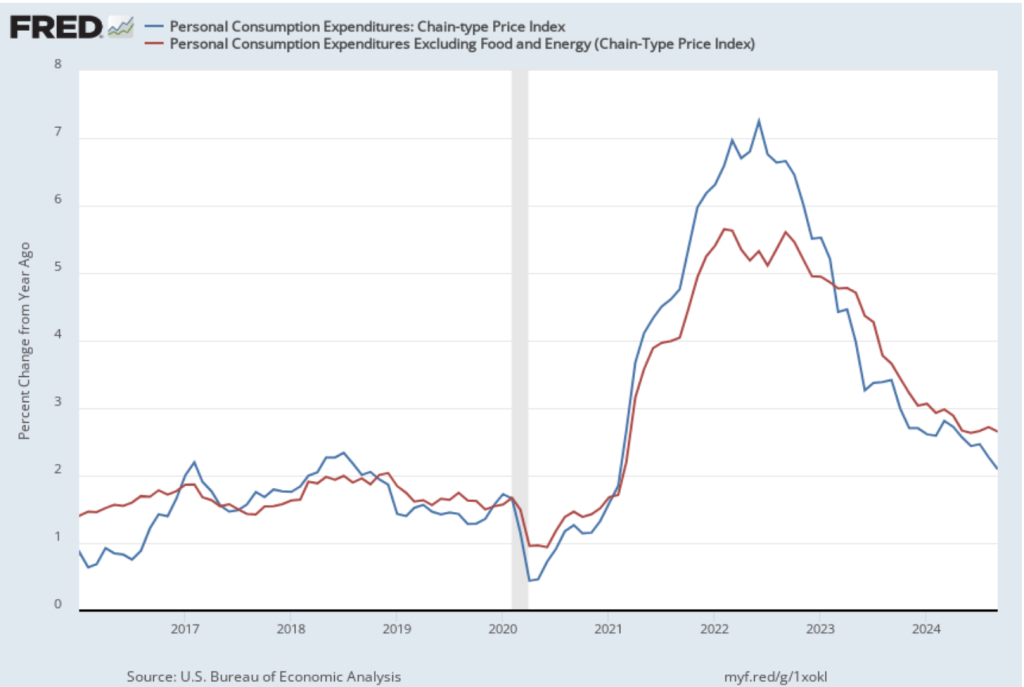
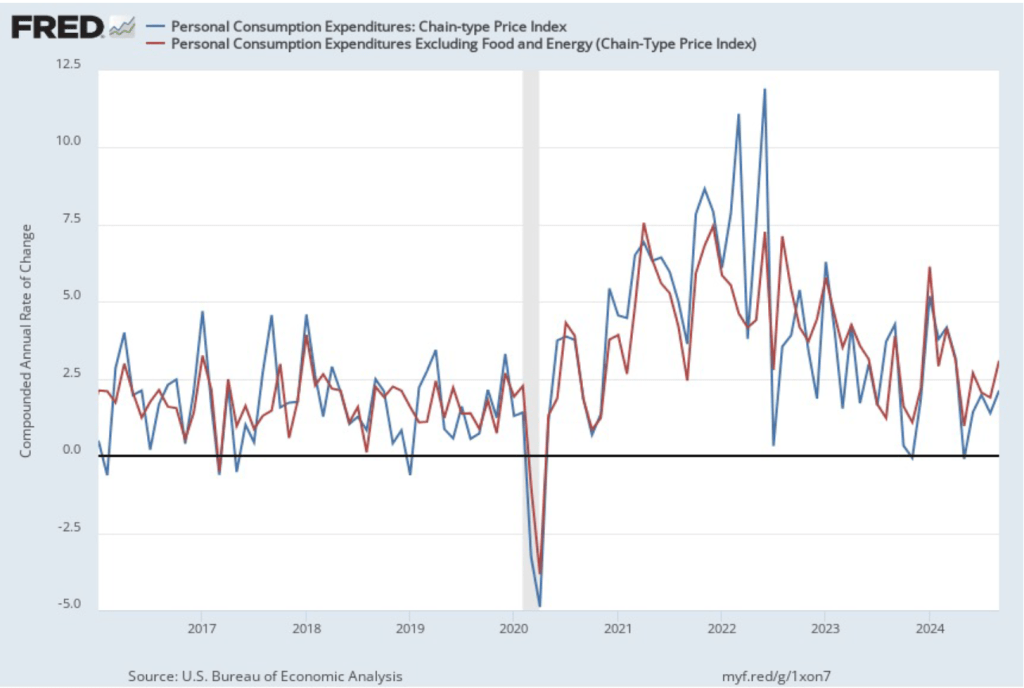
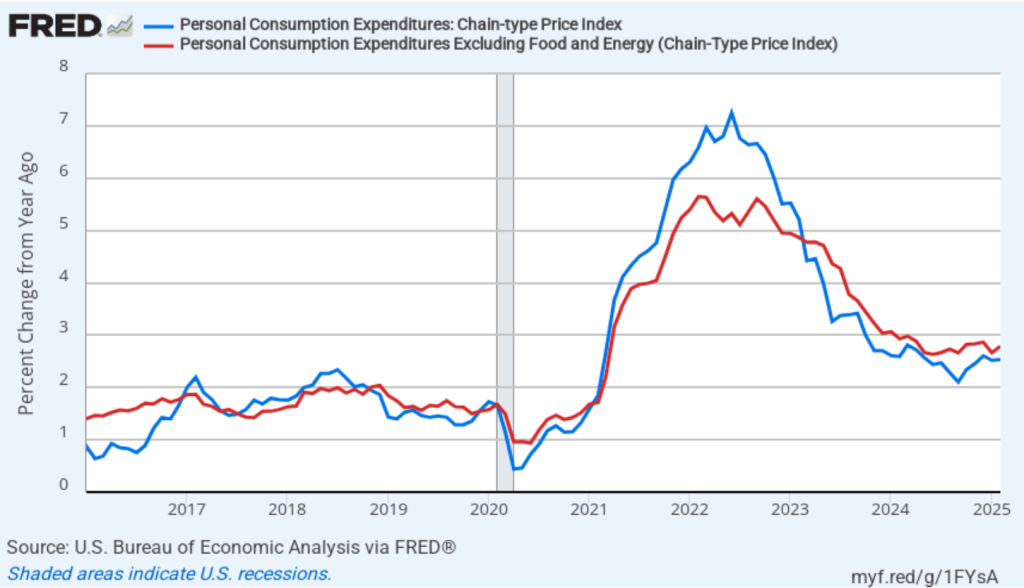
Today (March 28), the BEA released monthly data on the personal consumption expenditures (PCE) price index as part of its “Personal Income and Outlays” report. The Fed relies on annual changes in the PCE price index to evaluate whether it’s meeting its 2 percent annual inflation target. The following figure shows PCE inflation (the blue line) and core PCE inflation (the red line)—which excludes energy and food prices—for the period since January 2016 with inflation measured as the percentage change in the PCE from the same month in the previous year. In February, PCE inflation was 2.5 percent, unchanged since January. Core PCE inflation in January was 2.8 percent, up slightly from 2.7 percent in January. Headline PCE inflation was consistent with the forecasts of economists, but core PCE inflation was higher.
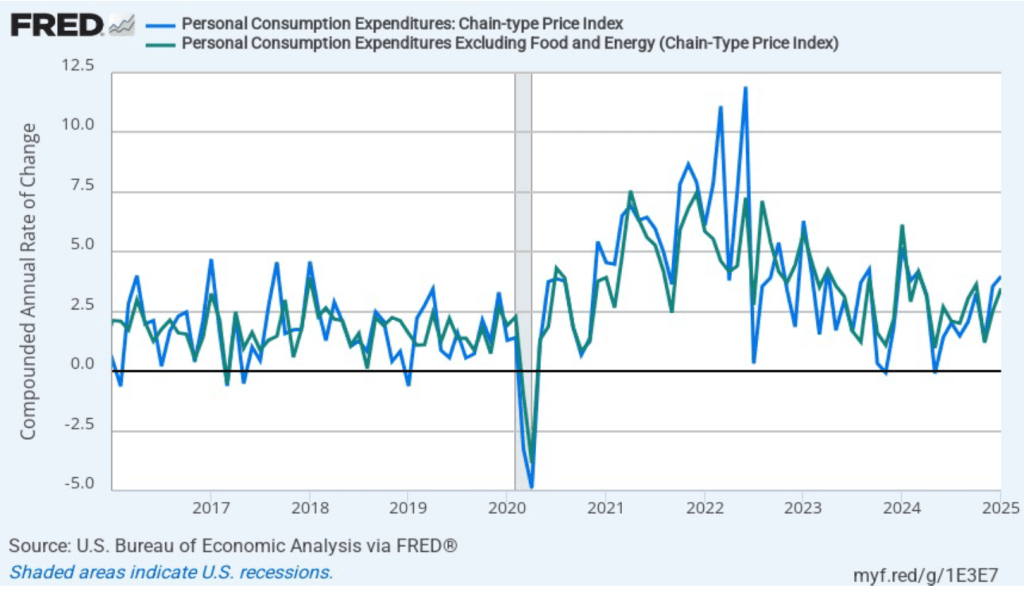
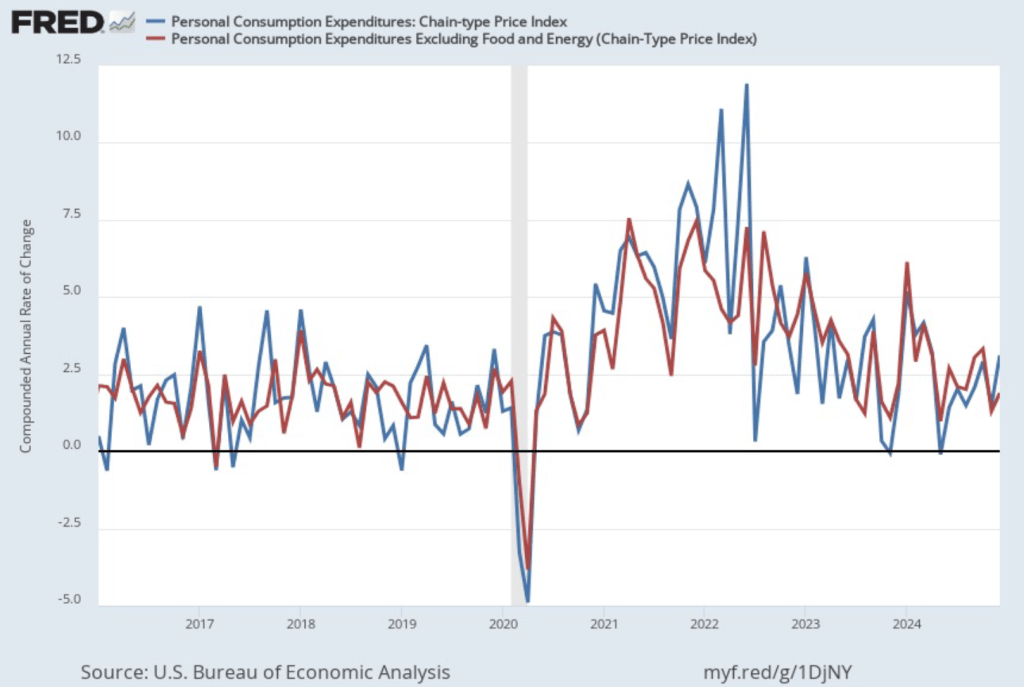
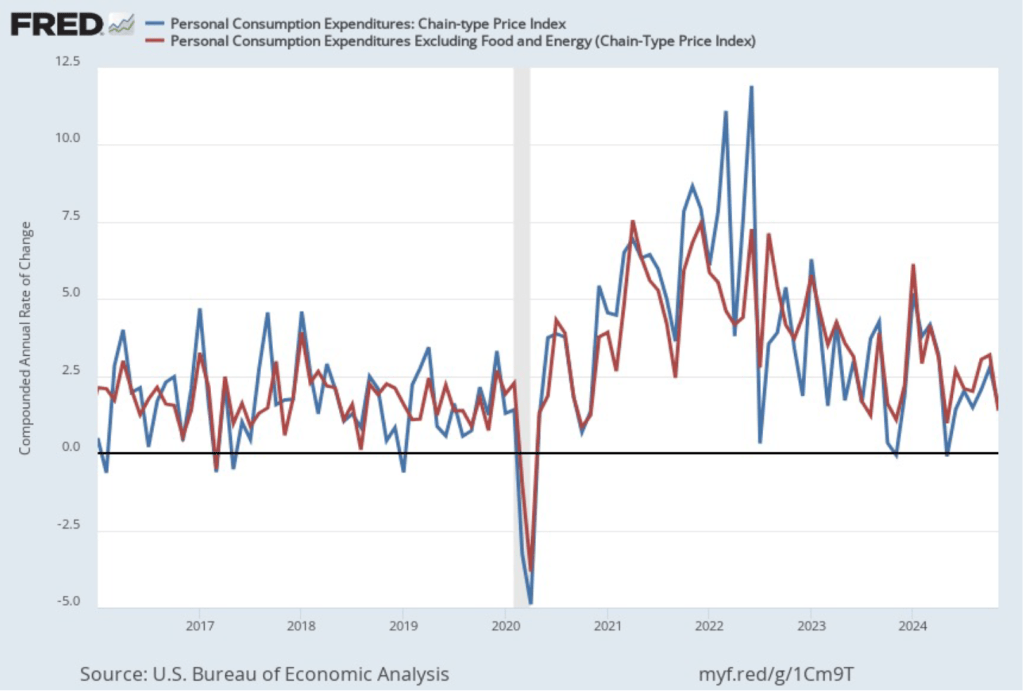
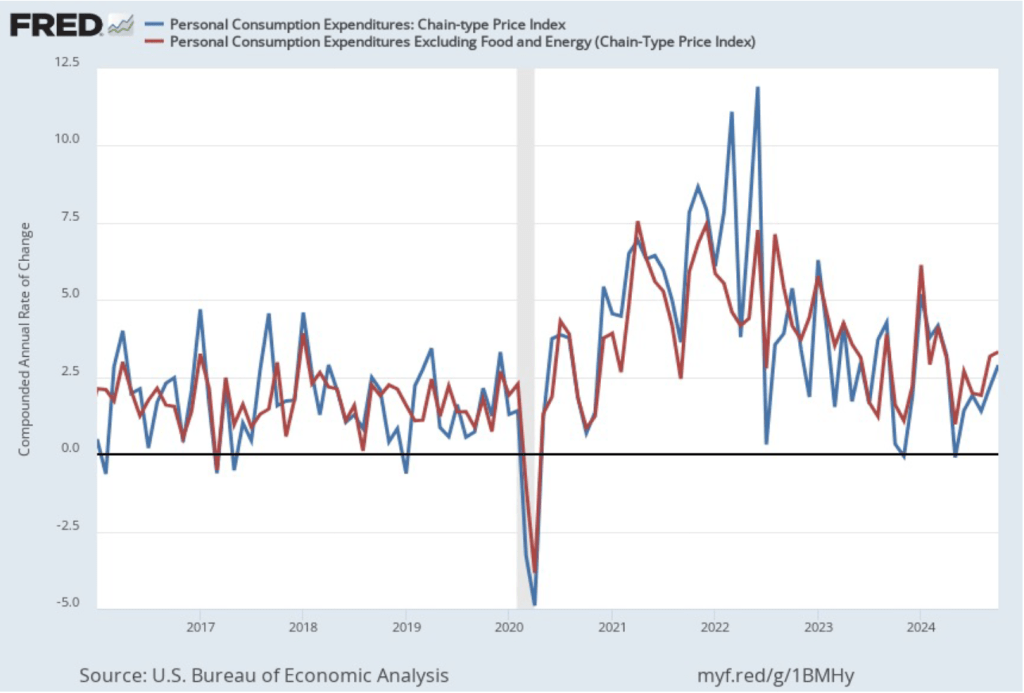
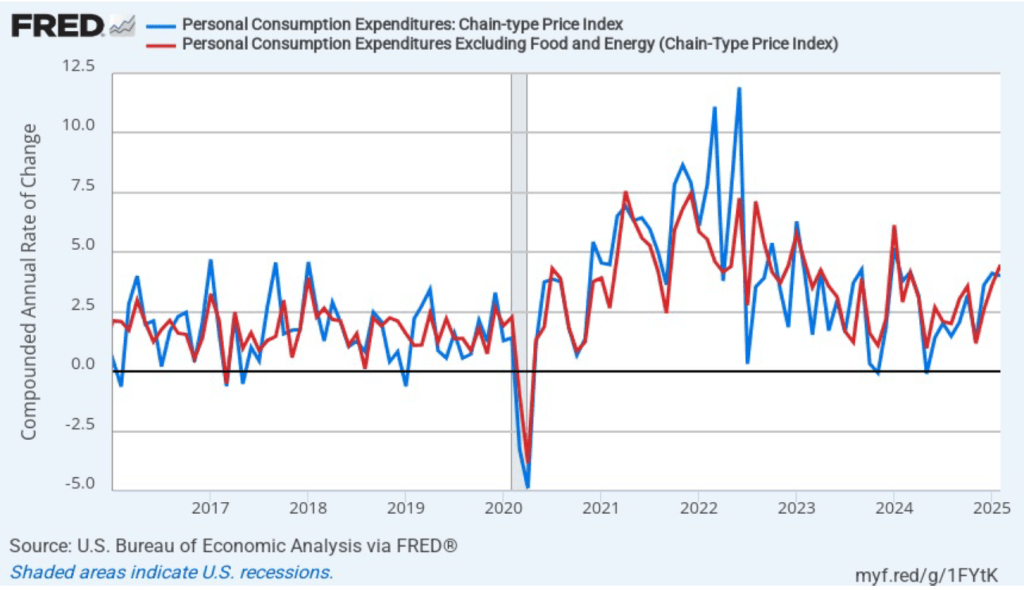
The following figure shows PCE inflation and core PCE inflation calculated by compounding the current month’s rate over an entire year. (The figure above shows what is sometimes called 12-month inflation, while this figure shows 1-month inflation.) Measured this way, PCE inflation declined slightly in February to 4.0 percent from 4.1 percent in January. Core PCE inflation jumped in February to 4.5 percent from 3.6 percent in January. So, both 1-month PCE inflation estimates are running well above the Fed’s 2 percent target. The usual caution applies that 1-month inflation figures are volatile (as can be seen in the figure), so we shouldn’t attempt to draw wider conclusions from one month’s data. But it is definitely concerning that 1-month inflation has risen each month since November 2024.
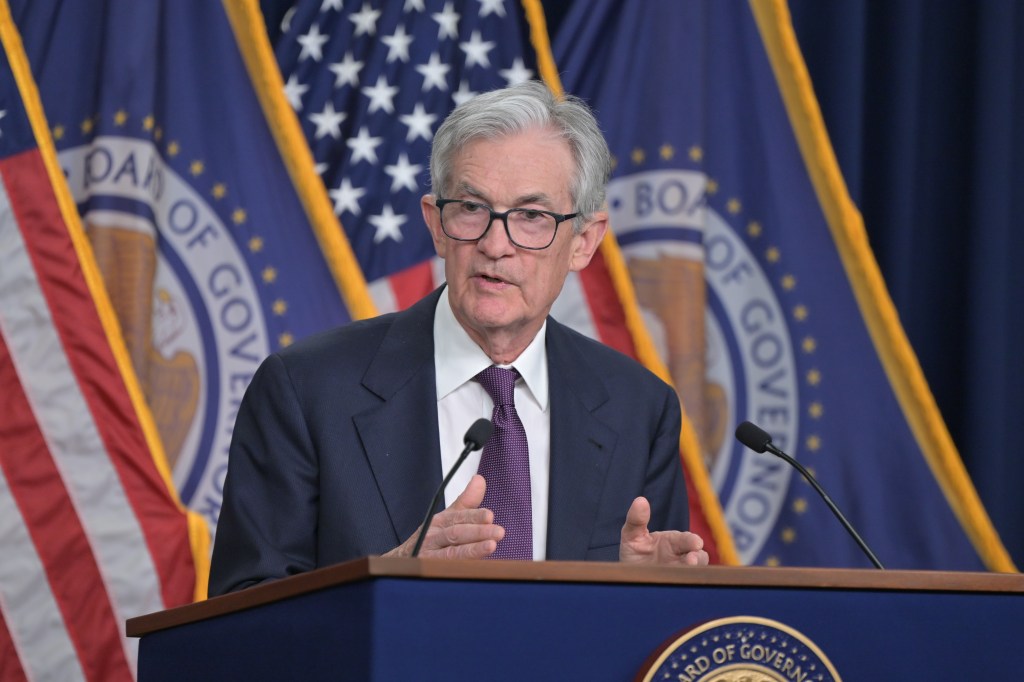
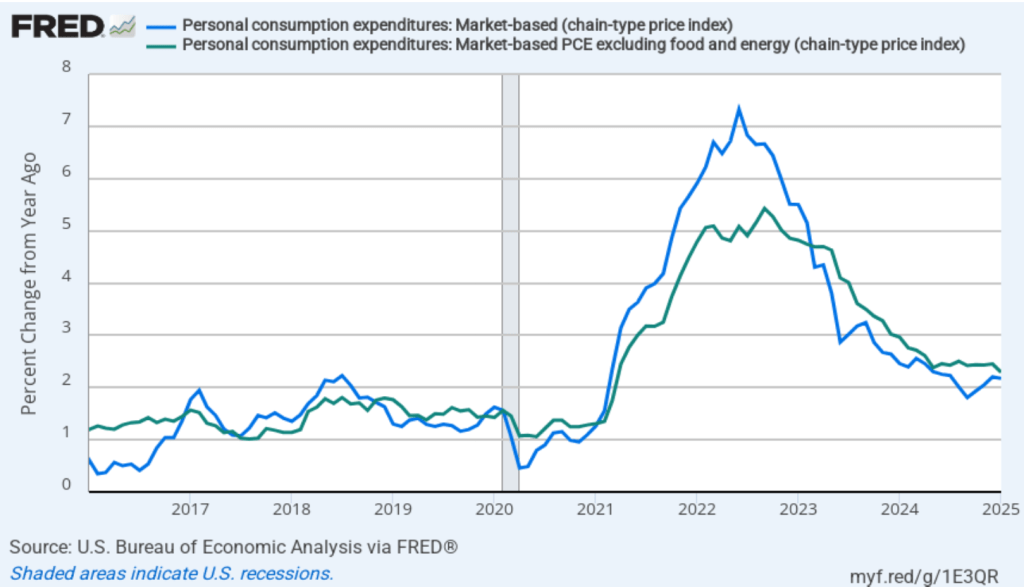
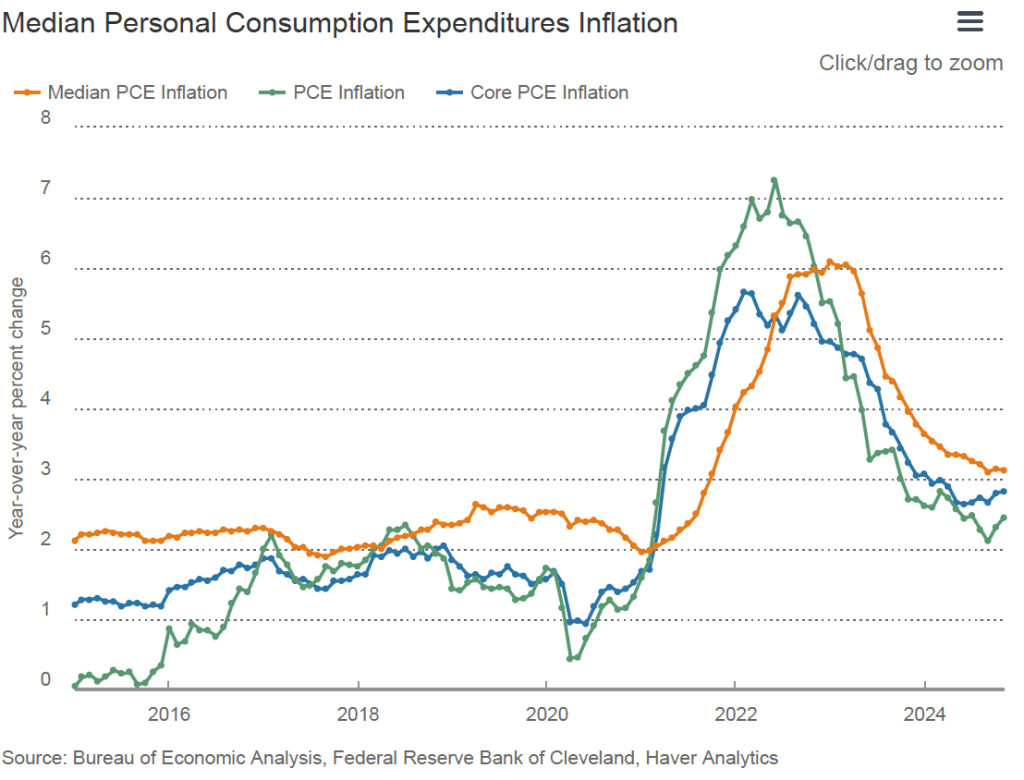
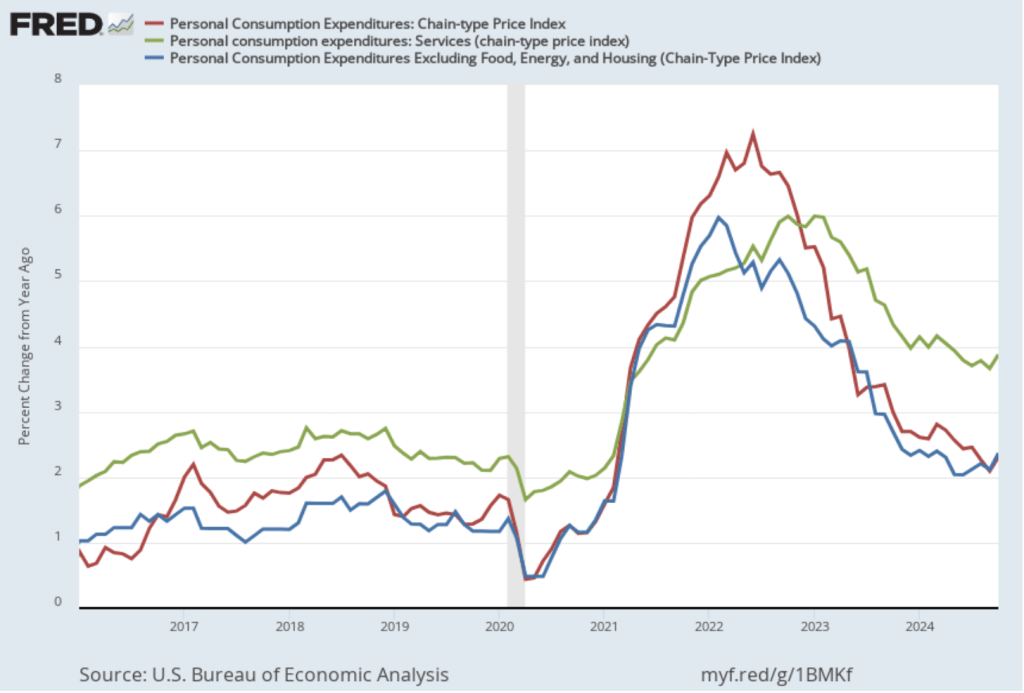
Fed Chair Jerome Powell has noted that inflation in non-market services has been high. Non-market services are services whose prices the BEA imputes rather than measures directly. For instance, the BEA assumes that prices of financial services—such as brokerage fees—vary with the prices of financial assets. So that if stock prices fall, the prices of financial services included in the PCE price index also fall. Powell has argued that these imputed prices “don’t really tell us much about … tightness in the economy. They don’t really reflect that.” The following figure shows 12-month headline inflation (the blue line) and 12-month core inflation (the green line) for market-based PCE. (The BEA explains the market-based PCE measure here.)
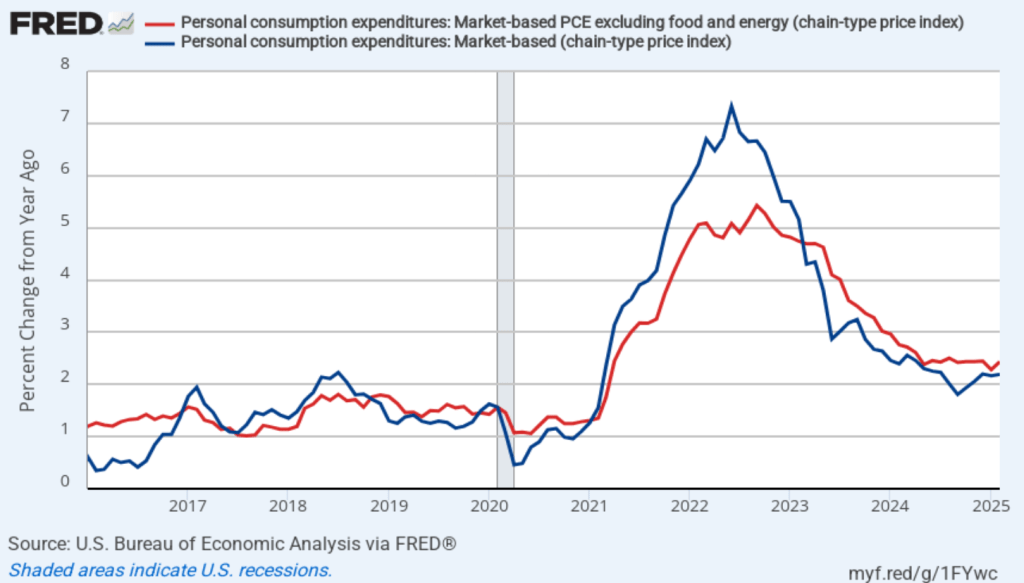
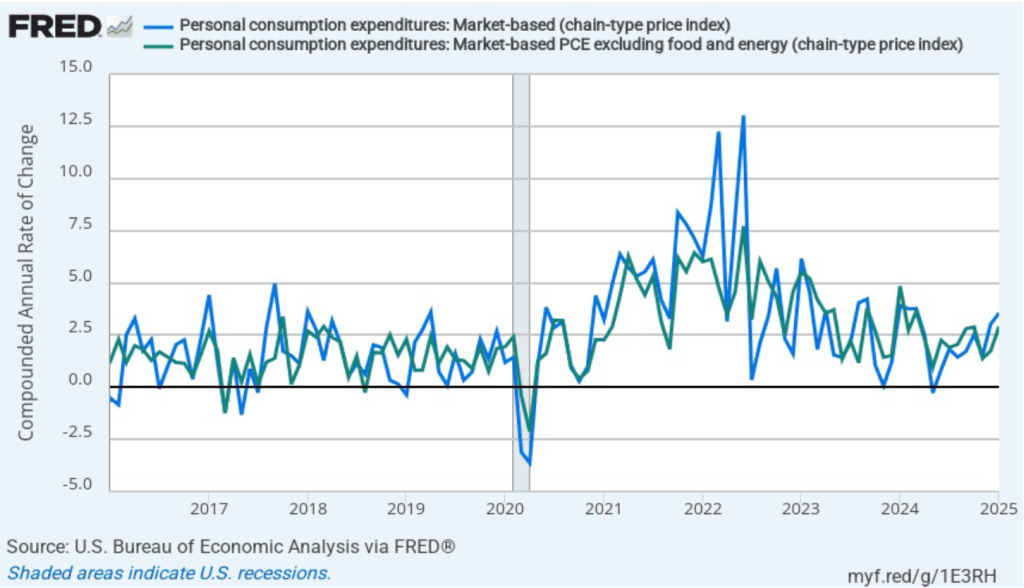
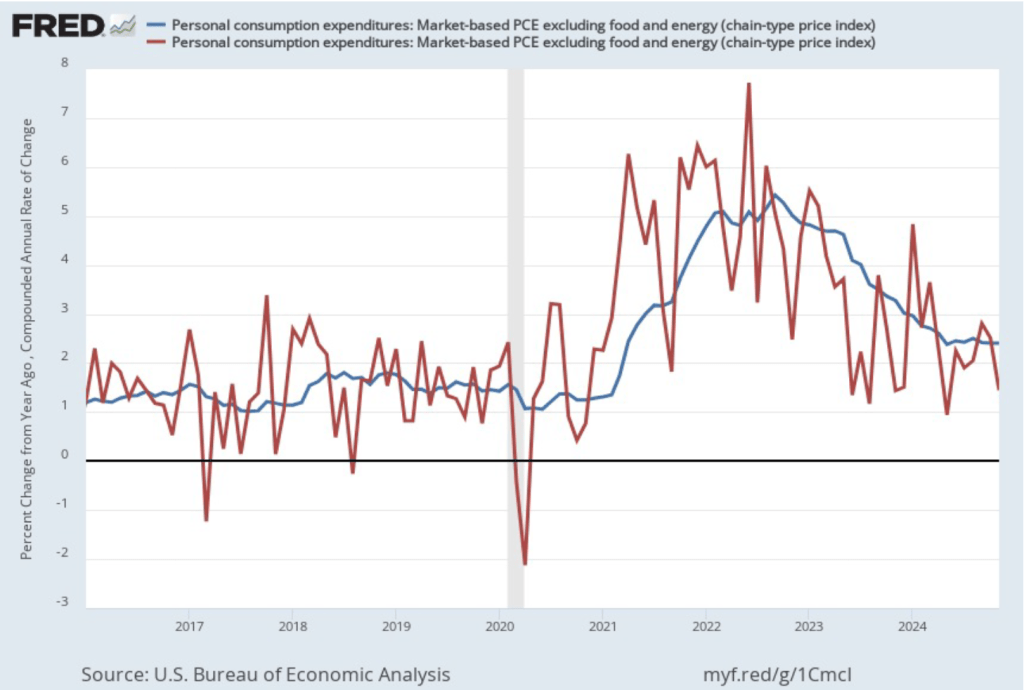
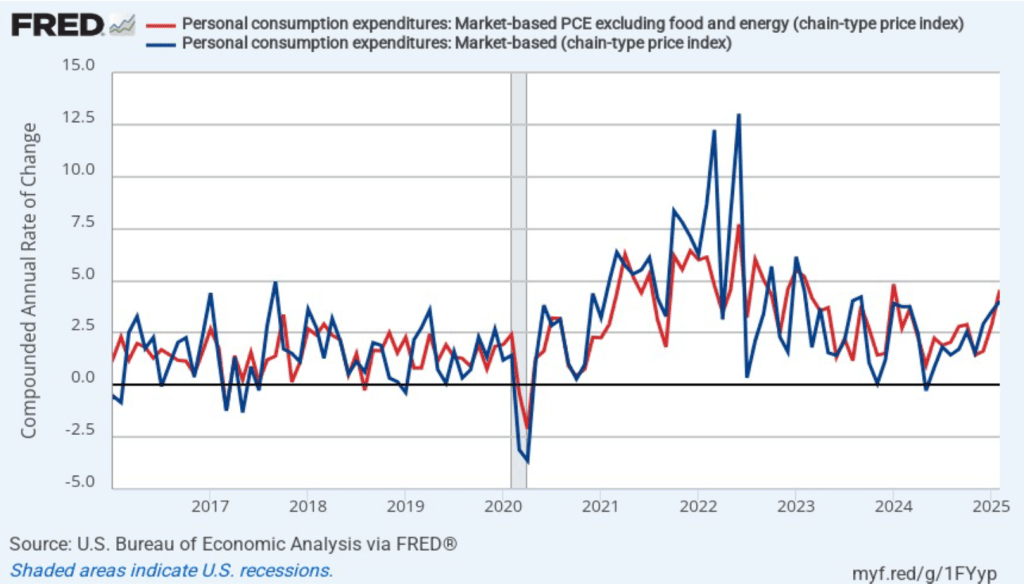
Headline market-based PCE inflation was 2.2 percent in February, and core market-based PCE inflation was 2.4 percent. So, both market-based measures show less inflation in February than do the total measures. In the following figure, we look at 1-month inflation using these measures. The 1-month inflation rates are both very high. Headline market-based inflation was 4.0 percent in February, up from 3.5 percent in January. Core market-based inflation was 4.6 percent in February, up from 2.8 percent in January. Both 1-month market-based inflation members have increased each month since November.
In summary, today’s data don’t show any evidence that inflation is returning to the Fed’s 2 percent annual target. It has to concern the Fed that the 1-month inflation measures have been increasing since November with the latest data showing inflation running far above the Fed’s target. The Fed’s goal of a “soft landing”—with inflation returning to the Fed’s 2 percent target without the economy entering a recession—no longer appears to be on the horizon. The current data seem more consistent with a “no landing” scenario in which the economy avoids a recession but inflation doesn’t return to the Fed’s target. As a result, it seems very unlikely that the Fed’s policymaking Federal Open Market Committee (FOMC) will lower its target for the federal funds rate at its next meeting on May 6-7, unless the unemployment rate jumps or the growth of output slows dramatically.
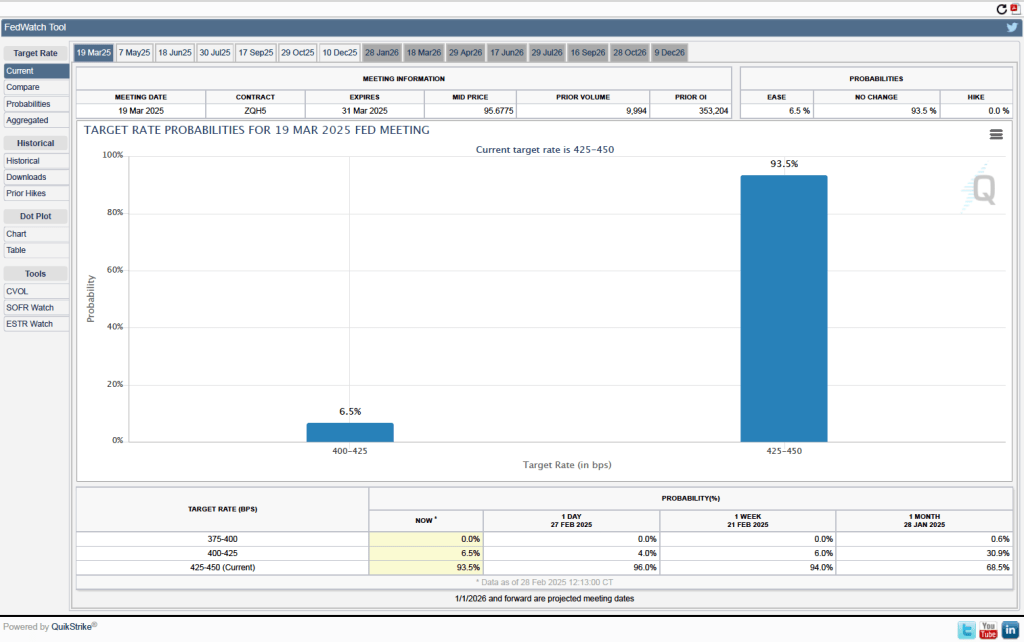
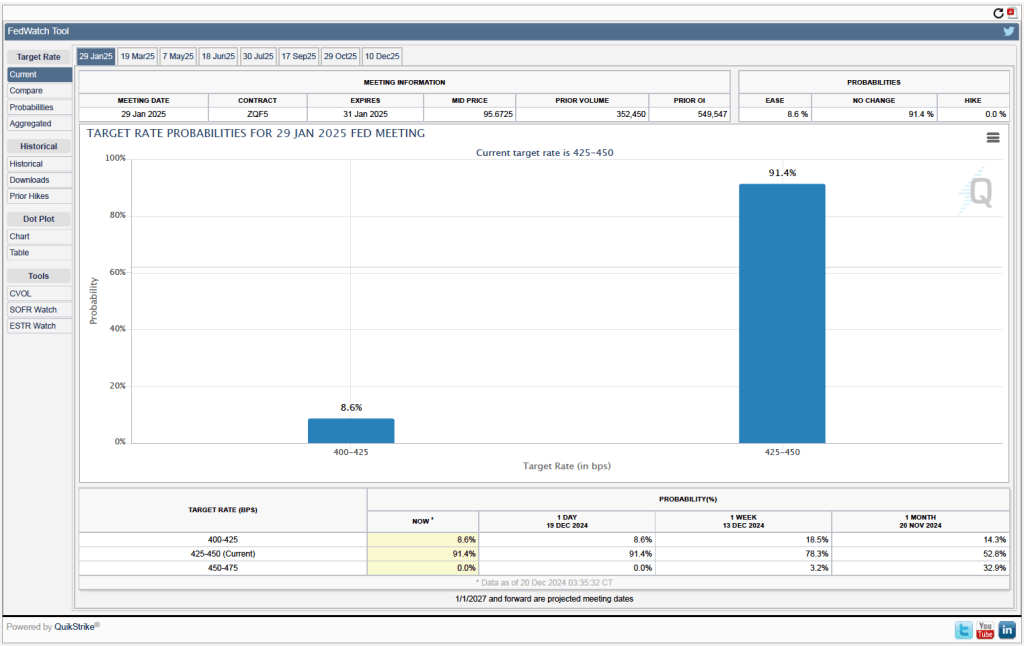
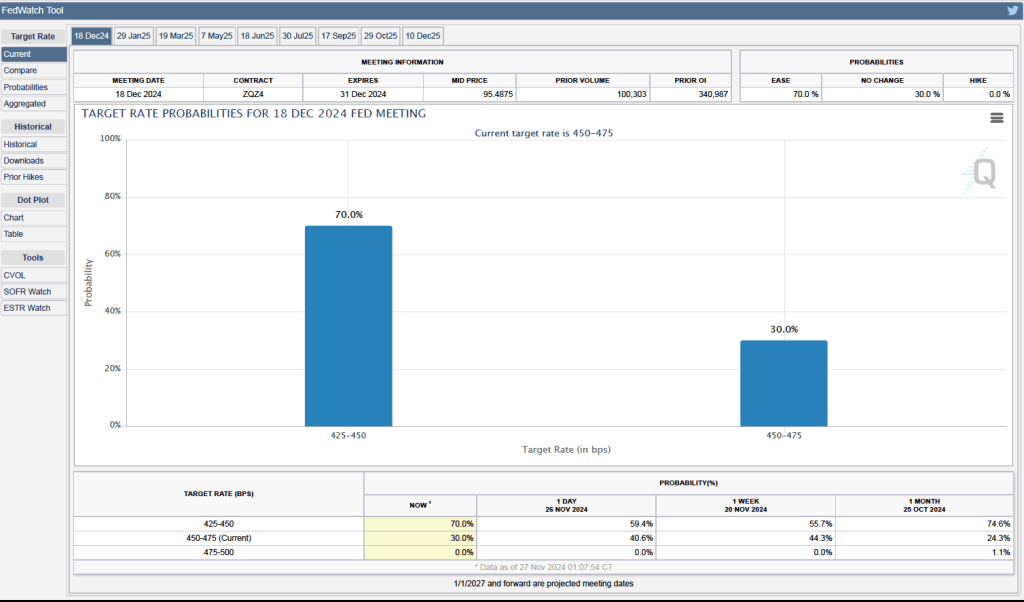
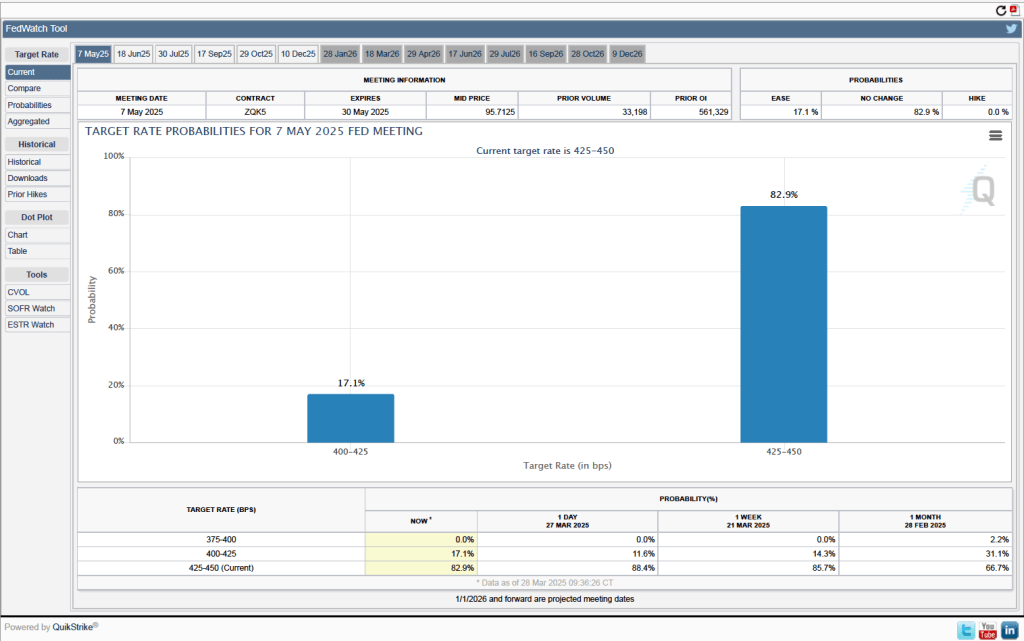
Investors who buy and sell federal funds futures contracts expect that the FOMC will leave its federal funds rate target unchanged at its next meeting. (We discuss the futures market for federal funds in this blog post.) As the following figure shows, investors assign a probability of 82.9 percent to the FOMC leaving its target for the federal funds rate unchanged at the current range of 4.25 percent to 4.50 percent. Investors assign a probability of only 17.1 percent to the FOMC cutting its target by 0.25 percentage point (25 basis points).
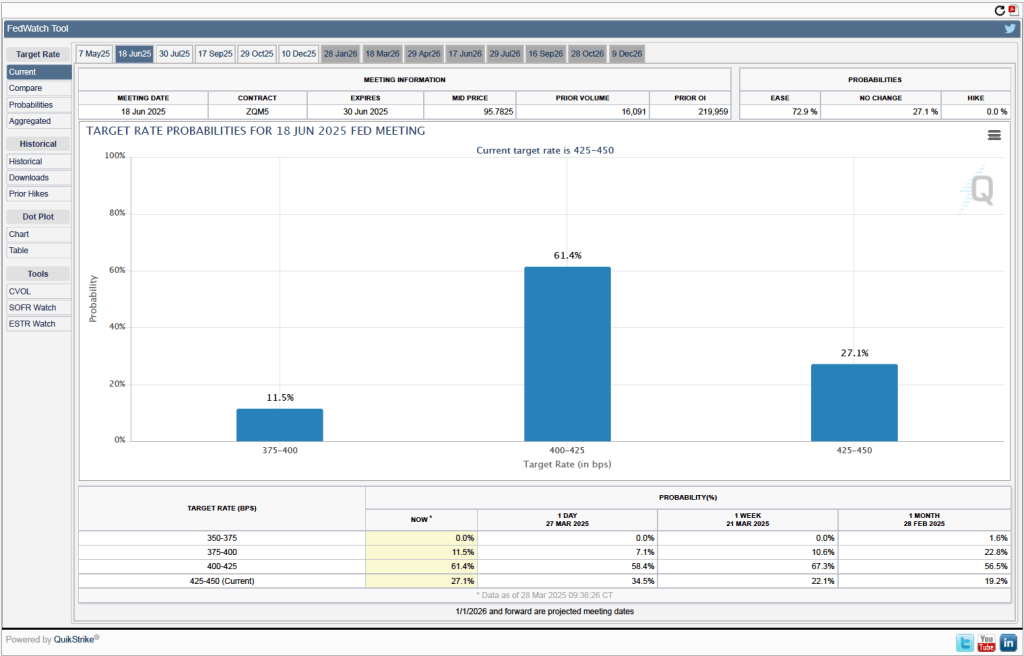
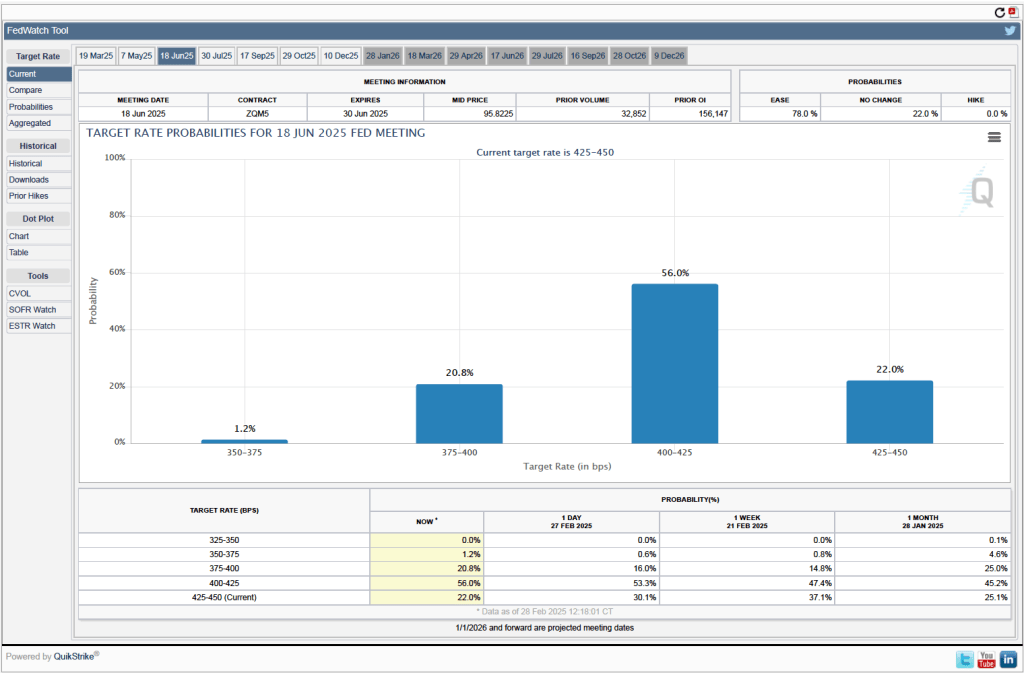
As the following figure shows, investors assign a probability of 72.9 percent percent to the FOMC cutting its target range by at least 25 basis points at its meeting on June 17–18. Despite the bad news on inflation in today’s BEA report, investors assign a zero probability to the FOMC increasing its target range for the federal funds rate to help push inflation back to the Fed’s target. One aspect of the current situation that both policymakers and investors are uncertain of is the effect of the Trump Administration’s new tariffs on the price level. It’s possible that some of the increase in inflation seen in today’s report is the result of tariff increases, but the full extent of the effect will only become evident when the tariffs are fully in place.