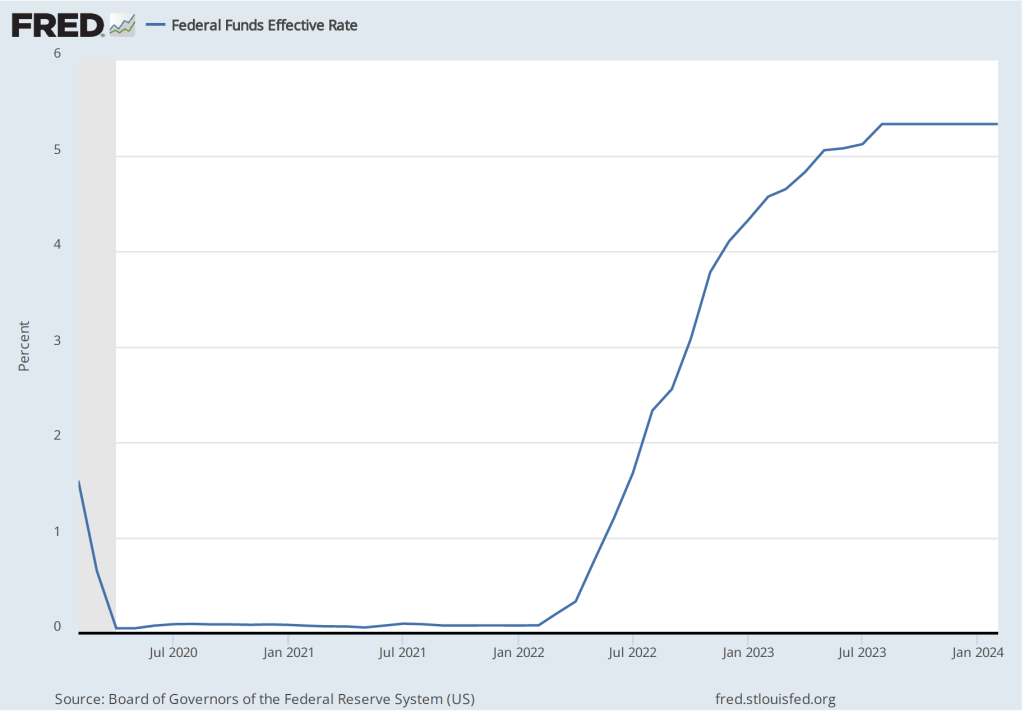
Inflation was running higher than expected during the first three months of 2024, indicating that the trend in late 2023 of declining inflation had been interrupted. At the beginning of the year, many economists and analysts had expected that the Federal Reserve’s policy-making Federal Open Market Committee (FOMC) would begin cutting its target for the federal funds rate sometime in the middle of the year. But with inflation persisting above the Fed’s 2 percent inflation target, it has become likely that the FOMC will wait until later in the year to start cutting its target and might decide to leave the target unchanged through the remainder of 2024.
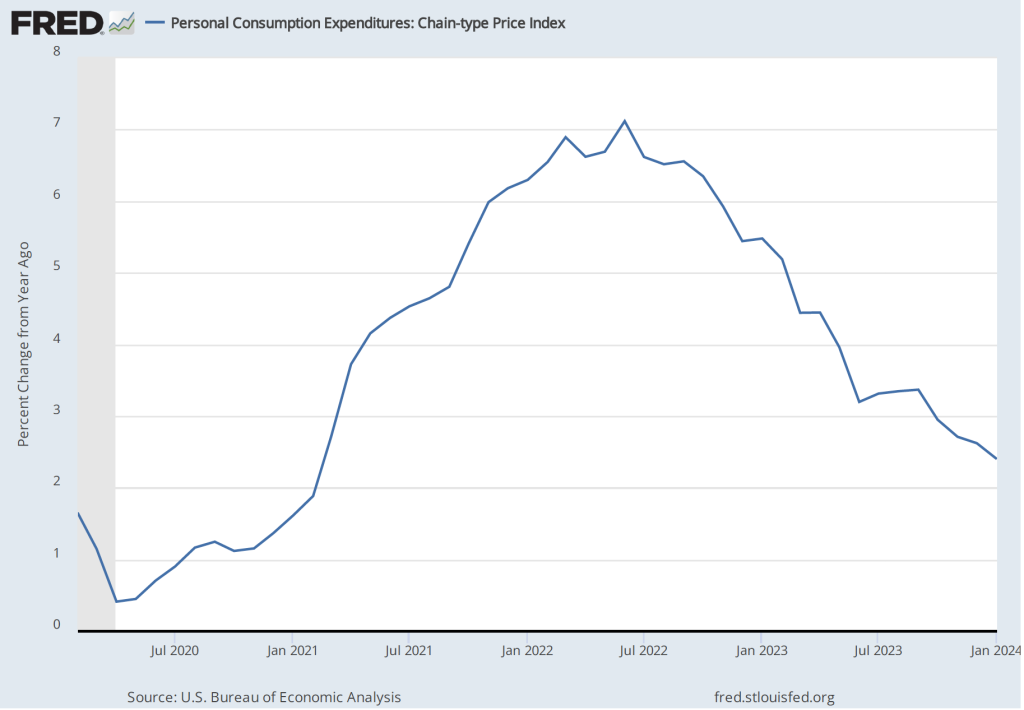
Accordingly, economists and policymakers were intently awaiting the report from the Bureau of Labor Statistics (BLS) on the consumer price index (CPI) for April. The report released this morning showed a slight decrease in inflation, although the inflation rate remains well above the Fed’s 2 percent target. (Note that, as we discuss in Macroeconomics, Chapter 15, Section 15.5 (Economics, Chapter 25, Section 25.5), the Fed uses the personal consumption expenditures (PCE) price index, rather than the CPI in evaluating whether it is hitting its 2 percent inflation target.)
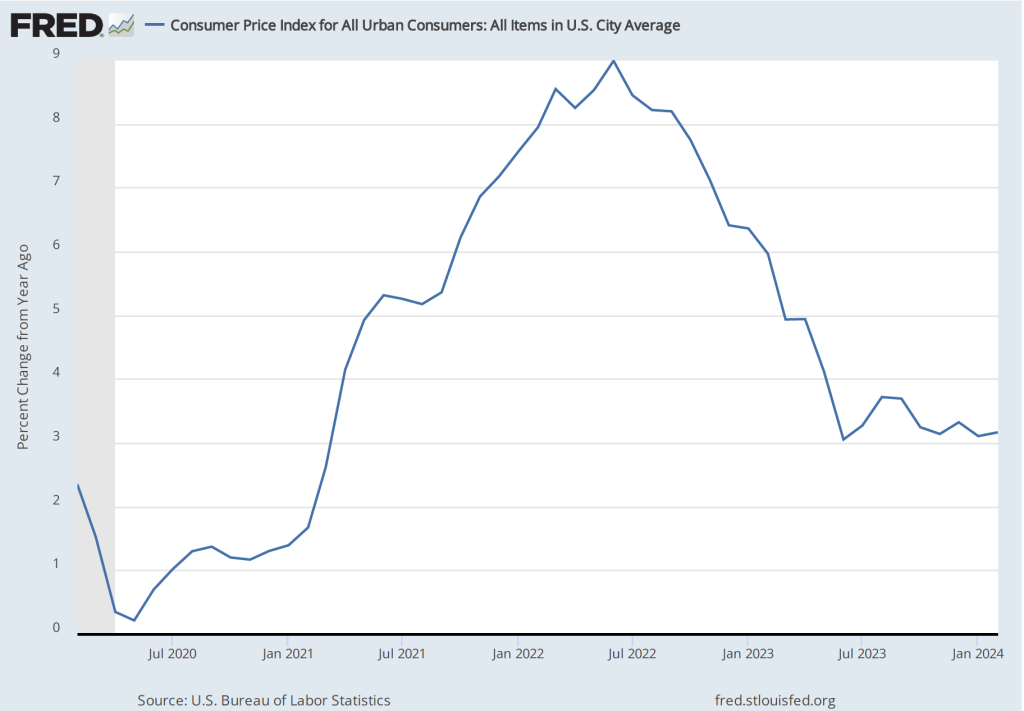
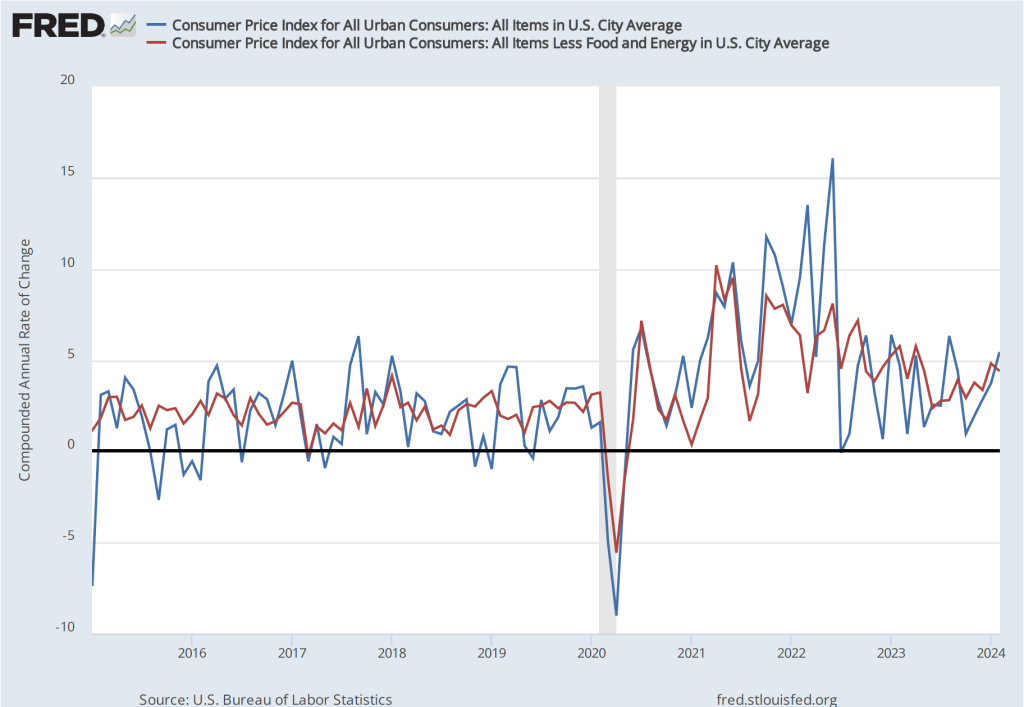
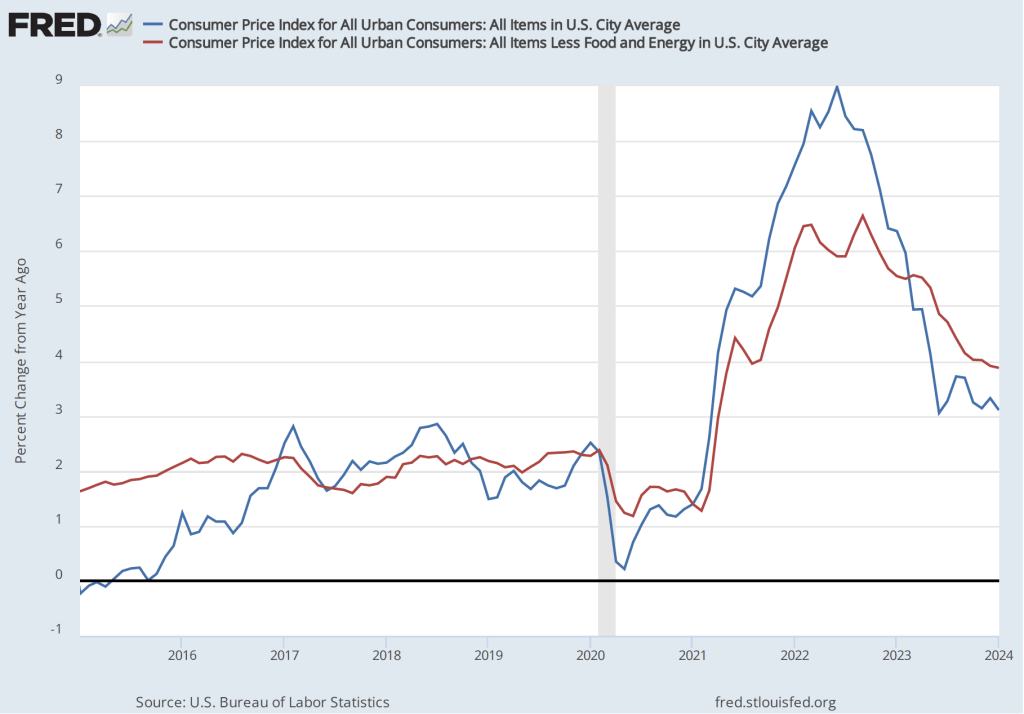
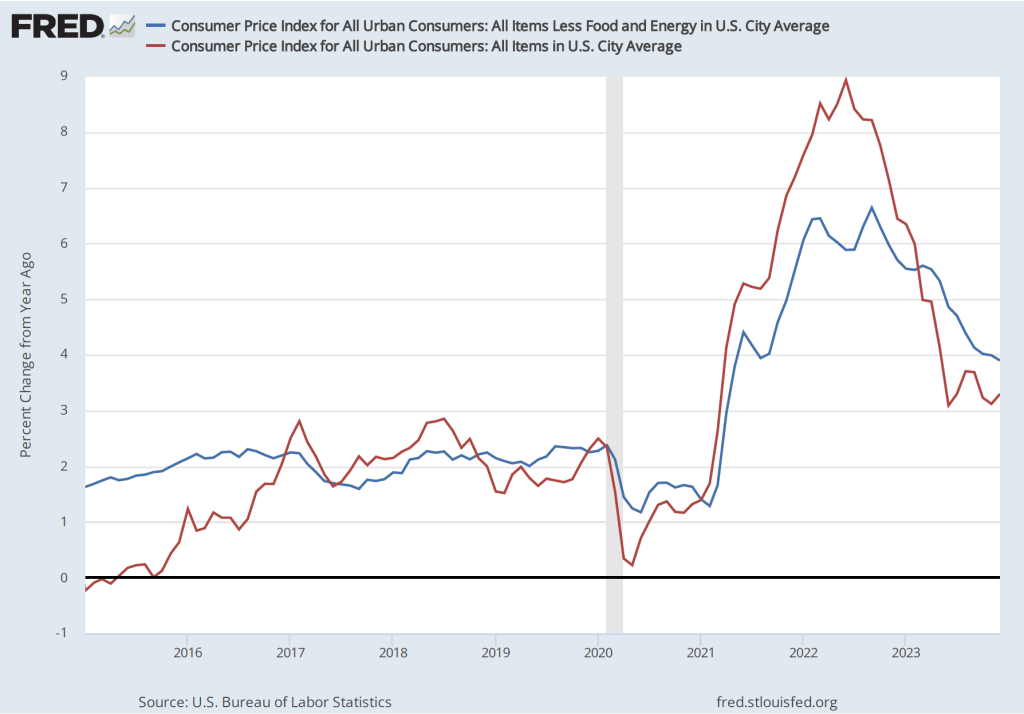
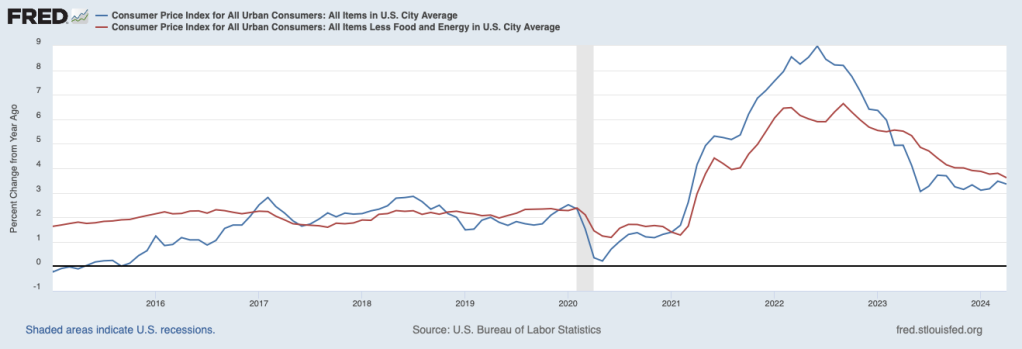
The inflation rate for April measured by the percentage change in the CPI from the same month in the previous month—headline inflation—was 3.4 percent—about the same as economists had expected—down from 3.5 percent in March. As the following figure shows, core inflation—which excludes the prices of food and energy—was 3.6 percent in April, down from 3.8 percent in March.
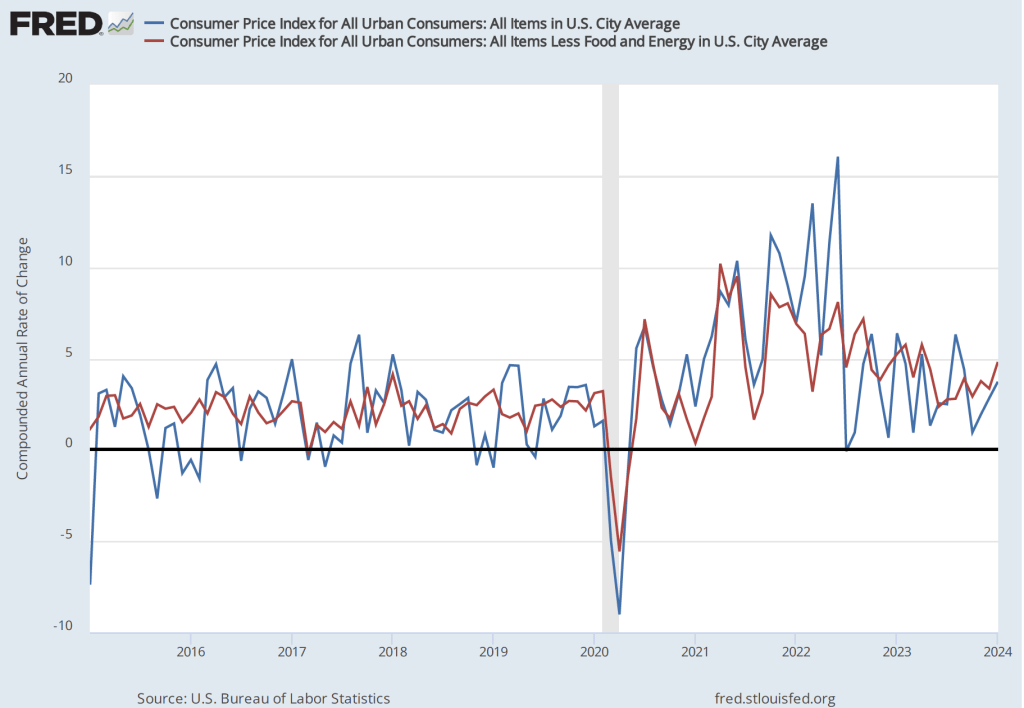
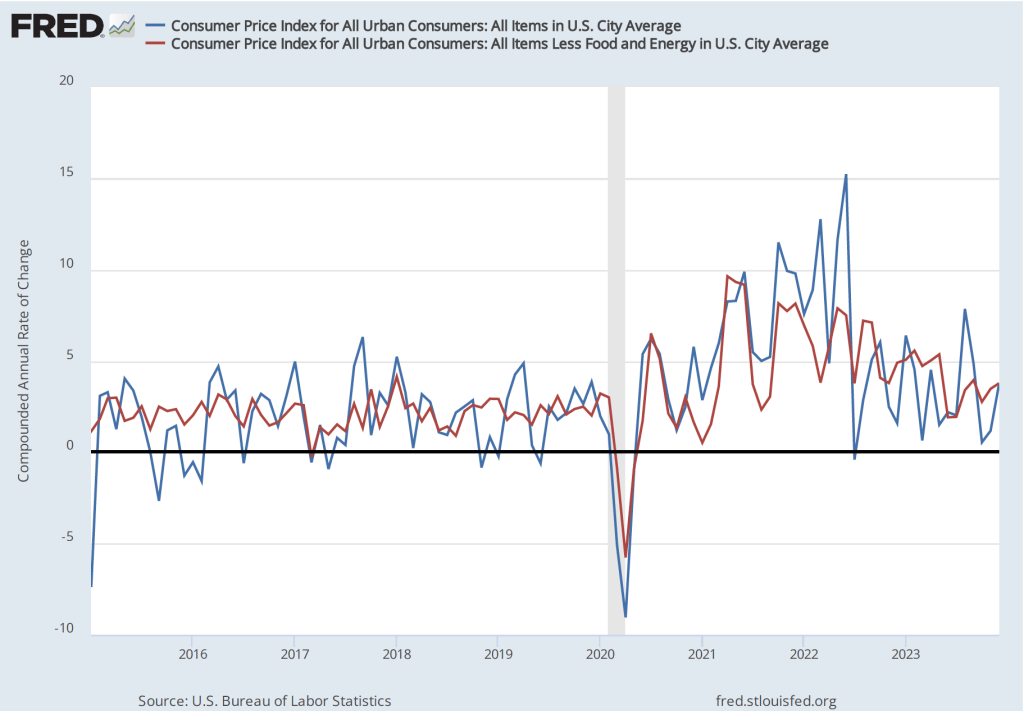
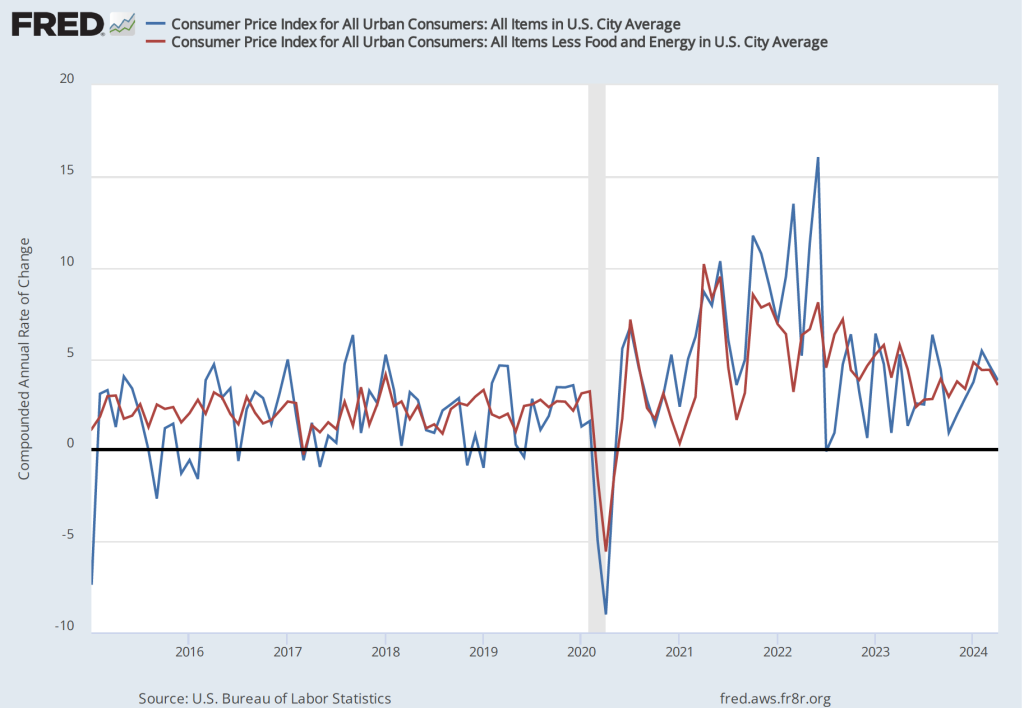
If we look at the 1-month inflation rate for headline and core inflation—that is the annual inflation rate calculated by compounding the current month’s rate over an entire year—the declines in the inflation rate are larger. Headline inflation declined from 4.6 percent in March to 3.8 percent in April. Core inflation declined from 4.4 percent in March to 3.6 percent in April. Note that the value for core inflation is the same whether we measure over 12 months or over 1 month. Overall, we can say that inflation seems to have cooled in April, but it still remains well above the Fed’s 2 percent target.
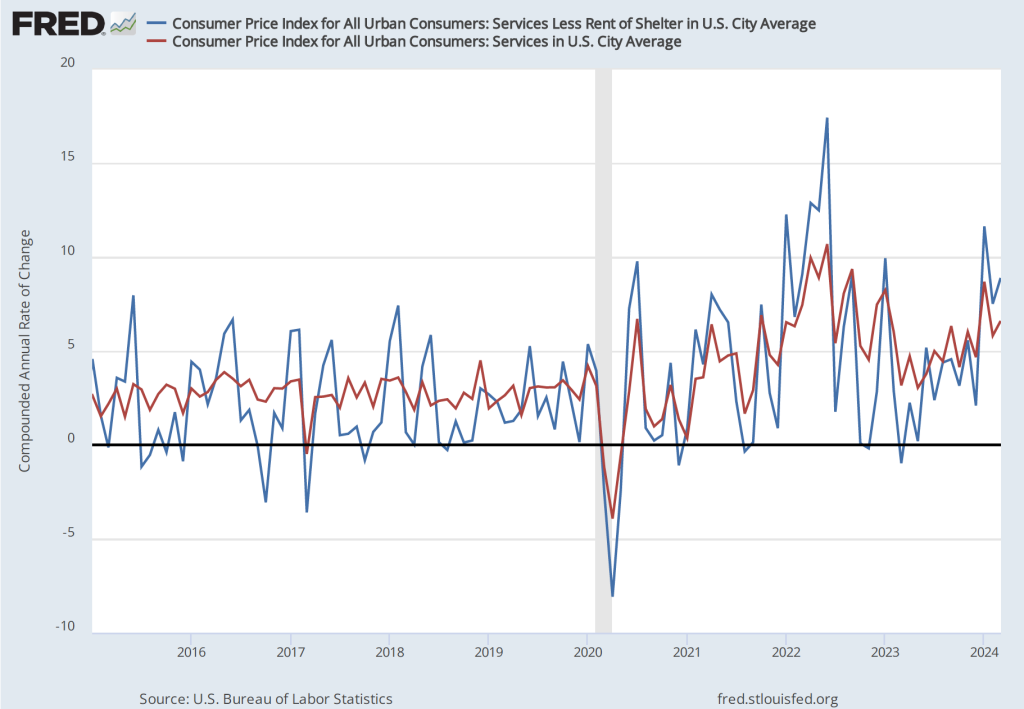
As has been true in recent months, the path of inflation in the prices of services has been concerning. As we’ve noted in earlier posts, Federal Reserve Chair Jerome Powell has emphasized that as supply chain problems have gradually been resolved, inflation in the prices of goods has been rapidly declining. But inflaion in services hasn’t declined nearly as much. Powell has been particularly concernd about how slowly the price of housing has been declining, a point he made again in the press conference that followed the most recent FOMC meeting.
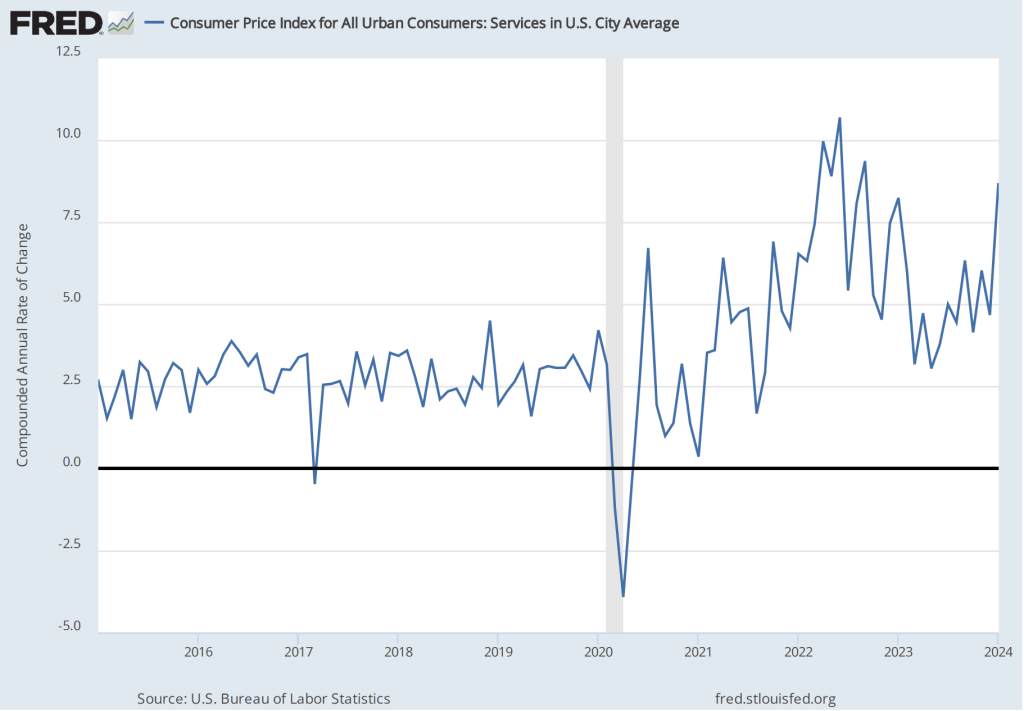
The following figure shows the 1-month inflation rate in service prices and in service prices not included including housing rent. The figure shows that inflation in all service prices has been above 4 percent in every month since July 2023, but inflation in service prices slowed markedly from 6.6 percent in March to 4.4 percent in April. Inflation in service prices not including housing rent declined more than 50 percent, from 8.9 percent in March to 3.4 percent in April. But, again, even though inflation in service prices declined in April, as the figure shows, the 1-month inflation in services is volatile and even these smaller increases aren’t yet consistent with the Fed meeting its 2 percent inflation target.

Finally, in order to get a better estimate of the underlying trend in inflation, some economists look at median inflation, which is calculated by economists at the Federal Reserve Bank of Cleveland and Ohio State University. If we listed the inflation rate in each individual good or service in the CPI, median inflation is the inflation rate of the good or service that is in the middle of the list—that is, the inflation rate in the price of the good or service that has an equal number of higher and lower inflation rates. As the following figure shows, at 4.3 percent, median inflation in April was unchanged from its value in March.

Today’s report was good news for the Fed in its attempts to reduce the inflation rate to its 2 percent target without pushing the U.S. economy into a recession. But Fed Chair Jerome Powell and other members of the FOMC have made clear that they are unlikely to begin cutting the target for the federal funds rate until they receive several months worth of data indicating that inflation has clearly resumed the downward path it was on during the last months of 2023. The unexpectedly high inflation data for the first three months of 2024 has clearly had a significant effect on Fed policy. Powell was quoted yesterday as noting that: “We did not expect this to be a smooth road, but these [inflation readings] were higher than I think anybody expected,”