Jerome Powell arriving to testify before Congress. (Photo from Bloomberg News via the Wall Street Journal.)
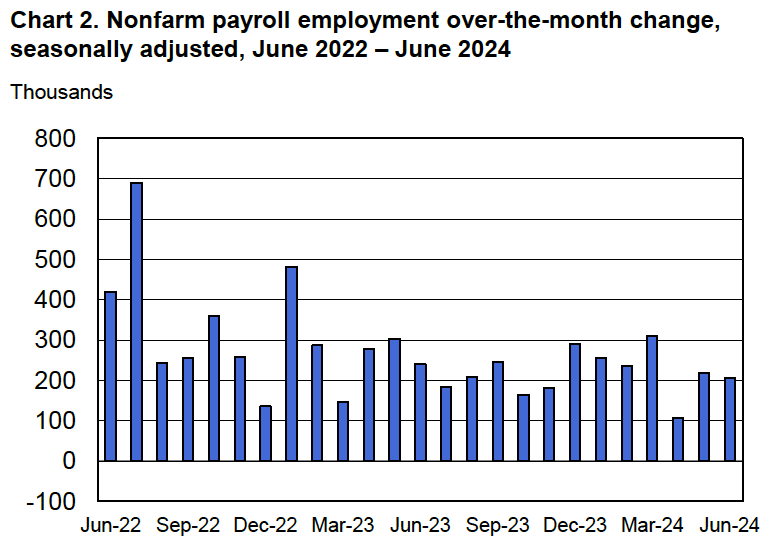
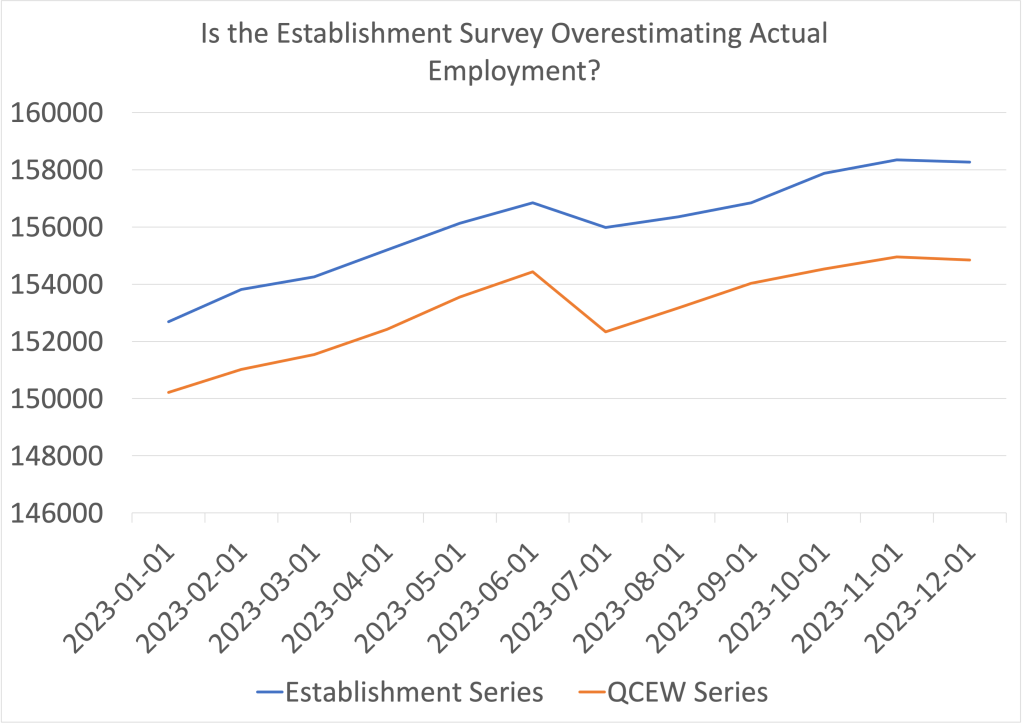
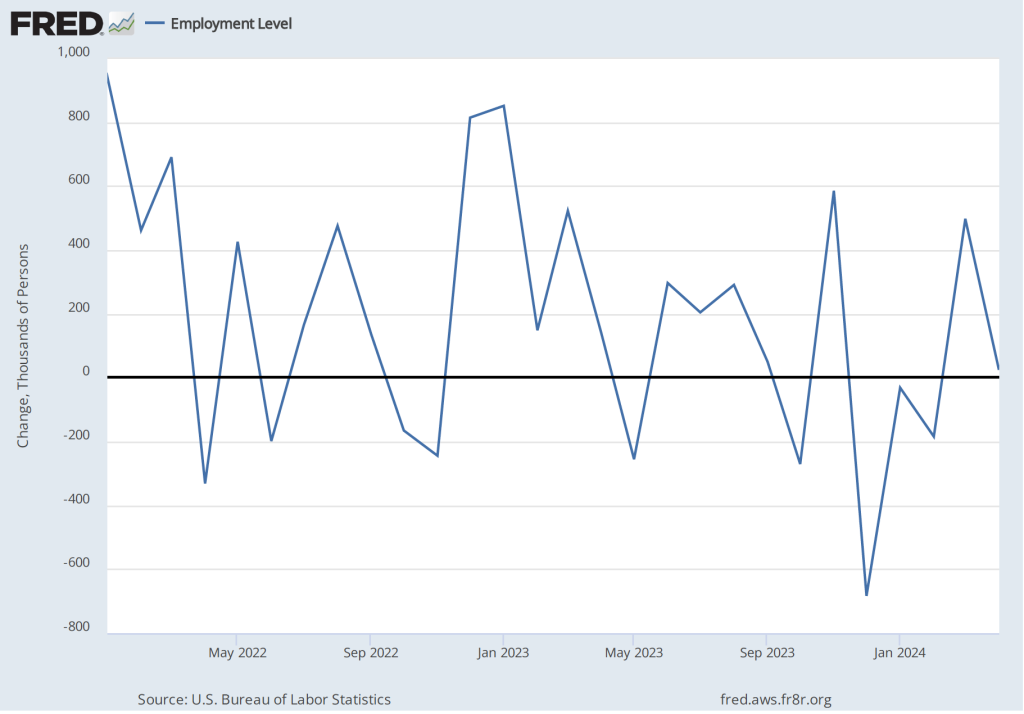
Each month the Bureau of Labor Statistics (BLS) releases its “Employment Situation” report. As we’ve discussed in previous blog posts, discussions of the report in the media, on Wall Street, and among policymakers center on the estimate of the net increase in employment that the BLS calculates from the establishment survey.
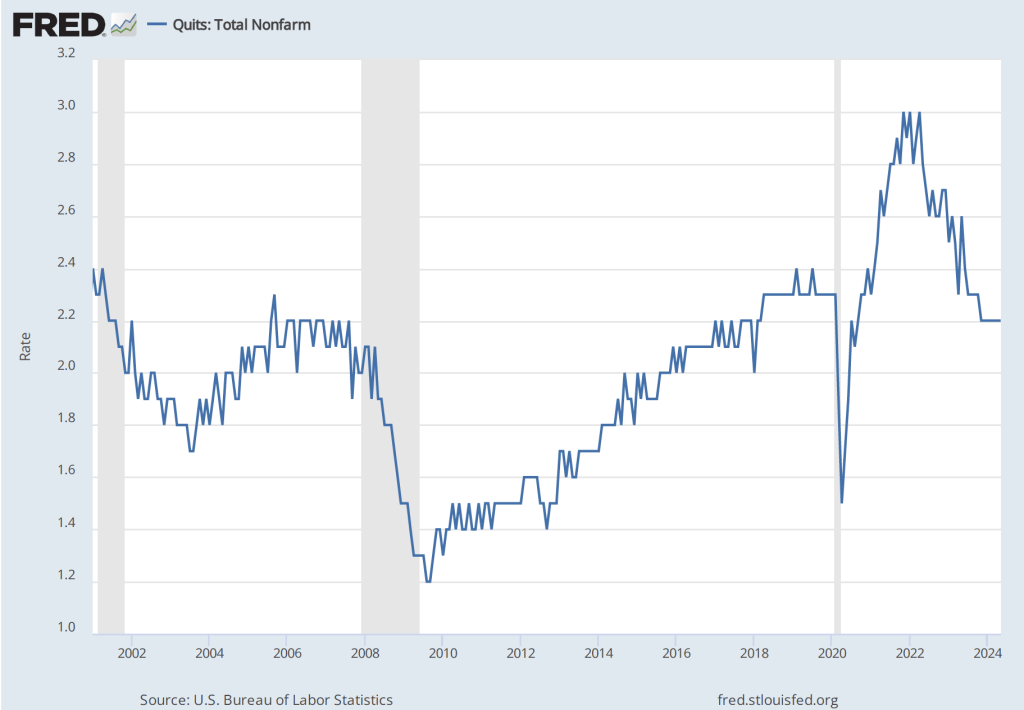
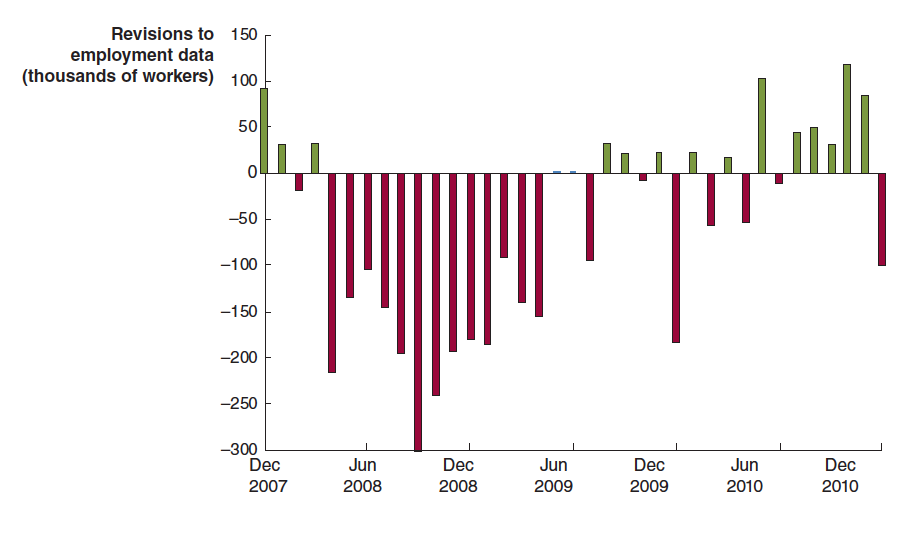
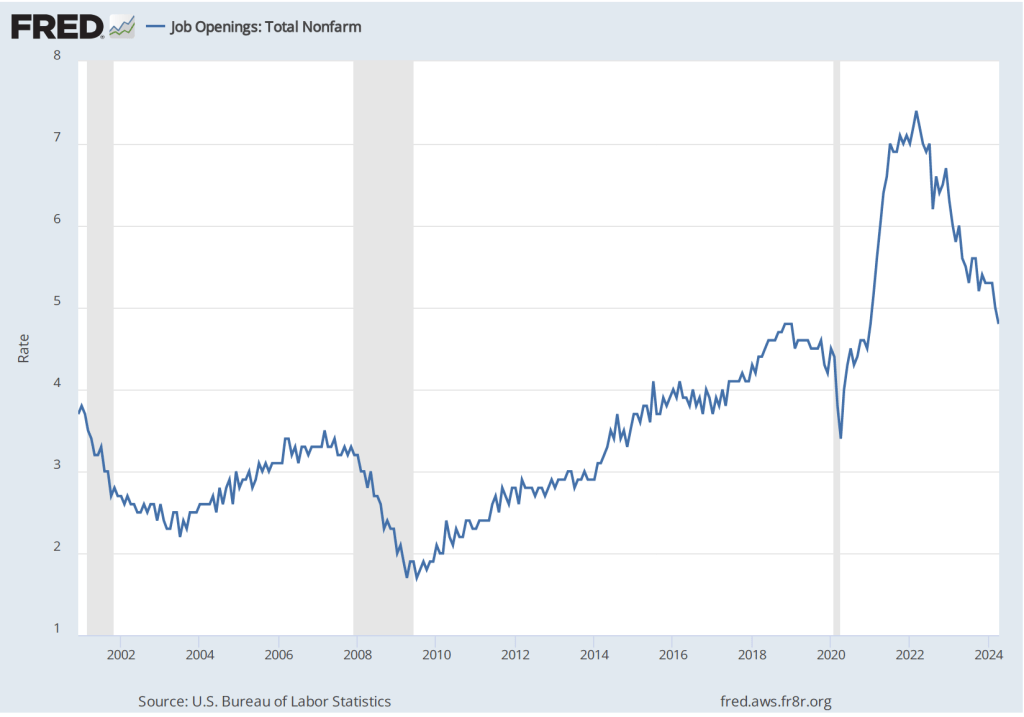
How should the members of the Fed’s policy-making Federal Open Market Committee interpret these data? For instance, the BLS reported that the net increases in employment in June was 206,000. (Always worth bearing in mind that the monthly data are subject to—sometimes substantial—revisions.) Does a net increase of employment of that size indicate that the labor market is still running hot—with the quantity of labor demanded by businesses being greater than the quantity of labor workers are supplying—or that the market is becoming balanced with the quantity of labor demanded roughly equal to the quantity of labor supplied?
On July 9, in testimony before the Senate Banking Committee indicated that his interpretation of labor market data indicate that: “The labor market appears to be fully back in balance.” One interpretation of the labor market being in balance is that the number of net new jobs the economy creates is enough to keep up with population growth. In recent years, that number has been estimated to be 70,000 to 100,000. The number is difficult to estimate with precision for two main reasons:
- There is some uncertainty about the number of older workers who will retire. The more workers who retire, the fewer net new jobs the economy needs to create to accommodate population growth.
- More importantly, estimates of population growth are uncertain, largely because of disagreements among economists and demographers over the number of immigrants who have entered the United States in recent years.
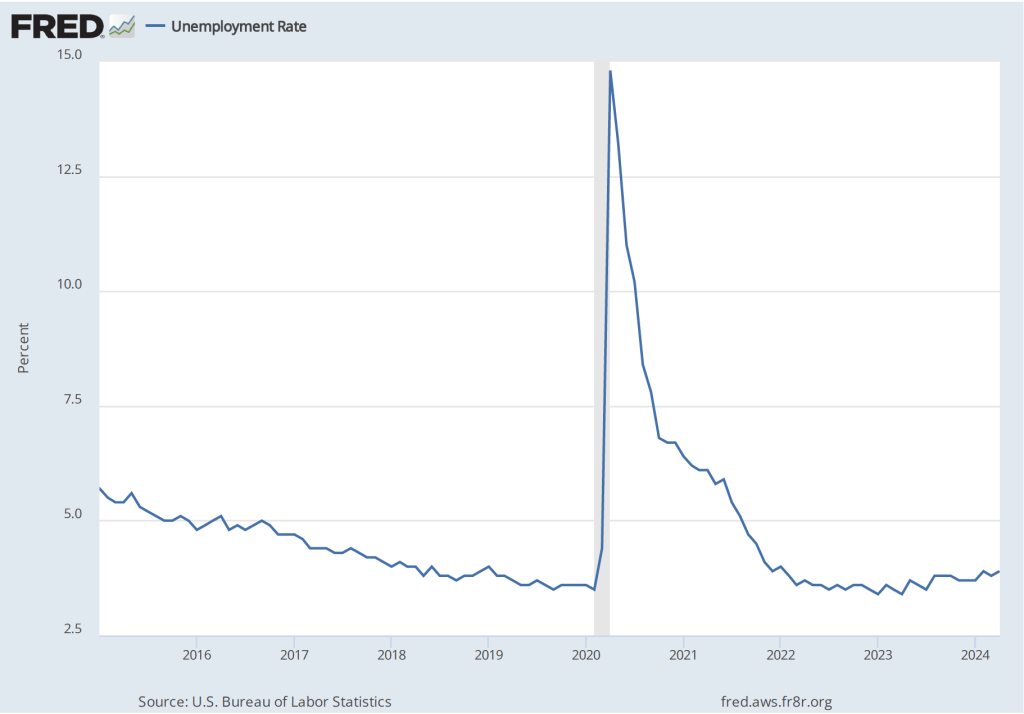
In calculating the unemployment rate and the size of the labor force, the BLS relies on estimates of population from the Census Bureau. In a January report, the Congressional Budget Office (CBO) argued that the Census Bureau’s estimate of the population of the United States is too low by about 6 million people. As the following figure from the CBO report indicates, the CBO believes that the Census Bureau has underestimated how much immigration has occurred and what the level of immigration is likely to be over the next few years. (In the figure, SSA refers to the Social Security Administration, which also makes forecasts of population growth.)

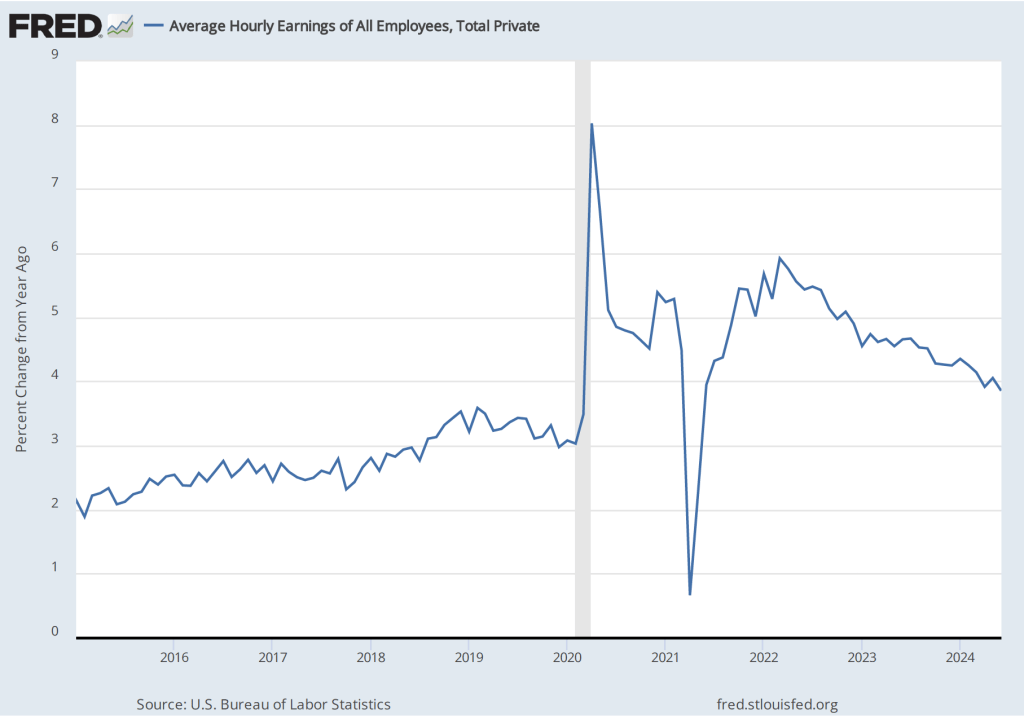
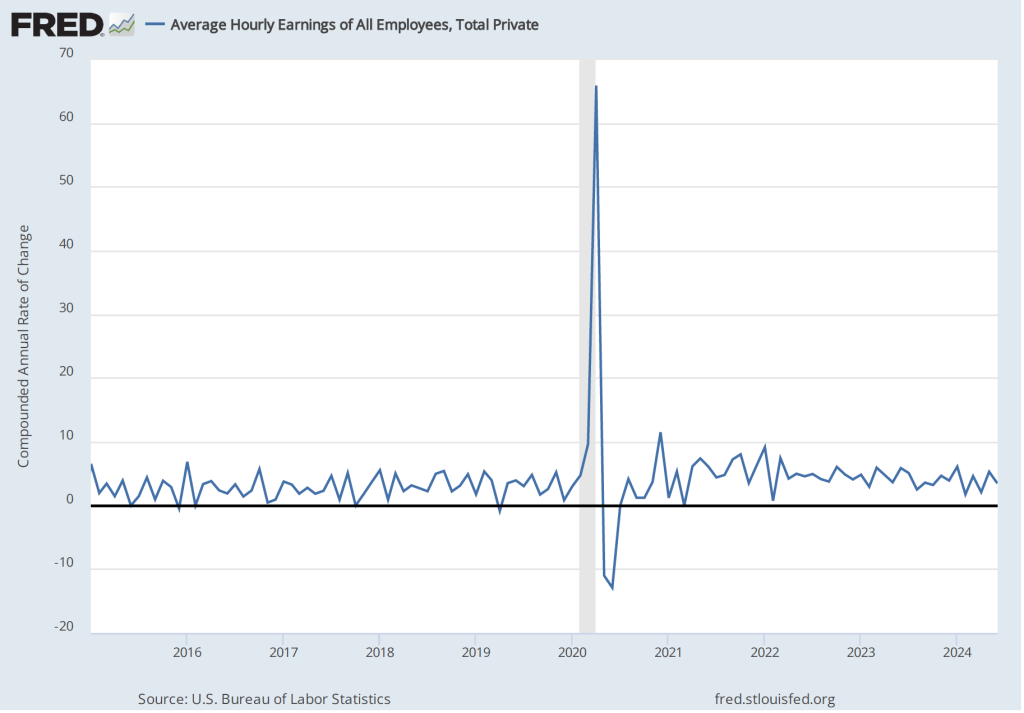
Some economists and policymakers have been surprised that low levels of unemployment and large monthly increases in employment have not resulted in greater upward pressure on wages. If the CBO’s estimates are correct, the supply of labor has been increasing more rapidly than is indicated by census data, which may account for the relative lack of upward pressure on wages. If the CBO’s estimates of population growth are correct, a net increase in employment of 200,000, as occured in June, may be about the number necessary to accommodate growth in the labor force. In other words, Chair Powell would be correct that the labor market was in balance in June.
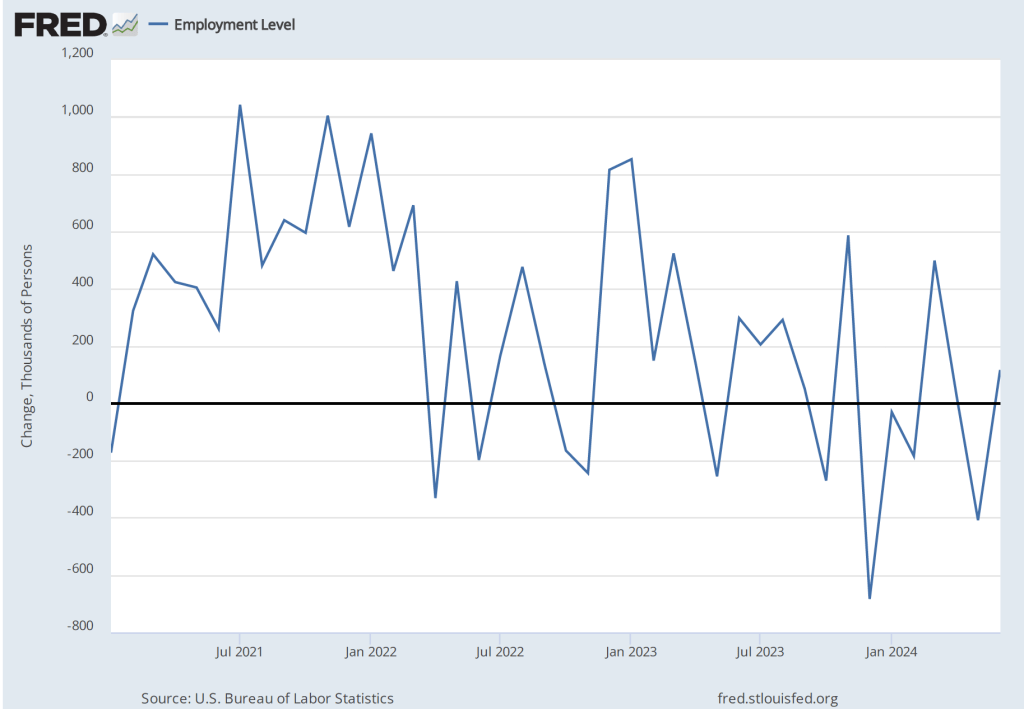
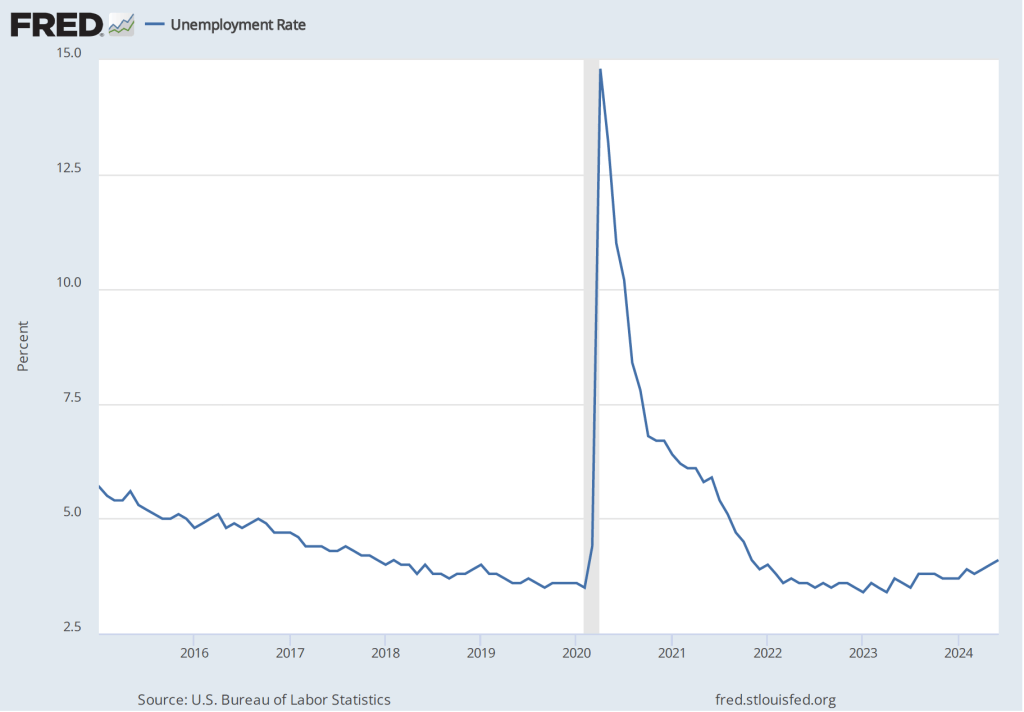
In a recent publication, economists Nicolas Petrosky-Nadeau and Stephanie A. Stewart of the Federal Reserve Bank of San Francisco look at a related concept: breakeven employment growth—the rate of employment growth required to keep the unemployment rate unchanged. They estimate that high rates of immigration during the past few years have raised the rate of breakeven employment growth from 70,000 to 90,000 jobs per month to 230,000 jobs per month. This analysis would be consistent with the fact that as net employment increases have averaged 177,000 over the past three months—somewhat below their estimate of breakeven employment growth—the unemployment rate has increased from 3.8 percent to 4.1 percent.