Ordinarily, on the first Friday of a month the Bureau of Labor Statistics (BLS) releases its “Employment Situation” report (often called the “jobs report”) containing data on the labor market for the previous month. There was no jobs report today (October 3) because of the federal government shutdown. (We discuss the shutdown in this blog post.)
The jobs report has two estimates of the change in employment during the month: one estimate from the establishment survey, often referred to as the payroll survey, and one from the household survey. As we discuss in Macroeconomics, Chapter 9, Section 9.1 (Economics, Chapter 19, Section 19.1), many economists and Federal Reserve policymakers believe that employment data from the establishment survey provide a more accurate indicator of the state of the labor market than do the household survey’s employment and unemployment data.
Economists surveyed had forecast that today’s payroll survey would have shown a net increase of 51,000 jobs in September. When the shutdown ends, the BLS will publish its jobs report for September. Until that happens, employment data collected by the private payroll processing firm Automatic Data Processing (ADP) provides an alternative measure of the state of the labor market. ADP data covers only about 20 percent of total private nonfarm employment, but ADP attempts to make its data more consistent with BLS data by weighting its data to reflect the industry weights used in the BLS data.
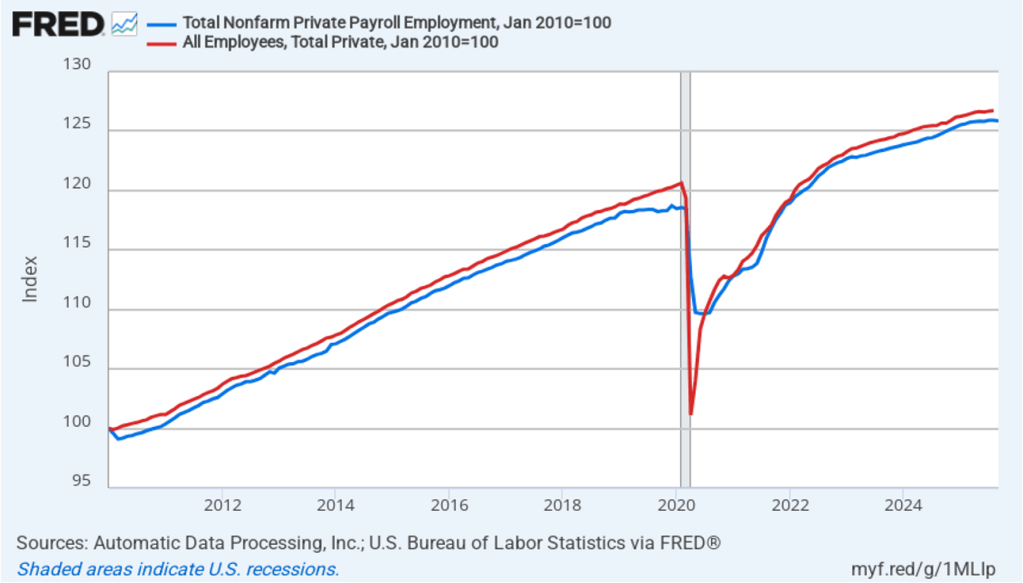
How closely does ADP employment data track BLS payroll data? The following figure shows the ADP employment series (blue line) and the BLS payroll employment data (red line) with the values for both series set equal to 100 in January 2010. The two series track well with the exception of April and May 2020 during the worst of the pandemic. The BLS series shows a much larger decline in employment during those months than does the ADP series.
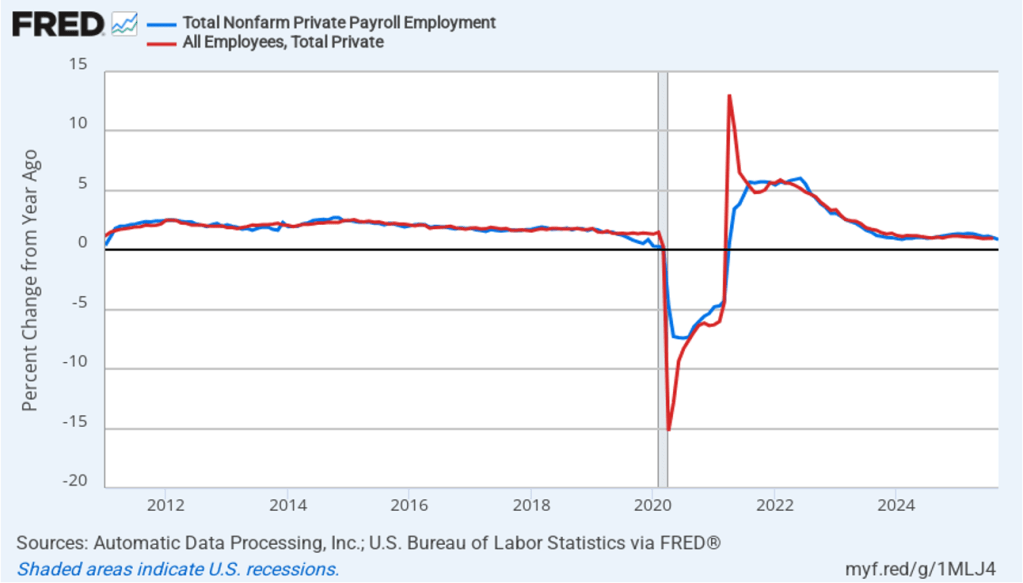
The next figure shows the 12-month percentage changes in the two series. Again, the series track fairly well except for the worst months of the pandemic and—strikingly—the month of April 2021 during the economic recovery. In that month, the ADP series increases by only 0.6 percent, while the BLS series soars by 13.1 percent.
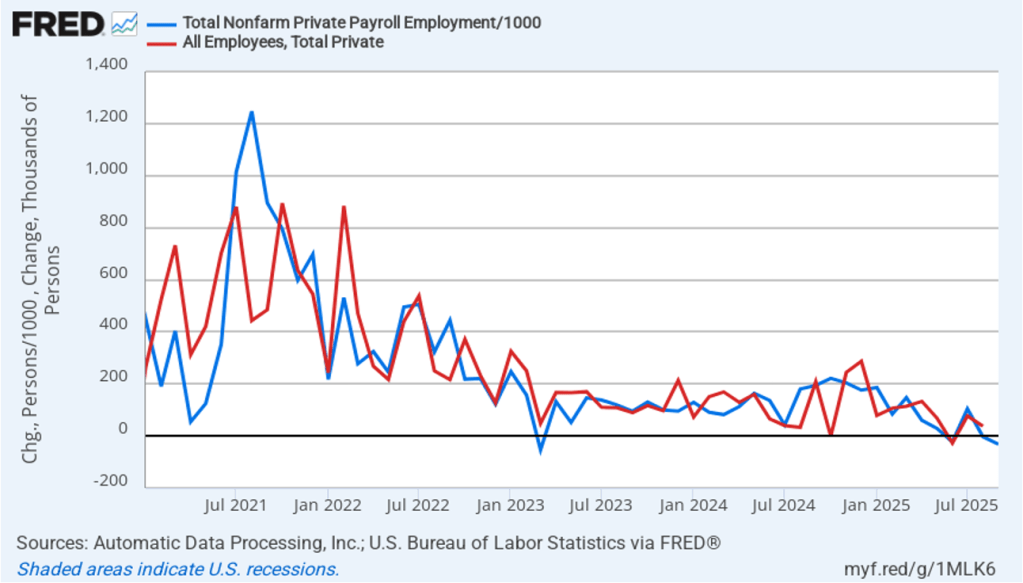
Finally, economists, policymakers, and investors usually focus on the change in payroll employment from the previous month—that is, the net change in jobs—shown in the BLS jobs report. The following figure shows the net change in jobs in the two series, starting in January 2021 to avoid some of the largest fluctuations during the pandemic.
Again, the two series track fairly well, although the BLS data is more volatile. The ADP data show a net decline of 32,000 jobs in September. As noted earlier, economists surveyed were expecting a net increase of 51,000 jobs. During the months from May through August, BLS data show an average monthly net increase in jobs of only 39,250. So, whether the BLS number will turn out to be closer to the ADP number or to the number economists had forecast, the message would be the same: Since May, employment has grown only slowly. And, of course, as we’ve seen this year, whatever the BLS’s initial employment estimate for September turns out to be, it’s likely to be subject to significant revision in coming months. (We discuss why BLS revisions to its initial employment estimates can be substantial in this post.)
This morning (September 30), the federal government appears headed for a shutdown at midnight. As this handy explainer by David Wessel on the Brookings Institution website notes:
“… federal agencies cannot spend or obligate any money without an appropriation (or other approval) from Congress. When Congress fails to enact the 12 annual appropriation bills, federal agencies must cease all non-essential functions until Congress acts.
Government employees who provide what are deemed essential services, such as air traffic control and law enforcement, continue to work, but don’t get paid until Congress takes action to end the shutdown. All this applies only to the roughly 25% of federal spending subject to annual appropriation by Congress.”
A federal government shutdown can cause significant inconvenience to people who rely on nonessential government services. Federal government employees won’t receive paychecks nor will contractors supplying nonessential services, such as cleaning federal office buildings. Many federal government facilities, such as museums and national parks will be closed or will operate on reduced hours. It seems likely that the Bureau of Labor Statistics will not release on time its “Employment Situation Report” for September, which was due on Friday.
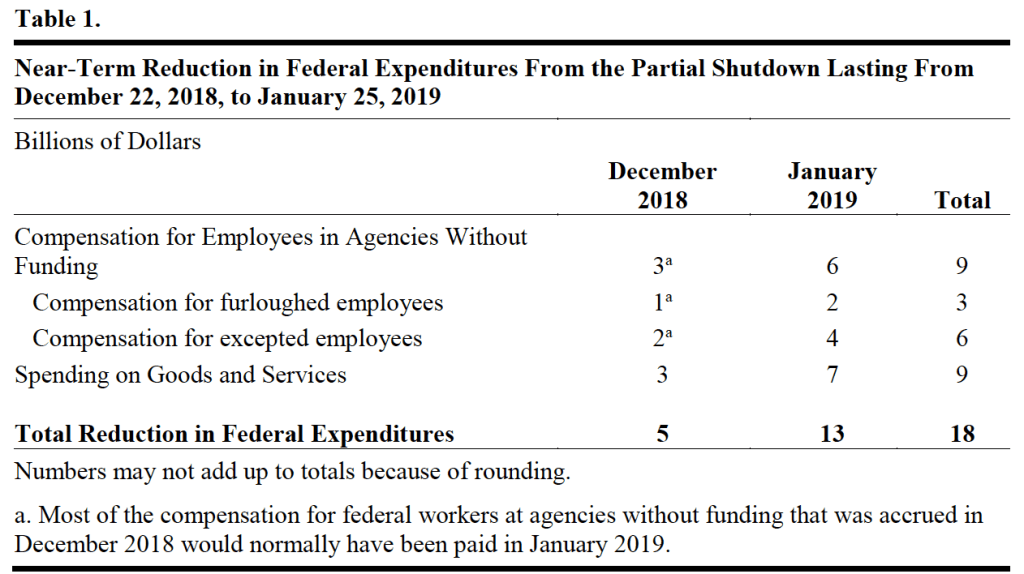
Apart from the effects just listed, how might a shutdown affect the broader economy? The most recent federal government shutdown occurred during the first Trump administration and lasted from December 22, 2018 to January 25, 2019. At the end of that shutdown, the Congressional Budget Office (CBO) prepared a report on its economic effects. The main conclusion of the report was that:
“In CBO’s estimation, the shutdown dampened economic activity mainly because of the loss of furloughed federal workers’ contribution to GDP, the delay in federal spending on goods and services, and the reduction in aggregate demand (which thereby dampened private-sector activity).”
Table 1 from the CBO report shows the effect of the shutdown on federal government expenditures. (Note that the CBO refers to the shutdown as being “partial” because, as in all federal government shutdowns, essential government services continued to be provided.)
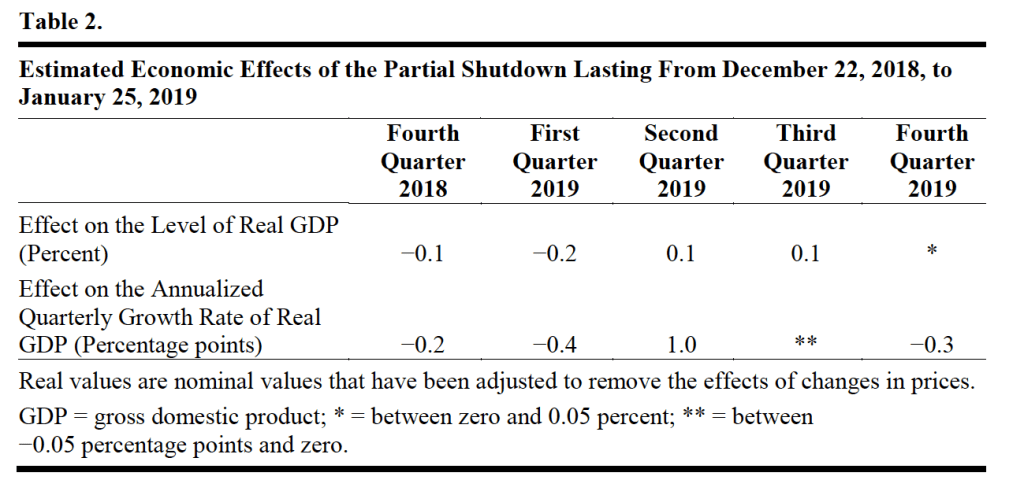
Table 2 from the report shows the effects of the shutdown on real GDP.
Most of the macroeconomic effects of a government shutdown aren’t long lasting because most federal government spending that doesn’t occur during the shutdown is postponed rather than eliminated. When federal government employees return to work after the shutdown, they typically receive backpay for the time they were furloughed. The CBO estimates that the lasting effect of the shutdown on GDP was small “about $3 billion in forgone economic activity will not be recovered. That amount equals 0.02 percent of projected annual GDP in 2019.”
Will a federal government shutdown that begins at midnight tonight and lasts for a few weeks also have only a short-lived effect on the economy? That seems likely, although the Trump administration has indicated that if a shutdown occurs, some federal government employees will be fired rather than just furloughed. A significant reduction in federal employment could lead to a larger decrease in GDP that might persist for longer. The effect on the areas of Virginia and Maryland where most federal government workers live could be significant in the short run.
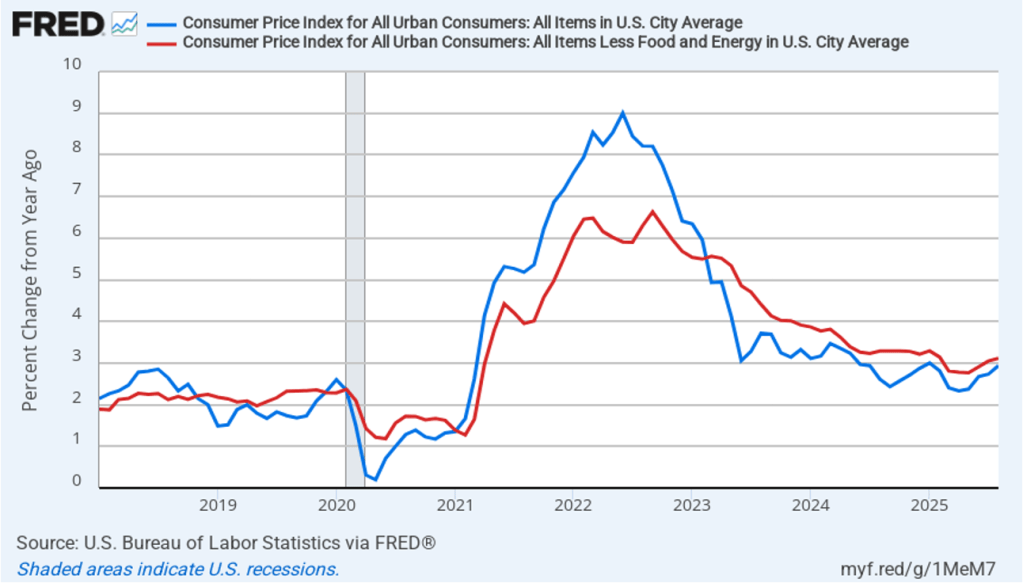
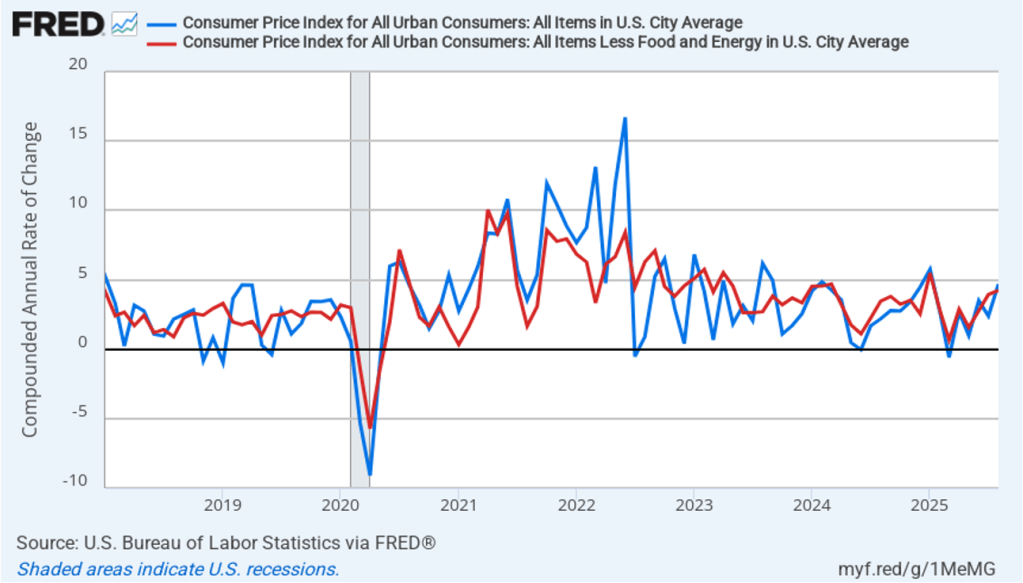
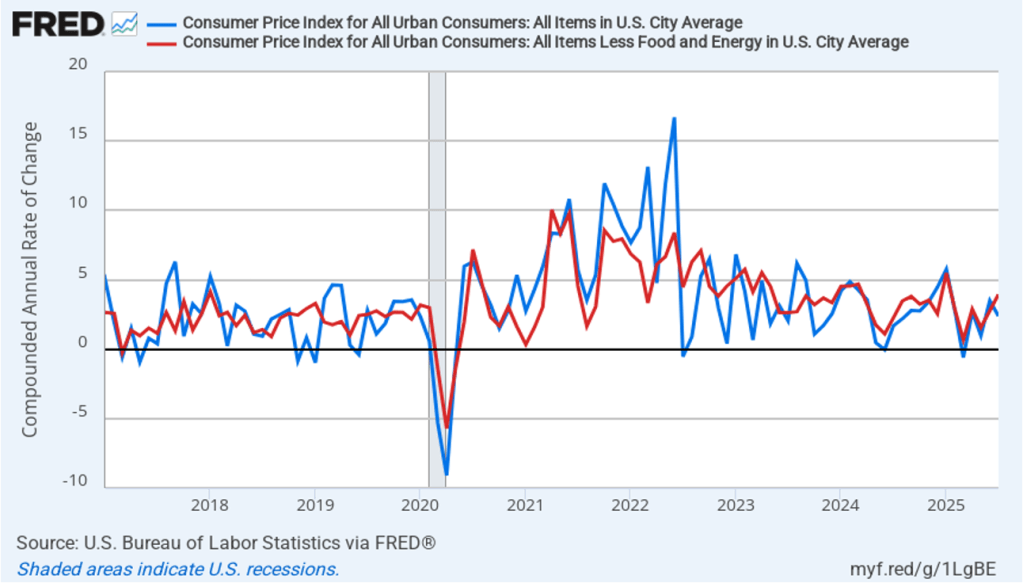
Today (September 11), the Bureau of Labor Statistics (BLS) released its report on the consumer price index (CPI) for August. The following figure compares headline CPI inflation (the blue line) and core CPI inflation (the red line).
The headline inflation rate, which is measured by the percentage change in the CPI from the same month in the previous year, was 2.9 percent in August, up from 2.7 in July.
The core inflation rate,which excludes the prices of food and energy, was 3.1 percent in August, up slightly from 3.0 percent in July.
Headline inflation and core inflation were both the same as economists surveyed had expected.
In the following figure, we look at the 1-month inflation rate for headline and core inflation—that is the annual inflation rate calculated by compounding the current month’s rate over an entire year. Calculated as the 1-month inflation rate, headline inflation (the blue line) jumped from 2.4 percent in July to 4.7 percent in August. Core inflation (the red line) increased from 3.9 percent in July to 4.2 percent in August.
The 1-month and 12-month inflation rates are both indicating that inflation accelerated in August. Core inflation—which is often a good indicator of future inflation—in particular has been running well above the Fed’s 2 percent inflation target during the last two months.
Of course, it’s important not to overinterpret the data from a single month. The figure shows that the 1-month inflation rate is particularly volatile. Also note that the Fed uses the personal consumption expenditures (PCE) price index, rather than the CPI, to evaluate whether it is hitting its 2 percent annual inflation target.
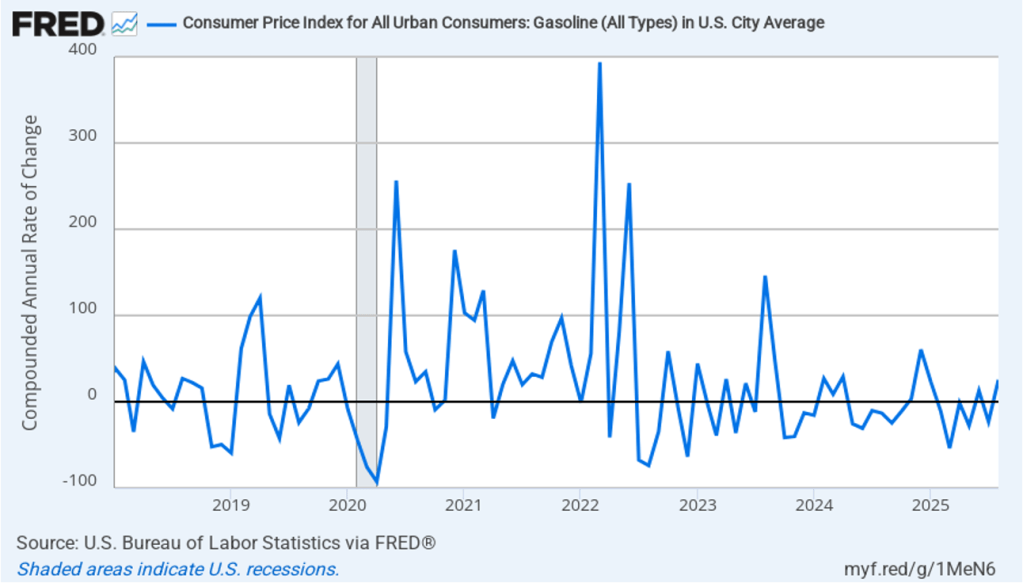
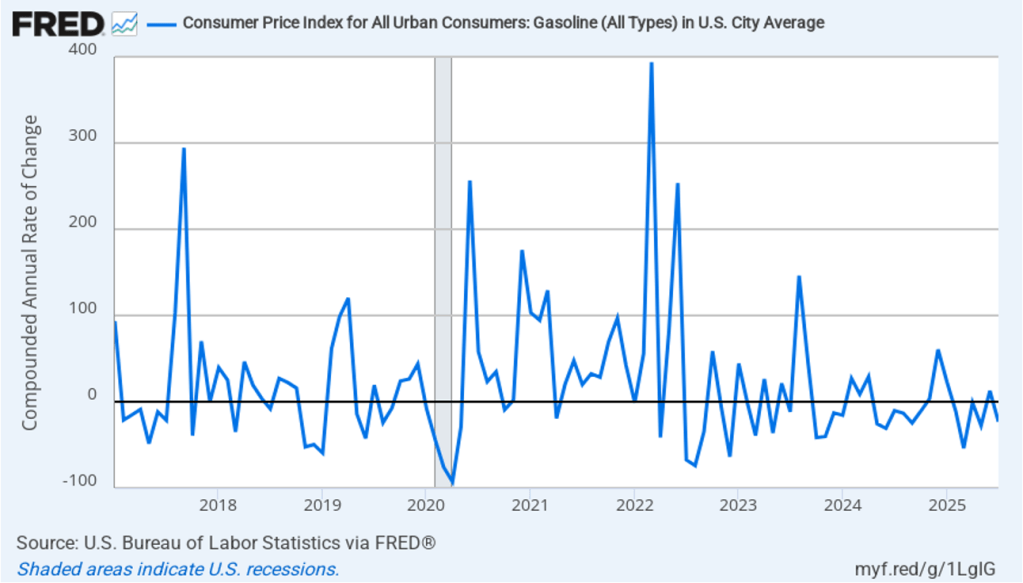
Core inflation had been running significantly higher than headline inflation in the past few months because gasoline prices had generally been falling since February. Gasoline prices turned around in August, however, increasing at a 25.5 percent annual rate. As shown in the following figure, 1-month inflation in gasoline prices moves erratically—which is the main reason that gasoline prices aren’t included in core inflation.
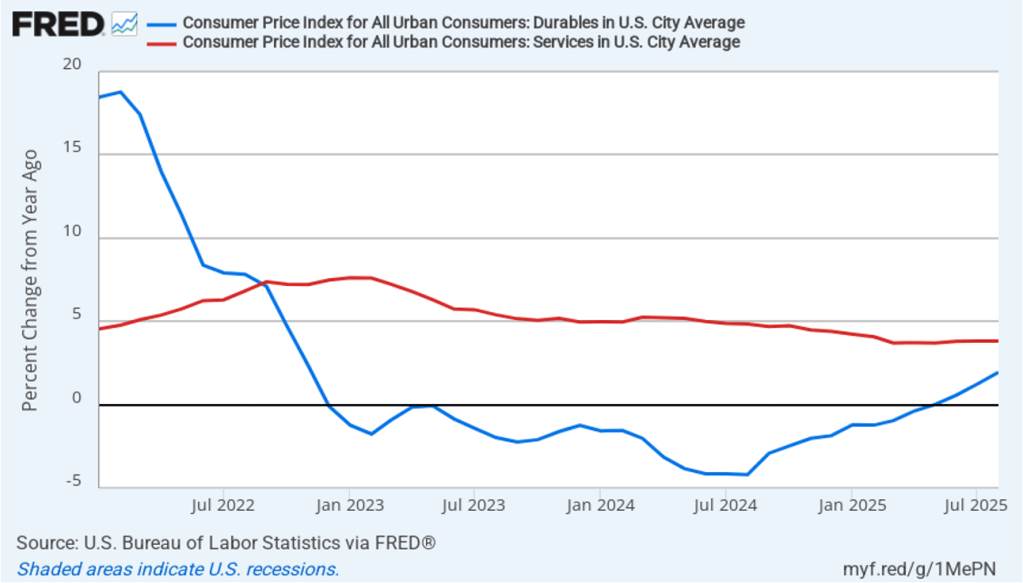
Does the increase in inflation represent the effects of the increases in tariffs that the Trump administration announced on April 2? (Note that many of the tariff increases announced on April 2 have since been reduced) The following figure shows 12-month inflation in durable goods—such as furniture, appliances, and cars—which are likely to be affected directly by tariffs, and services, which are less likely to be affected by tariffs.. To make recent changes clearer, we look only at the months since January 2022. In August, inflation in durable goods increased to 1.9 percent from 1.2 percent in July. Inflation in services in August was 3.8 percent, unchanged from July.
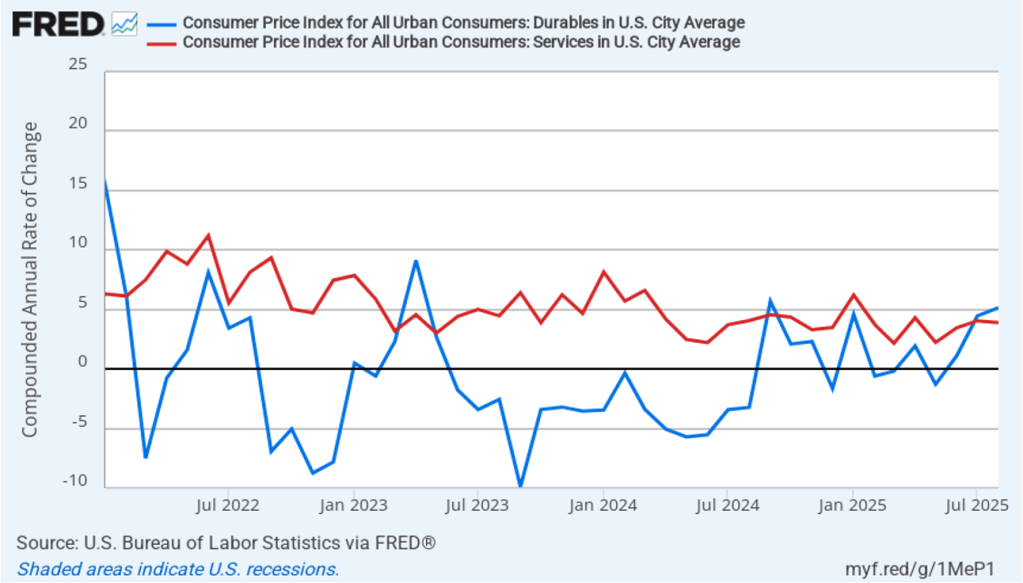
The following figure shows 1-month inflation in the prices of these products, which may make the effects of tariffs clearer. In August, durable goods inflation was 5.1 percent up from 4.5 percent in July. Service inflation was 3.9 percent in August, down slightly from 4.0 percent in July. Inflation in goods and services both running well above 2 percent is not good news for inflation falling back to the Fed’s 2 percent target in the near future.
To better estimate the underlying trend in inflation, some economists look at median inflation and trimmed mean inflation.
Median inflation is calculated by economists at the Federal Reserve Bank of Cleveland and Ohio State University. If we listed the inflation rate in each individual good or service in the CPI, median inflation is the inflation rate of the good or service that is in the middle of the list—that is, the inflation rate in the price of the good or service that has an equal number of higher and lower inflation rates.
Trimmed-mean inflation drops the 8 percent of goods and services with the highest inflation rates and the 8 percent of goods and services with the lowest inflation rates.
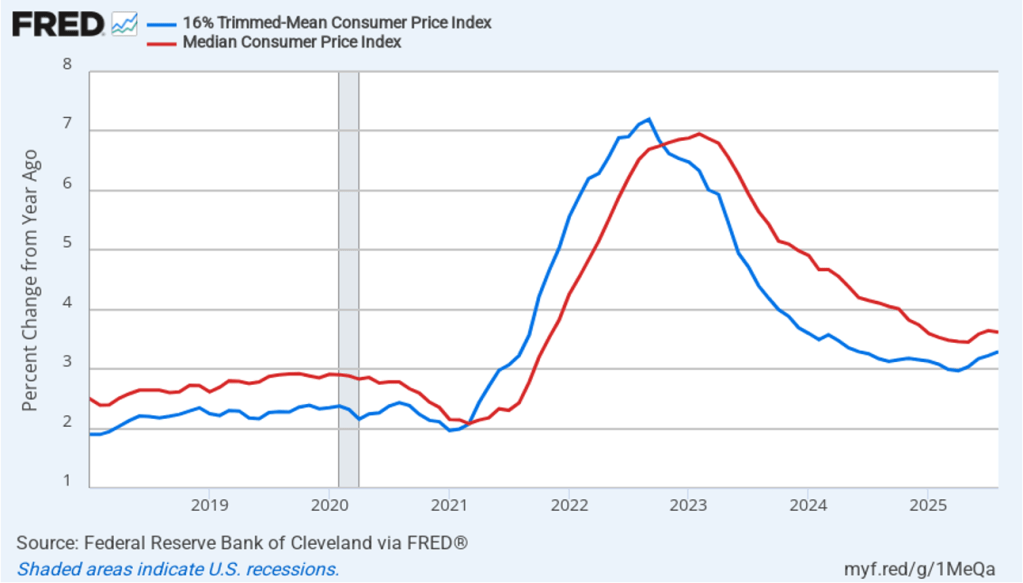
The following figure shows that 12-month trimmed-mean inflation (the blue line) was 3.3 percent in August, up slightly from 3.2 July. Twelve-month median inflation (the red line) 3.6 percent in August, unchanged from July.
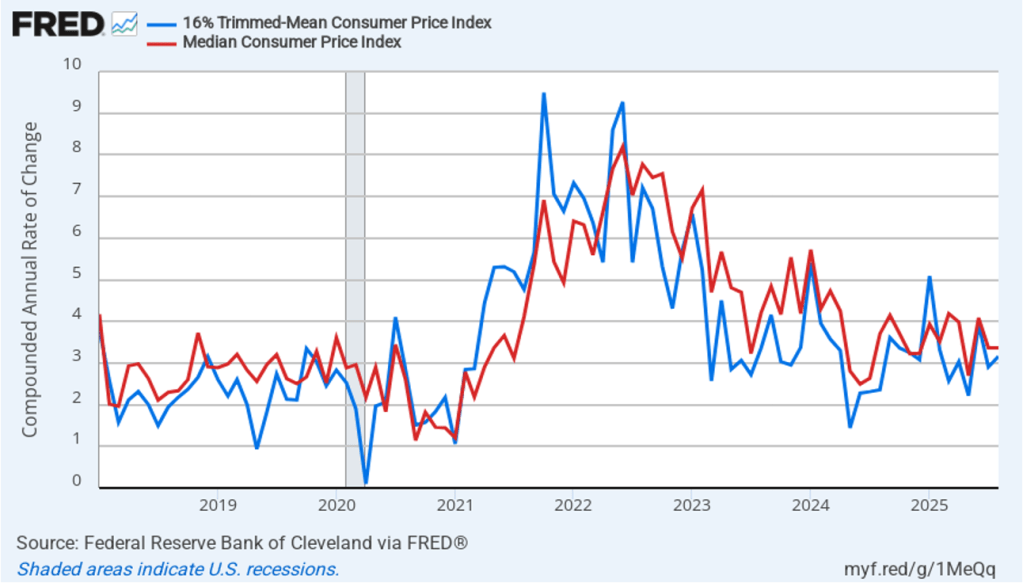
The following figure shows 1-month trimmed-mean and median inflation. One-month trimmed-mean inflation rose from 2.9 percent in July to 3.2 percent in August. One-month median inflation remained unchanged at 3.4 percent in August. These data are consistent with the view that inflation is running above the Fed’s 2 percent target.
The CPI inflation data combined with the recent jobs data (which we discuss here and here), indicate that the U.S. economy may be entering a period of stagflation—a combination of rising inflation with falling, or stagnating, output. Stagflation poses a policy dilemma for the Fed’s policymaking Federal Open Market Committee (FOMC) because cutting its target for the federal funds rate to increase economic growth and employment may worsen inflation. At this point, it seems likely that the FOMC will “look through” this month’s rising inflation because it may be largely due to one-time price increases caused by tariffs. Committee members have signaled that they are likely to cut their target for the federal funds rate by 0.25 percent (25 basis points) at the conclusion of their meeting on September 16–17 and again at the conclusion of the following meeting on October 28–29.
Today (September 9), the Bureau of Labor Statistics (BLS) issued revised estimates of the increase in employment, as measured by the establishment survey, over the period from April 2024 through March 2025. The BLS had initially estimated that during that period net employment had increased by a total of 1,758,000 or an average of 147,000 jobs per month. The revision lowered this estimate by more than half to a total of 839,000 jobs or an average of only 70,000 net new jobs created per month. The difference between those two monthly averages means that the U.S. economy had generated a total of 919,000 fewer jobs during that period. The revision was larger than the downward revision of 800,000 jobs forecast by economists at Wells Fargo, Comerica Bank, and Pantheon Macroeconomics.
Why does the BLS have to revise its employment estimates? As we discuss in Macroeconomics, Chapter 9, Section 9.1 (Economics, Chapter 19, Section 19.1) the initial estimates that the BLS issues each month in its “Employment Situation” reports are based on a sample of 121,000 businesses and government agencies representing 631,000 worksites or “establishments.” The monthly data also rely on estimates of the number of employees at establishments that opened or closed during the month and on employment changes at establishments that failed to respond to the survey. In August or September of each year, the BLS issues revised employment estimates based on data from the Quarterly Census of Employment and Wages (QCEW), which relies on state unemployment insurance tax records. The unemployment tax records are much more comprehensive than the original sample of establishments because nearly all employers are included.
In today’s report, the BLS cited two likely sources of error in their preliminary estimates:
“First, businesses reported less employment to the QCEW than they reported to the CES survey (response error). Second, businesses who were selected for the CES survey but did not respond reported less employment to the QCEW than those businesses who did respond to the CES survey (nonresponse error).”
The preliminary benchmark estimates the BLS released today will be revised again and the final estimates for these months will be released in February 2026. The difference between the preliminary and final benchmark estimates can be substantial. For example, last year, the BLS’s initially preliminary benchmark estimate indicated that the net employment increase from April 2023 to March 2024 had been overestimated by 818,000 jobs. In February 2025, the final benchmark estimate reduced this number to 598,000 jobs.
Although this year’s revision is particularly large in absolute terms—the largest since at least 2001—it still represents only about 0.56 percent of the more than 159.5 million people employed in the U.S. economy. Still the size of this revision is likely to increase political criticism of the BLS.
How will this revision affect the decision by the Federal Open Market Committee (FOMC) at its next meeting on September 16-17 to cut or maintain its target for the federal funds rate? The members of the committee were probably not surprised by the downward revision in the employment estimates, although they may have anticipated that the revision would be smaller. In six of the past seven years, the BLS has revised its estimates of payroll employment downward in its annual preliminary benchmark revision.
As we noted in this recent post, even before the BLS revised its employment estimates downward, recent monthly net employment increases were well below the increases during the first half of the year. There was already a high likelihood that the FOMC intended to cut its target for the federal funds rate at its meeting on September 16–17. The substantial downward revision in the employment data makes a cut at the September meeting nearly a certainty and increases the likelihood that the FOMC will implement a second cut in its target for the federal funds rate at the committee’s meeting on October 28–29.
This morning (September 5), the Bureau of Labor Statistics (BLS) released its “Employment Situation” report (often called the “jobs report”) for August. The data in the report show that the labor market was weaker than expected in August.
The jobs report has two estimates of the change in employment during the month: one estimate from the establishment survey, often referred to as the payroll survey, and one from the household survey. As we discuss in Macroeconomics, Chapter 9, Section 9.1 (Economics, Chapter 19, Section 19.1), many economists and Federal Reserve policymakers believe that employment data from the establishment survey provide a more accurate indicator of the state of the labor market than do the household survey’s employment data and unemployment data. (The groups included in the employment estimates from the two surveys are somewhat different, as we discuss in this post.)
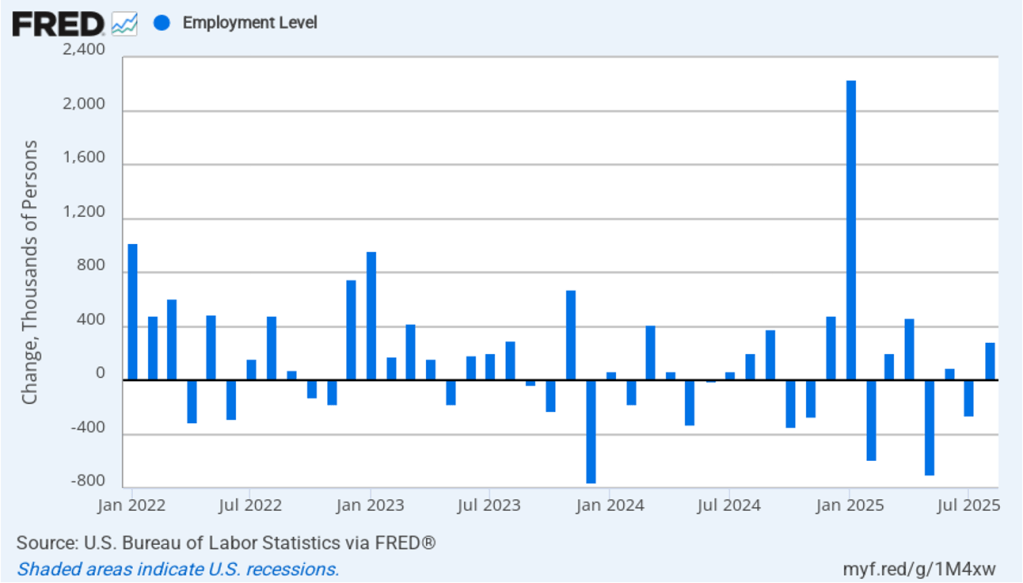
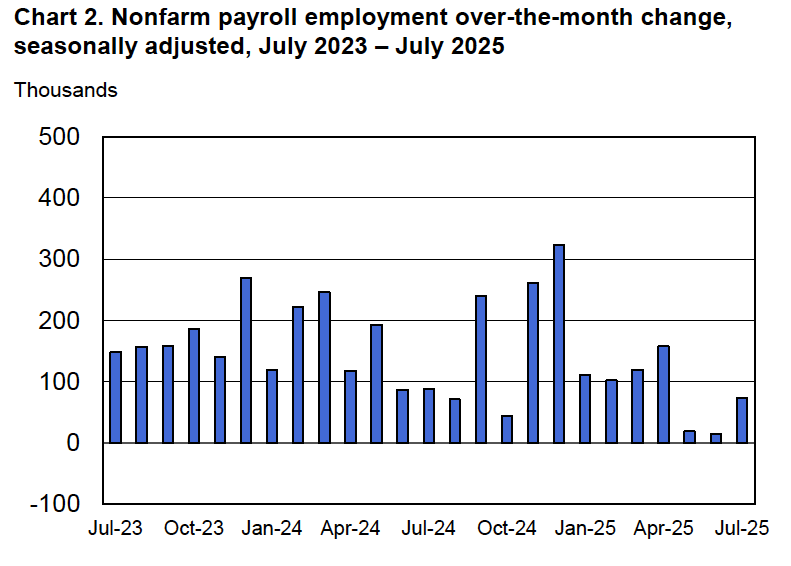
According to the establishment survey, there was a net increase of only 22,000 nonfarm jobs during August. This increase was well below the increase of 110,000 that economists surveyed by FactSet had forecast. Economists surveyed by the Wall Street Journal had forecast a smaller increase of 75,000 jobs. In addition, the BLS revised downward its previous estimates of employment in June and July by a combined 21,000 jobs. The estimate for June was revised from a net gain of 14,000 to a net loss of 13,000. This was the first month with a net job loss since December 2020. (The BLS notes that: “Monthly revisions result from additional reports received from businesses and government agencies since the last published estimates and from the recalculation of seasonal factors.”)
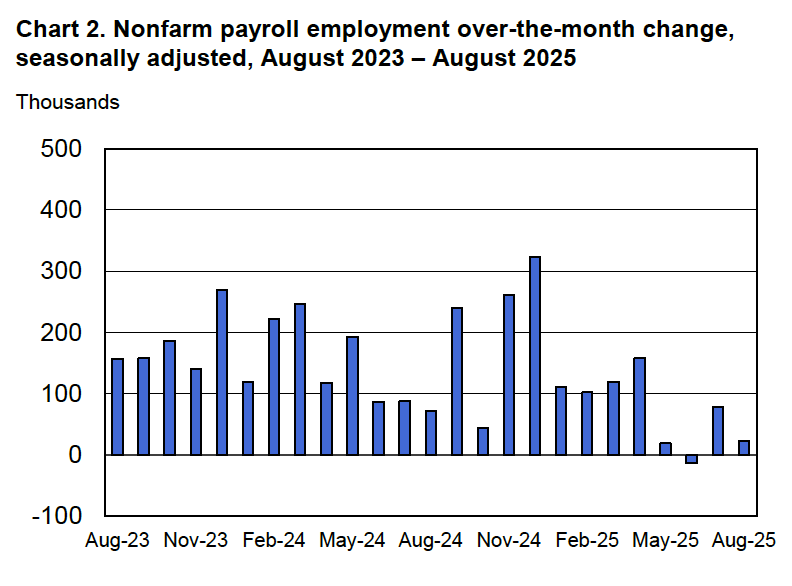
The following figure from the jobs report shows the net change in nonfarm payroll employment for each month in the last two years. The figure makes clear the striking deceleration in job growth since April. The Trump administration announced sharp increases in U.S. tariffs on April 2. Media reports indicate that some firms have slowed hiring due to the effects of the tariffs or in anticipation of those effects.
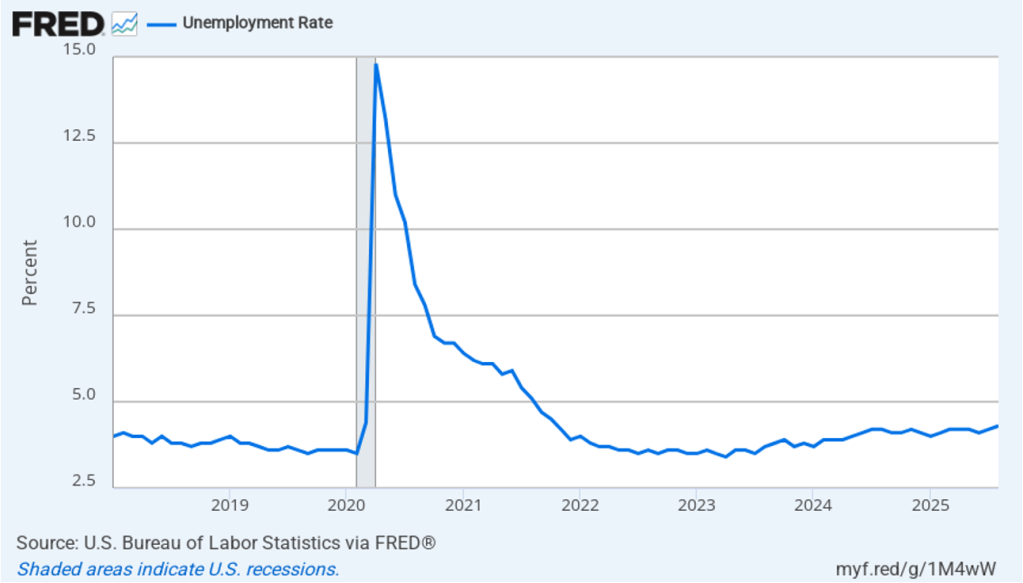
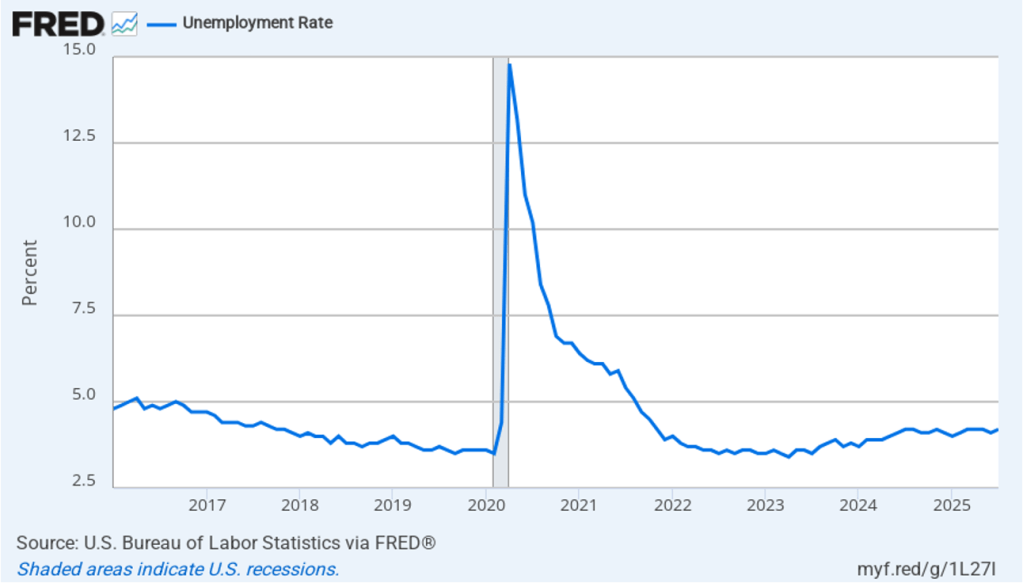
The unemployment rate increased from 4.2 percent in July to 4.3 percent in August, the highest rate since October 2021. The unemployment rate is above the 4.2 percent rate economists surveyed by FactSet had forecast. As the following figure shows, the unemployment rate had been remarkably stable over the past year, staying between 4.0 percent and 4.2 percent in each month May 2024 to July 2025 before breaking out of that range in August. In June, the members of the Federal Open Market Committee (FOMC) forecast that the unemployment rate during the fourth quarter of 2025 would average 4.5 percent. The unemployment rate would still have to rise significantly for that forecast to be accurate.
Each month, the Federal Reserve Bank of Atlanta estimates how many net new jobs are required to keep the unemployment rate stable. Given a slowing in the growth of the working-age population due to the aging of the U.S. population and a sharp decline in immigration, the Atlanta Fed currently estimates that the economy would have to create 97,591 net new jobs each month to keep the unemployment rate stable at 4.3 percent. If this estimate is accurate, continuing monthly net job increases of 22,000 would result in a a rising unemployment rate.
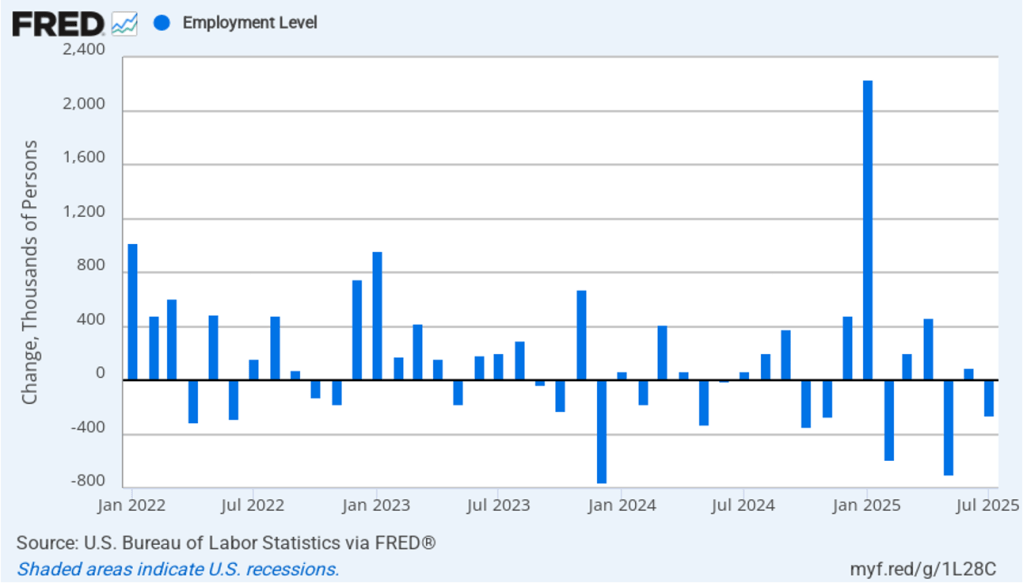
As the following figure shows, the monthly net change in jobs from the household survey moves much more erratically than does the net change in jobs from the establishment survey. As measured by the household survey, there was a net increase of 288,000 jobs in August, following a net decrease of 260,000 jobs in July. As an indication of the volatility in the employment changes in the household survey note the very large swings in net new jobs in January and February. In any particular month, the story told by the two surveys can be inconsistent. as was the case this month with employment increasing much more in the household survey than in the employment survey. (In this blog post, we discuss the differences between the employment estimates in the two surveys.)
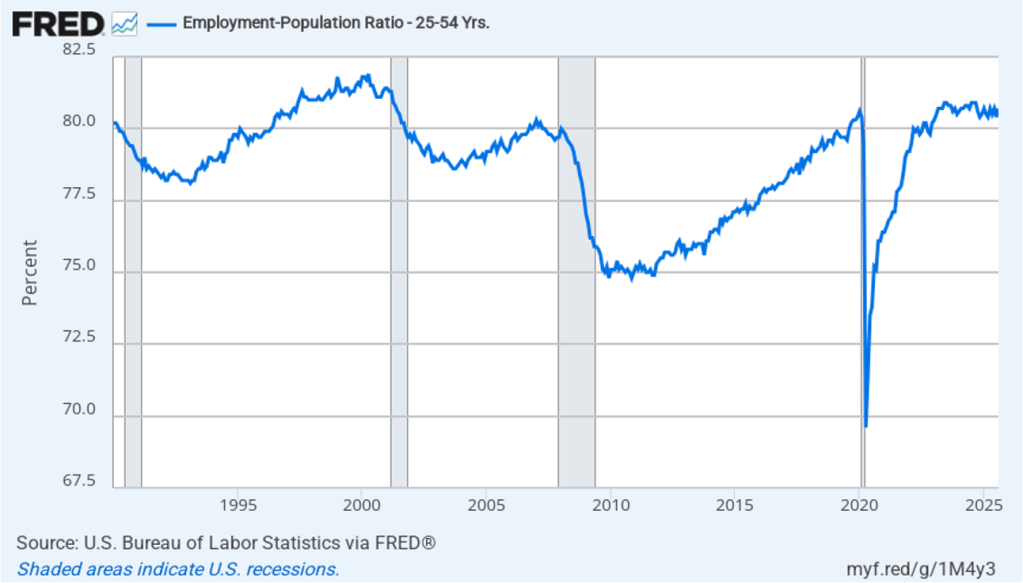
The household survey has another important labor market indicator: the employment-population ratio forprime age workers—those aged 25 to 54. In August the ratio rose to 80.7 percent from 8.4 percent in July. The prime-age employment-population ratio is somewhat below the high of 80.9 percent in mid-2024, but is still above what the ratio was in any month during the period from January 2008 to February 2020. The increase in the prime-age employment-population ratio is a bright spot in this month’s jobs report.
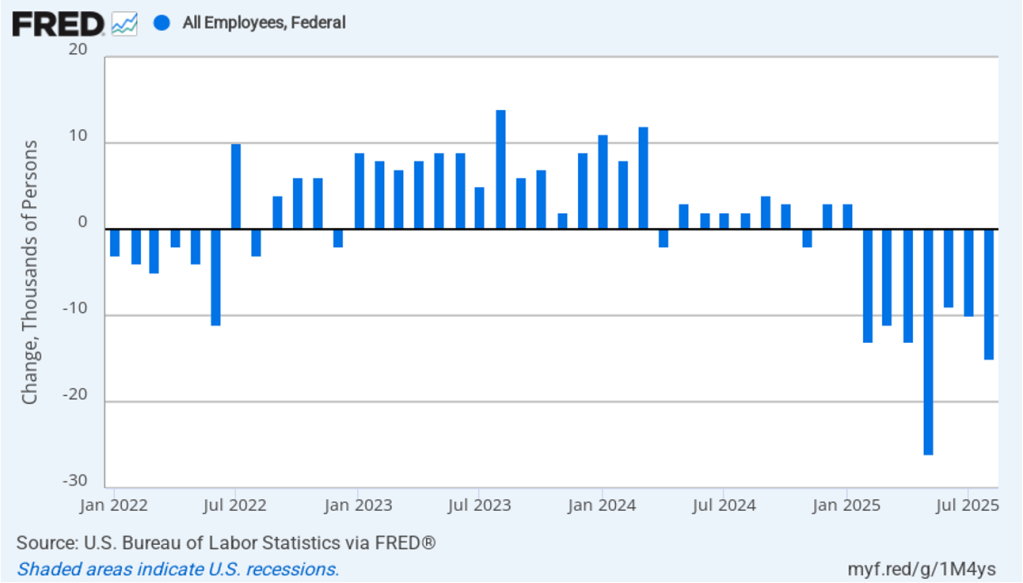
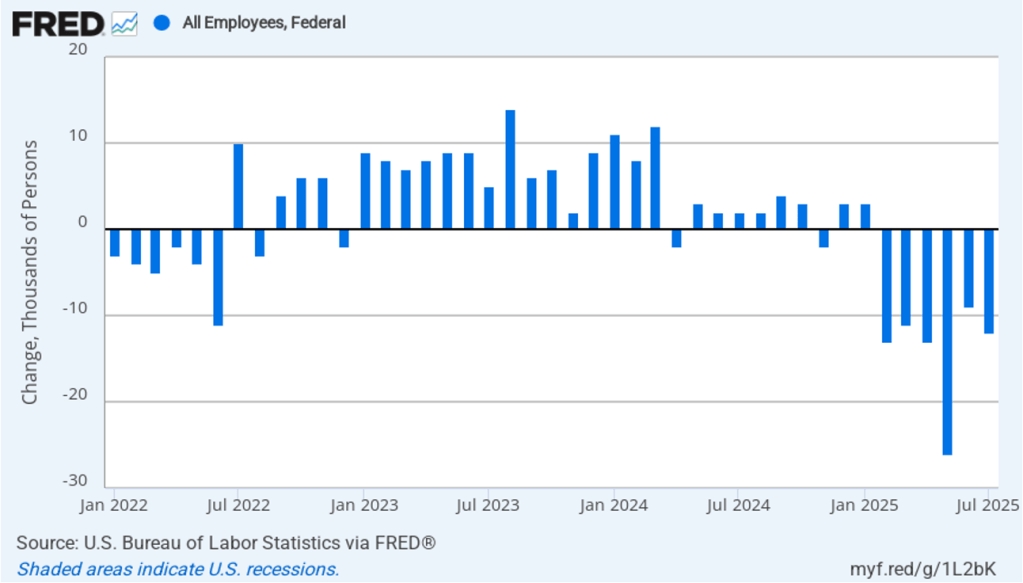
It is still unclear how many federal workers have been laid off since the Trump Administration took office. The establishment survey shows a decline in federal government employment of 15,000 in August and a total decline of 97,000 since the beginning of February 2025. However, the BLS notes that: “Employees on paid leave or receiving ongoing severance pay are counted as employed in the establishment survey.” It’s possible that as more federal employees end their period of receiving severance pay, future jobs reports may report a larger decline in federal employment. To this point, the decline in federal employment has had a small effect on the overall labor market.
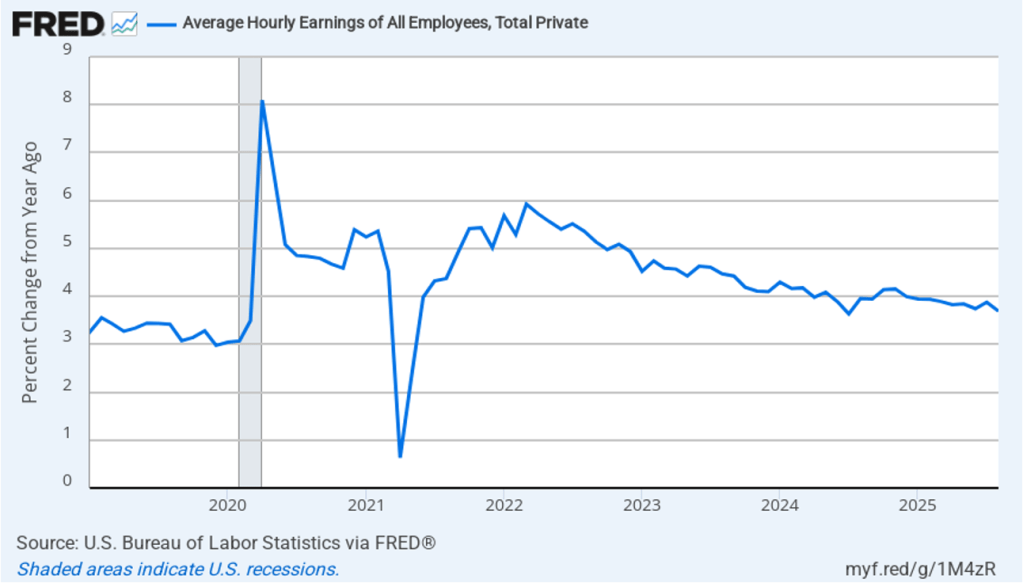
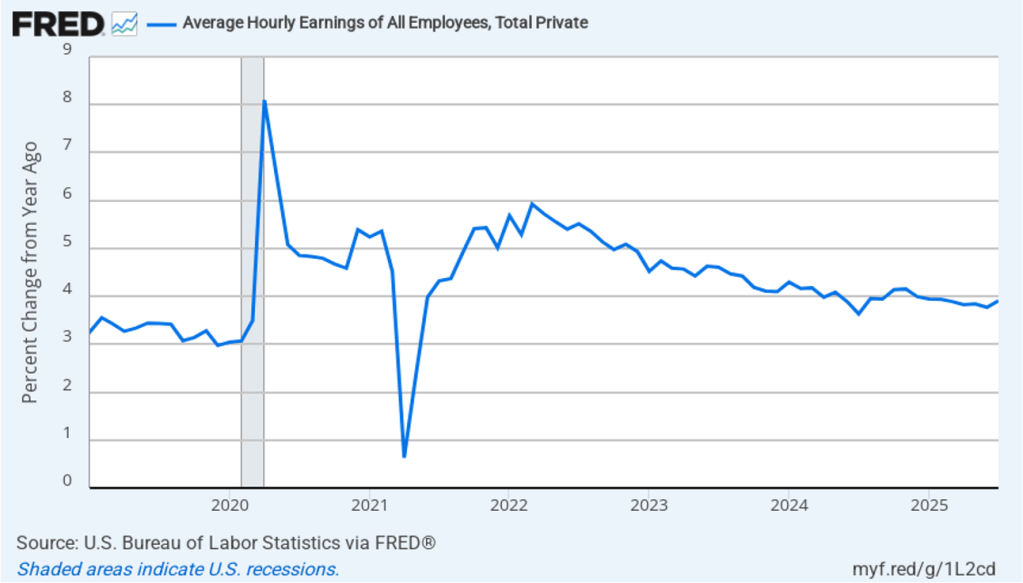
The establishment survey also includes data on average hourly earnings (AHE). As we noted in this post, many economists and policymakers believe the employment cost index (ECI) is a better measure of wage pressures in the economy than is the AHE. The AHE does have the important advantage of being available monthly, whereas the ECI is only available quarterly. The following figure shows the percentage change in the AHE from the same month in the previous year. The AHE increased 3.7 percent in August, down from an increase of 3.9 percent in July.
The following figure shows wage inflation calculated by compounding the current month’s rate over an entire year. (The figure above shows what is sometimes called 12-month wage inflation, whereas this figure shows 1-month wage inflation.) One-month wage inflation is much more volatile than 12-month wage inflation—note the very large swings in 1-month wage inflation in April and May 2020 during the business closures caused by the Covid pandemic. In August, the 1-month rate of wage inflation was 3.3 percent, down from 4.0 percent in July. This slowdown in wage growth may be another indication of a weakening labor market. But one month’s data from such a volatile series may not accurately reflect longer-run trends in wage inflation.
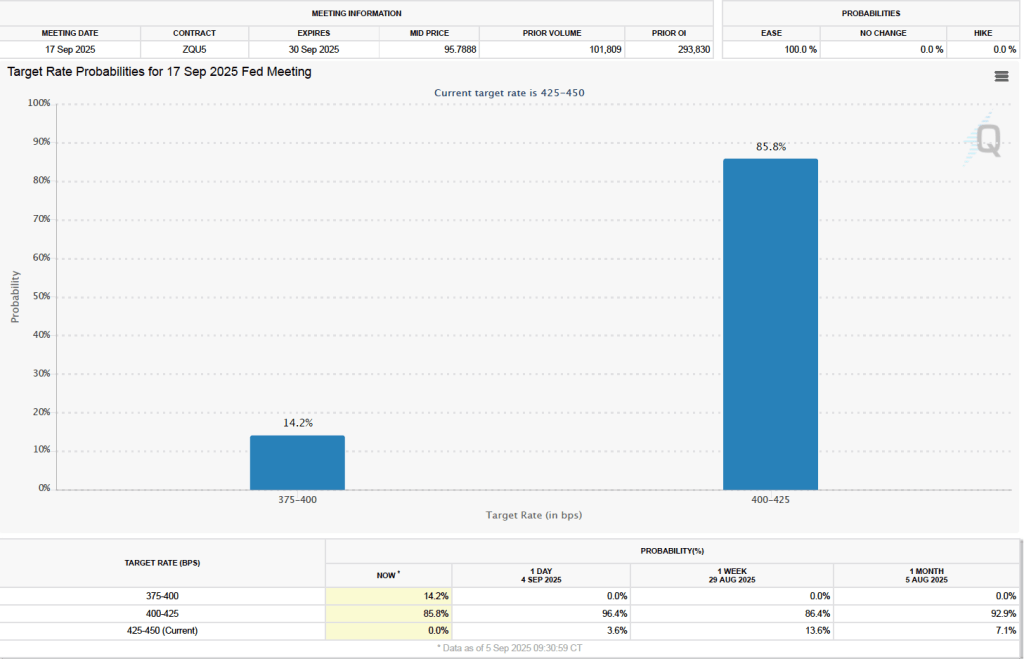
What effect might today’s jobs report have on the decisions of the Federal Reserve’s policymaking Federal Open Market Committee (FOMC) with respect to setting its target for the federal funds rate? One indication of expectations of future changes in the FOMC’s target for the federal funds rate comes from investors who buy and sell federal funds futures contracts. (We discuss the futures market for federal funds in this blog post.) As we’ve noted in earlier blog posts, since the weak July jobs report, investors have assigned a very high probability to the committee cutting its target by 0.25 percentage point (25 basis points) from its current range of 4.25 percent to 4.50 percent at its September 16–17 meeting. This morning, as the following figure shows, investors raised the probability they assign to a 50 basis point reduction at the September meeting from 0 percent to 14.2 percent. Investors are also now assigning a 78.4 percent probability to the committee cutting its target range by at least an additional 25 basis points at its October 28–29 meeting.
In today’s episode, Glenn Hubbard and Tony O’Brien take on three timely topics that are shaping economic conversations across the country. They begin with a discussion on tariffs, exploring how recent trade policies are influencing prices, production decisions, and global relationships. From there, they turn to the independence of the Federal Reserve Bank, explaining why central bank autonomy is essential for sound monetary policy and what risks arise when political pressures creep in. Finally, they shed light on the Bureau of Labor Statistics (BLS), unpacking how its data collection and reporting play a vital role in guiding both public understanding and policymaking.
It’s a lively and informative conversation that brings clarity to complex issues—and it’s perfect for students, instructors, and anyone interested in how economics connects to the real world.
Fed Chair Jerome Powell (left) and Vice Chair Philip Jefferson (photo from federalreserve.gov)
Today (August 12), the Bureau of Labor Statistics (BLS) released its report on the consumer price index (CPI) for July. The following figure compares headline CPI inflation (the blue line) and core CPI inflation (the red line).
The headline inflation rate, which is measured by the percentage change in the CPI from the same month in the previous year, was 2.7 percent in July, unchanged from June.
The core inflation rate,which excludes the prices of food and energy, was 3.0 percent in July, up slightly from 2.9 percent in June. (Note that there was some inconsistency in how the core inflation rate is reported. The BLS, and some news outlets, give the value as 3.1 percent. The unrounded value is 3.0486 percent.)
Headline inflation and core inflation were slightly lower than what economists surveyed had expected.
In the following figure, we look at the 1-month inflation rate for headline and core inflation—that is the annual inflation rate calculated by compounding the current month’s rate over an entire year. Calculated as the 1-month inflation rate, headline inflation (the blue line) declined from 3.5 percent in June to 2.4 percent in July. Core inflation (the red line) increased from 2.8 percent in June to 3.9 percent in July.
The 1-month and 12-month inflation rates are telling somewhat different stories, with 12-month inflation indicating that inflation is stable, although moderately above the Fed’s 2 percent inflation target. The 1-month core inflation rate indicates that inflation may have increased during July.
Of course, it’s important not to overinterpret the data from a single month. The figure shows that the 1-month inflation rate is particularly volatile. Also note that the Fed uses the personal consumption expenditures (PCE) price index, rather than the CPI, to evaluate whether it is hitting its 2 percent annual inflation target.
A key reason for core inflation being significantly higher than headline inflation is that gasoline prices declined by 23.1 percent at an annual rate in June. As shown in the following figure, 1-month inflation in gasoline prices moves erratically—which is the main reason that gasoline prices aren’t included in core inflation.
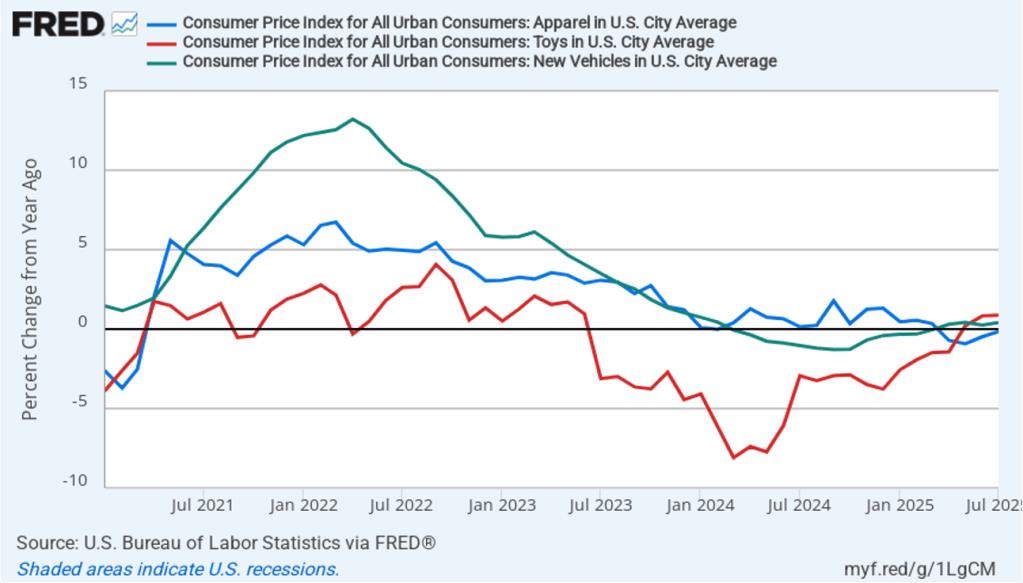
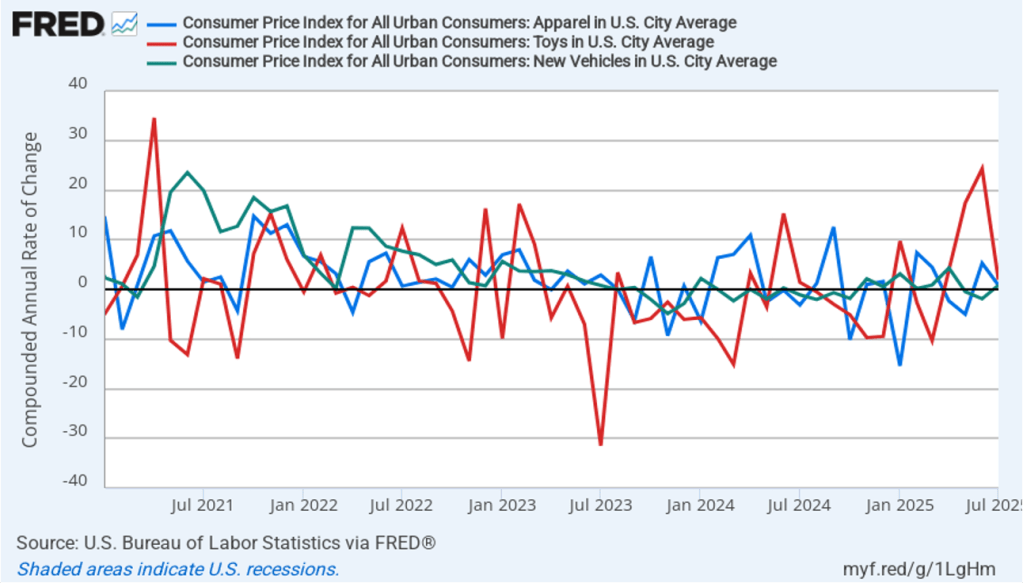
Does the increase in inflation represent the effects of the increases in tariffs that the Trump administration announced on April 2? (Note that many of the tariff increases announced on April 2 have since been reduced) The following figure shows 12-month inflation in three categories of products whose prices are thought to be particularly vulnerable to the effects of tariffs: apparel (the blue line), toys (the red line), and motor vehicles (the green line). To make recent changes clearer, we look only at the months since January 2021. In July, prices of apparel fell, while the prices of toys and motor vehicles rose by less than 1.0 percent.
The following figure shows 1-month inflation in these prices of these products. In July, motor vehicles prices and apparel prices increased by less than 1 percent, while toy prices increased by 1.9 percent after having soared soared by 24.3 percent in June. At least for these three products, it’s difficult to see tariffs as having had a significant effect on inflation in July.
To better estimate the underlying trend in inflation, some economists look at median inflation and trimmed mean inflation.
Median inflation is calculated by economists at the Federal Reserve Bank of Cleveland and Ohio State University. If we listed the inflation rate in each individual good or service in the CPI, median inflation is the inflation rate of the good or service that is in the middle of the list—that is, the inflation rate in the price of the good or service that has an equal number of higher and lower inflation rates.
Trimmed-mean inflation drops the 8 percent of goods and services with the highest inflation rates and the 8 percent of goods and services with the lowest inflation rates.
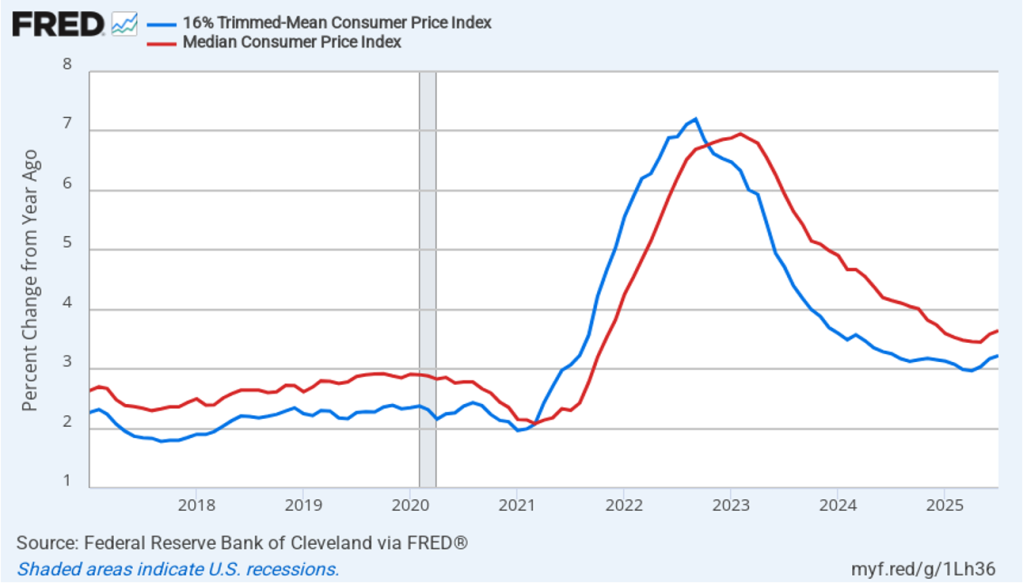
The following figure shows that 12-month trimmed-mean inflation (the blue line) was 3.2 percent in July, unchanged from June. Twelve-month median inflation (the red line) 3.6 percent in July, unchanged from June.
The following figure shows 1-month trimmed-mean and median inflation. One-month trimmed-mean inflation declined from 3.9 percent in June to 2.9 percent in July. One-month median inflation also declined from 4.1 percent in June to 3.7 percent in July. These data indicate that inflation may have slowed in July (the opposite conclusion we noted earlier when discussing 1-month core inflation), while remaining above the Fed’s 2 percent target.
What are the implications of this CPI report for the actions the Federal Reserve’s policymaking Federal Open Market Committee (FOMC) may take at its next meetings? Even before today’s relatively favorable, if mixed, inflation report, the unexpectedly weak jobs report at the beginning of the month (which we discuss in this blog post) made it likely that the FOMC would soon begin cutting its target for the federal funds rate.
Investors who buy and sell federal funds futures contracts assign a probability of 94.3 percent to FOMC cutting its target for the federal funds rate at its September 16–17 meeting by 0.25 (25 basis points) from its current target range of 4.25 percent to 4.50 percent. That probability increased from 85.9 percent yesterday. (We discuss the futures market for federal funds in this blog post.) Investors assign a probability of 61.5 percent to the FOMC cutting its target again by 25 basis points at its October 28–29 meeting, and a probability of 50.3 percent to a third 25 basis point cut at the committee’s December 9–10 meeting.
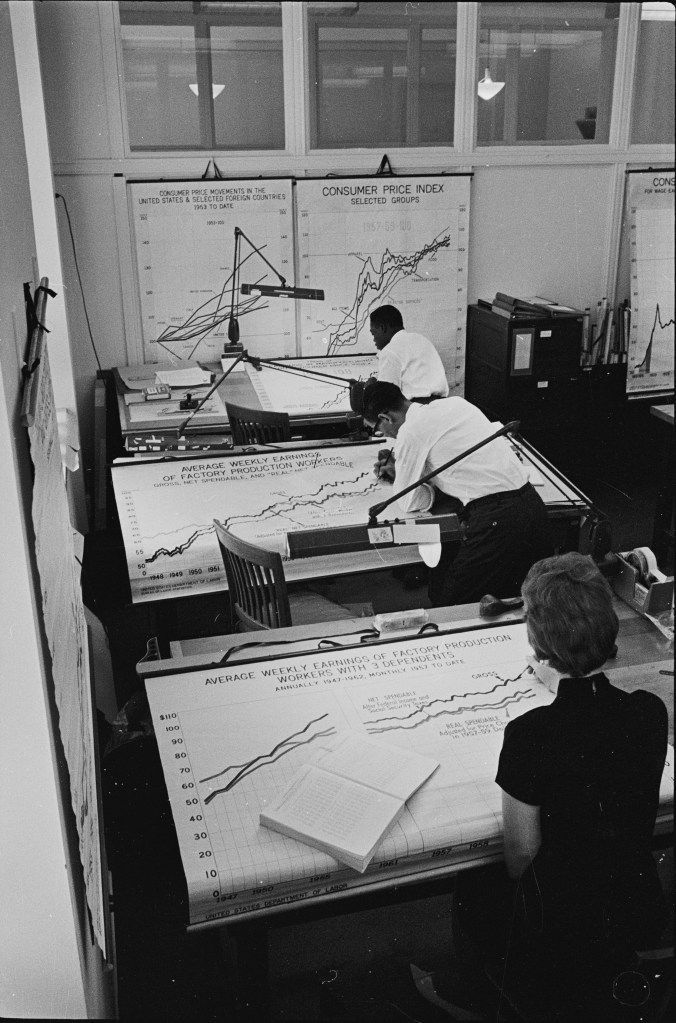
… there were artists in government agencies drawing time series graphs. As we discuss in this recent blog post, the Bureau of Labor Statistics (BLS) has been in the news lately—undoubtedly much more than the people who work there would like.
This post is not about the current controversy but steps back to make a bigger point: The availability of data has increased tremendously from the time when Glenn and Tony began their academic careers. In the 1980s, personal computers were becoming widespread, but the internet had not yet developed to the point where government statistics were available to download. To gather data usually required a trip to the university library to make photocopies of tables in the print publications of the BLS and other government agencies. You then had to enter the data by hand into very crude—by current standards—spreadsheet and statistical software. The software generally had limited graphing capabilities.
How were the time series figures in print government publications generated? The two photos shown above (both from the website of the Library of Congress) show that the figures were hand drawn by artists. The upper photo is from 1962 and the lower photo is from 1971.
Today, most government data is readily available online. The FRED (Federal Reserve Economic Data) site, hosted by economists at the Federal Reserve Bank of St. Louis makes available thousands of data series. We make use of these series in the Data Exercises included in the end-of-chapter problems in our textbooks. The FRED site makes it easy (we hope!) to do these exercises, including by combining or otherwise transforming data series and by graphing them—no artistic ability required!
As we noted in yesterday’s blog post, the latest “Employment Situation” report from the Bureau of Labor Statistics (BLS) included very substantial downward revisions of the preliminary estimates of net employment increases for May and June. The previous estimates of net employment increases in these months were reduced by a combined 258,000 jobs. As a result, the BLS now estimates that employment increases for May and June totaled only 33,000, rather than the initially reported 291,000. According to Ernie Tedeschi, director of economics at the Budget Lab at Yale University, apart from April 2020, these were the largest downward revisions since at least 1979.
The size of the revisions combined with the estimate of an unexpectedly low net increase of only 73,000 jobs in June prompted President Donald Trump to take the unprecedented step of firing BLS Commissioner Erika McEntarfer. It’s worth noting that the BLS employment estimates are prepared by professional statisticians and economists and are presented to the commissioner only after they have been finalized. There is no evidence that political bias affects the employment estimates or other economic data prepared by federal statistical agencies.
Why were the revisions to the intial May and June estimates so large? The BLS states in each jobs report that: “Monthly revisions result from additional reports received from businesses and government agencies since the last published estimates and from the recalculation of seasonal factors.” An article in the Wall Street Journal notes that: “Much of the revision to May and June payroll numbers was due to public schools, which employed 109,100 fewer people in June than BLS believed at the time.” The article also quotes Claire Mersol, an economist at the BLS as stating that: “Typically, the monthly revisions have offsetting movements within industries—one goes up, one goes down. In June, most revisions were negative.” In other words, the size of the revisions may have been due to chance.
Is it possible, though, that there was a more systematic error? As a number of people have commented, the initial response rate to the Current Employment Statistics (CES) survey has been declining over time. Can the declining response rate be the cause of larger errors in the preliminary job estimates?
In an article published earlier this year, economists Sylvain Leduc, Luiz Oliveira, and Caroline Paulson of the Federal Reserve Bank of San Francisco assessed this possibility. Figure 1 from their article illustrates the declining response rate by firms to the CES monthly survey. The figure shows that the response rate, which had been about 64 percent during 2013–2015, fell significantly during Covid, and has yet to return to its earlier levels. In March 2025, the response rate was only 42.6 percent.
The authors find, however, that at least through the end of 2024, the falling response rate doesn’t seem to have resulted in larger than normal revisions of the preliminary employment estimates. The following figure shows their calculation of the average monthly revision for each year beginning with 1990. (It’s important to note that they are showing the absolute values of the changes; that is, negative change are shown as positive changes.) Depite lower response rates, the revisions for the years 2022, 2023, and 2024 were close to the average for the earlier period from 1990 to 2019 when response rates to the CES were higher.
The weak employment numbers correspond to the period after the Trump administration announced large tariff increases on April 2. Larger firms tend to respond to the CES in a timely manner, while responses from smaller firms lag. We might expect that smaller firms would have been more likely to hesitate to expand employment following the tariff announcement. In that sense, it may be unsurprising that we have seen downward revisions of the prelimanary employment estimates for May and June as the BLS received more survey responses. In addition, as noted earlier, an overestimate of employment in local public schools alone accounts for about 40 percent of the downward revisions for those months. Finally, to consider another possibility, downward revisions of employment estimates are more likely when the economy is heading into, or has already entered, a recession. The following figure shows the very large revisisons to the establishment survey employment estimates during the 2007–2010 period.
At this point, we don’t fully know the reasons for the downward employment revisions announced yesterday, although it’s fair to say that they may have been politically the most consequential revisions in the history of the establishment survey.
This morning (August 1), the Bureau of Labor Statistics (BLS) released its “Employment Situation” report (often called the “jobs report”) for July. The data in the report show that the labor market was weaker than expected in July. There have been many stories in the media about firms becoming cautious in hiring as a result of the Trump administration’s tariff increases. Some large firms—including Microsoft, Walt Disney, Walmart, and Proctor and Gamble—have announced layoffs. In addition, real GDP growth slowed during the first half of the year. Nevertheless, until today it appeared that employment growth remained strong.
The jobs report has two estimates of the change in employment during the month: one estimate from the establishment survey, often referred to as the payroll survey, and one from the household survey. As we discuss in Macroeconomics, Chapter 9, Section 9.1 (Economics, Chapter 19, Section 19.1), many economists and Federal Reserve policymakers believe that employment data from the establishment survey provide a more accurate indicator of the state of the labor market than do the household survey’s employment data and unemployment data. (The groups included in the employment estimates from the two surveys are somewhat different, as we discuss in this post.)
According to the establishment survey, there was a net increase of only 73,000 nonfarm jobs during July. This increase was below the increase of 1115,000 that economists surveyed by Factset had forecast. In addition, the BLS revised downward its previous estimates of employment in May and June by a combined 258,000 jobs. (The BLS notes that: “Monthly revisions result from additional reports received from businesses and government agencies since the last published estimates and from the recalculation of seasonal factors.”) The following figure from the jobs report shows the net change in nonfarm payroll employment for each month in the last two years. The figure shows the striking deceleration in job growth during the second quarter of this year.
The unemployment rate increased from 4.1 percent in June to 4.2 percent in July, which is the same rate as economists surveyed had forecast. As the following figure shows, the unemployment rate has been remarkably stable over the past year, staying between 4.0 percent and 4.2 percent in each month since May 2024. In June, the members of the Federal Open Market Committee (FOMC) forecast that the unemployment rate for 2025 would average 4.5 percent. The unemployment rate would have to rise significantly in the second half of the year for that forecast to be accurate.
Each month, the Federal Reserve Bank of Atlanta estimates how many net new jobs are required to keep the unemployment rate stable. Given a slowing in the growth of the working-age population due to the aging of the U.S. population and a sharp decline in immigration, the Atlanta Fed currently estimates that the economy would have to create 111,573 net new jobs each month to keep the unemployment rate stable at 4.2 percent. If this estimate is accurate, continuing monthly net job increases of 73,000 would result in a slowly rising unemployment rate.
As the following figure shows, the monthly net change in jobs from the household survey moves much more erratically than does the net change in jobs from the establishment survey. As measured by the household survey, there was a net decrease of 260,000 jobs in July, following an increase of 93,000 jobs in June. As an indication of the volatility in the employment changes in the household survey note the very large swings in net new jobs in January and February. In any particular month, the story told by the two surveys can be inconsistent with employment increasing in one survey while falling in the other, which was the case this month. (In this blog post, we discuss the differences between the employment estimates in the two surveys.)
The household survey has another important labor market indicator: the employment-population ratio forprime age workers—those aged 25 to 54. In July the ratio declined to 80.4 percent from 80.7 percent in June. The prime-age employment-population ratio is somewhat below the high of 80.9 percent in mid-2024, but is still above what the ratio was in any month during the period from January 2008 to November 2019. Further declines in the prime-age employment-population ratio would be a strong indication of a softening labor market.
It is still unclear how many federal workers have been laid off since the Trump Administration took office. The establishment survey shows a decline in federal government employment of 12,000 in June and a total decline of 84,000 since the beginning of February 2025. However, the BLS notes that: “Employees on paid leave or receiving ongoing severance pay are counted as employed in the establishment survey.” It’s possible that as more federal employees end their period of receiving severance pay, future jobs reports may report a larger decline in federal employment. To this point, the decline in federal employment has been too small to have a significant effect on the overall labor market.
The establishment survey also includes data on average hourly earnings (AHE). As we noted in this post, many economists and policymakers believe the employment cost index (ECI) is a better measure of wage pressures in the economy than is the AHE. The AHE does have the important advantage of being available monthly, whereas the ECI is only available quarterly. The following figure shows the percentage change in the AHE from the same month in the previous year. The AHE increased 3.9 percent in July, up from an increase of 3.8 percent in June.
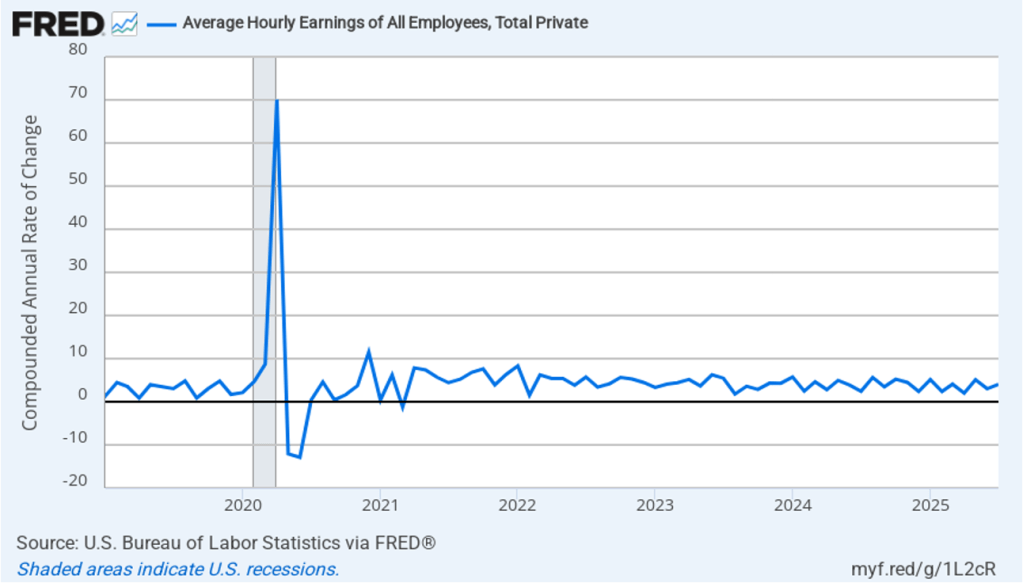
The following figure shows wage inflation calculated by compounding the current month’s rate over an entire year. (The figure above shows what is sometimes called 12-month wage inflation, whereas this figure shows 1-month wage inflation.) One-month wage inflation is much more volatile than 12-month wage inflation—note the very large swings in 1-month wage inflation in April and May 2020 during the business closures caused by the Covid pandemic. In July, the 1-month rate of wage inflation was 4.0 percent, up from 3.0 percent in June. If the July rate of wage inflation is sustained, it would complicate the Fed’s task of achieving its 2 percent target rate of price inflation. But one month’s data from such a volatile series may not accurately reflect longer-run trends in wage inflation.
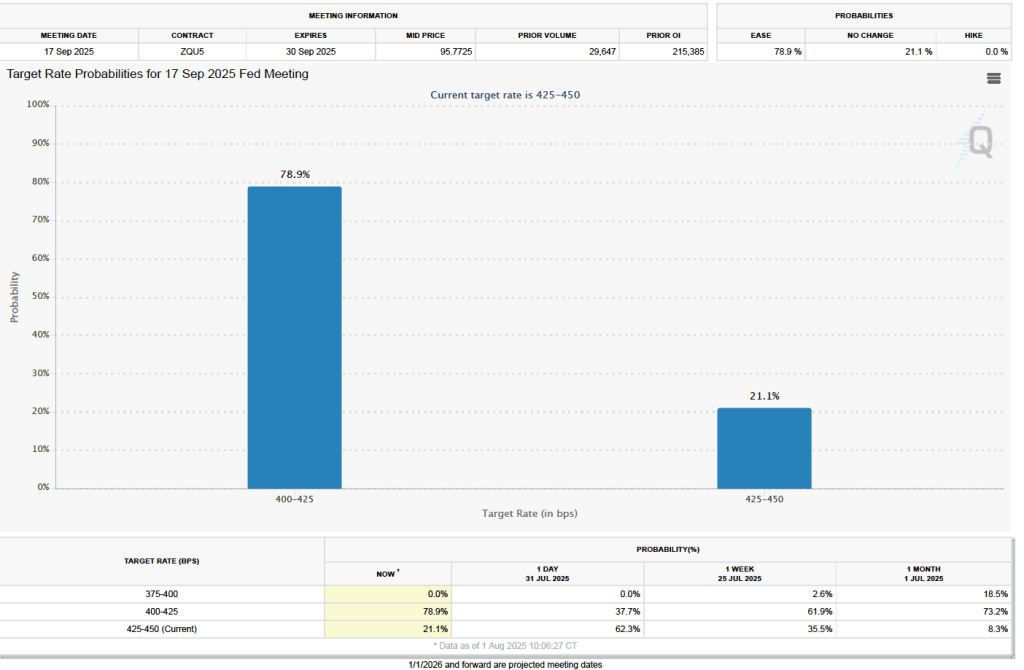
What effect might today’s jobs report have on the decisions of the Federal Reserve’s policymaking Federal Open Market Committee (FOMC) with respect to setting its target for the federal funds rate? One indication of expectations of future changes in the FOMC’s target for the federal funds rate comes from investors who buy and sell federal funds futures contracts. (We discuss the futures market for federal funds in this blog post.) Yesterday, as we noted in a blog post, investors assigned a 60.8 percent probability to the committee keeping its target unchanged at 4.25 percent to 4.50 percent at its September 16–17 meeting. As the following figure shows, there has been a sharp change in investors’ expectations. As of this morning, investors are assigning a 78.9 percent probability to the committee cutting its target by 0.25 percentage point (25 basis points) to a range of 4.00 percent to 4.25 percent.
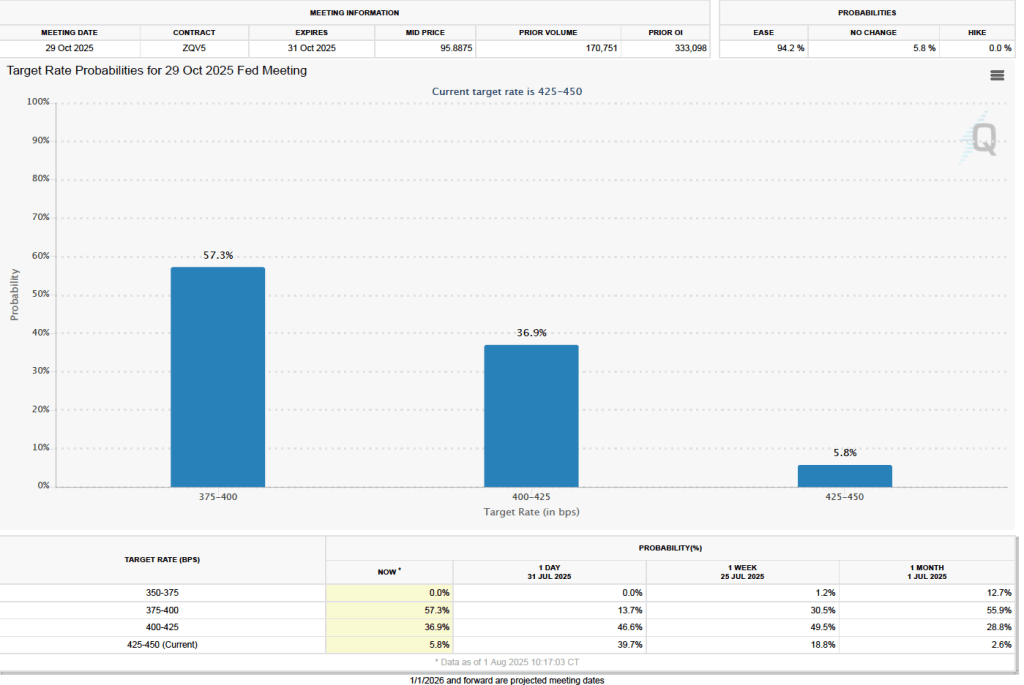
There is a similarly dramatic change in investors’ expectations of the target range for the federal funds rate following the FOMC’s October 28–29 meeting. As the following figure shows, investors now assign a probability of 57.3 percent to the committee lowering its target range to 3.75 percent to 4.00 percent at that meeting. Yesterday, investors assigned a probability of only 13.7 percent to that outcome.