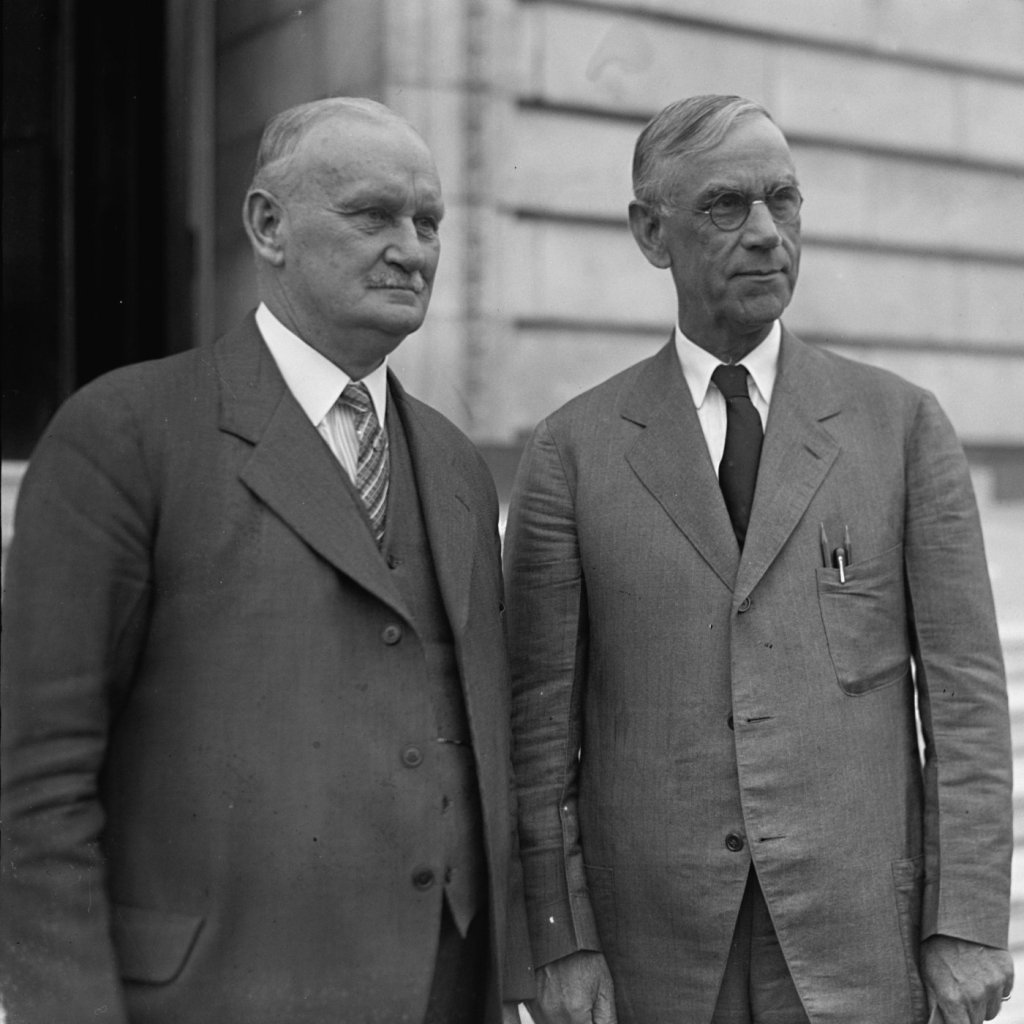
Congressman Willis Hawley of Oregon and Senator Reed Smoot of Utah (Photo from the U.S. Library of Congress via the Wall Street Journal)
Until last week, the most famous example of the United States dramatically increasing tariffs on foreign imports was the Smoot-Hawley Tariff, which was passed by Congress and signed into law by President Herbet Hoover in June 1930. The website of the U.S. Senate describes the bill as “among the most catastrophic acts in congressional history.”
Did the Smoot-Hawley Tariff cause the Great Depression? According to the National Bureau of Economic Research’s business cycle dates, the Great Depression began in August 1929, well before the passage of Smoot-Hawley. By June 1930, industrial production had already declined in the United States by more than 17 percent. So, even if the downturn had ended at that point it would still have been severe. The contraction phase of the Depression continued until March 1933, by which time industrial production had declined more than 51 percent. That was the largest decline in U.S. history
If Smoot-Hawley didn’t cause the Depression, did it contribute to the Depression’s length and severity? Most economists believe that it did by contributing to the collapse of the global trading system, thereby reducing U.S. exports, aggregate demand, and production and employment.
Some years ago, Tony wrote an overview of Smoot-Hawley that discusses its causes and effects in more detail. A key question in assessing the effects of Smoot-Hawley is the extent to which key trading partners of the United States raised their tariffs in retaliation. The clearest case is Canada, which in 1930 was the leading trading partner of the United States. Canadian Prime Minister William Lyon Mackenzie King and the Liberal Party significantly raised tariffs on U.S. imports in explicit retaliation for Smoot-Hawley. This journal article that Tony co-wrote with two Lehigh colleagues discusses the empirical evidence for this conclusion. (The link takes you to the Jstor site. You may be able to read or download the whole article by clicking on the link on that page and entering the name of your college or university.)
The Trump Administration seems to be attempting a major reordering of the global trading system. A Canadian prime minister in the 1930s tried something similar. Richard Bedford Bennett became prime minister after his Conservative Party defeated Mackenzie King’s Liberal Party in the 1935 Canadian election. Bennett hoped to replace the U.S. market with the markets in England and other countries in the British Commonwealth. He argued that, taken together, the Commonwealth countries had sufficient resources to be largely self-sufficient and need not rely on trade with non-Commonwealth countries. In the end, Bennett was unsuccessful for reasons that Tony and a Lehigh colleague explore in this journal article.
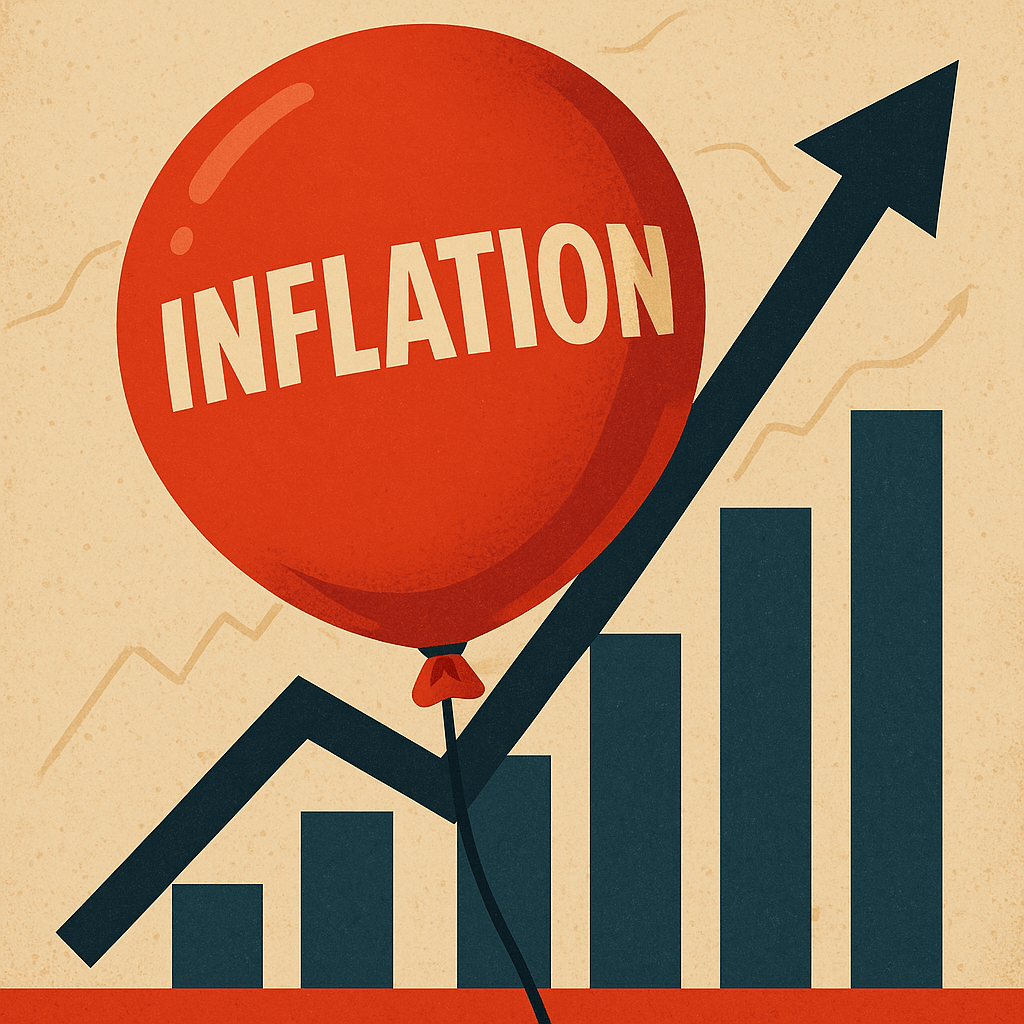
Image generated by ChatGTP-4o illustrating tariffs.
Douglas Irwin, a professor of economics at Dartmouth College, may be the leading historian of international trade in the United States today. Irwin has posted at this link a useful overview of the economics of tariffs.
Irwin’s feed on X offers day-to-day commentary on current developments in the Trump Administration’s rapidly changing tariff policies. At the top of his X feed, you can find a free download of Clashing over Commerce, his 2019 history of U.S. foreign trade policy. At 862 pages, the book is the most thorough and comprehensive account available of the long-running political disputes in the United States over foreign trade.
As we’ve noted in earlier posts, according to the usually reliable GDPNow forecast from the Federal Reserve Bank of Atlanta, real GDP in the first quarter of 2025 will decline by 2.8 percent. This morning (April 4), the Bureau of Labor Statistics (BLS) released its “Employment Situation” report (often called the “jobs report”) for March. The data in the report show no sign that the U.S. economy is in a recession. We should add two caveats, however: 1. The effects of the unexpectedly large tariff increases announced this week by the Trump Administration are not reflected in the data from this report, and 2. at the beginning of a recession the data in the jobs report can be subject to large revisions.
The jobs report has two estimates of the change in employment during the month: one estimate from the establishment survey, often referred to as the payroll survey, and one from the household survey. As we discuss in Macroeconomics, Chapter 9, Section 9.1 (Economics, Chapter 19, Section 19.1), many economists and Federal Reserve policymakers believe that employment data from the establishment survey provide a more accurate indicator of the state of the labor market than do the household survey’s employment data and unemployment data. (The groups included in the employment estimates from the two surveys are somewhat different, as we discuss in this post.)
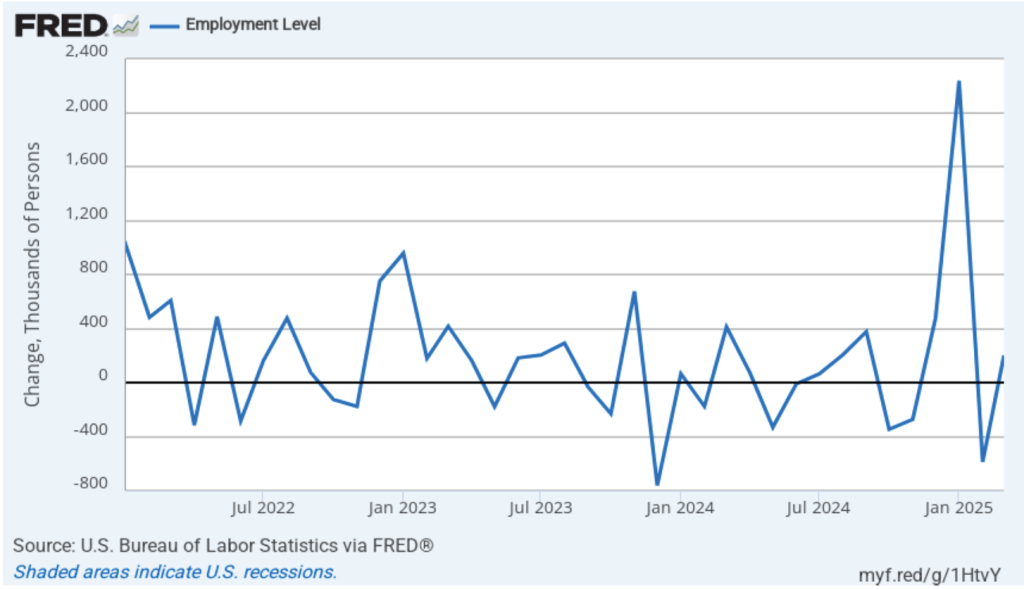
According to the establishment survey, there was a net increase of 228,000 jobs during March. This increase was well above the increase of 140,000 that economists had forecast. Somewhat offsetting this unexpectedly large increase was the BLS revising downward its previous estimates of employment in January and February by a combined 48,000 jobs. (The BLS notes that: “Monthly revisions result from additional reports received from businesses and government agencies since the last published estimates and from the recalculation of seasonal factors.”) The following figure from the jobs report shows the net change in payroll employment for each month in the last two years.
The unemployment rate rose slightly to 4.2 percent in March from 4.1 percent in February. As the following figure shows, the unemployment rate has been remarkably stable in recent months, staying between 4.0 percent and 4.2 percent in each month since May 2024. In March, the members of the Federal Open Market Committee (FOMC) forecast that the unemployment rate for 2025 would average 4.4 percent.
As the following figure shows, the monthly net change in jobs from the household survey moves much more erratically than does the net change in jobs from the establishment survey. As measured by the household survey, there was a net increase of 201,000 jobs in March, following a sharp decrease of 588,000 jobs in February. In any particular month, the story told by the two surveys can be inconsistent with employment increasing in one survey while falling in the other. This month, however, both surveys showed roughly the same net job increase. (In this blog post, we discuss the differences between the employment estimates in the two surveys.)
One concerning sign in the household survey is the fall in the employment-population ratio for prime age workers—those aged 25 to 54. The ratio declined from 80.5 percent in February to 80.4 percent in March. Although the prime-age employment-population is still high relative to the average level since 2001, it’s now well below the high of 80.9 percent in mid-2024. Continuing declines in this ratio would indicate a significant softening in the labor market.
It’s unclear how many federal workers have been laid off since the Trump Administration took office. The establishment survey shows a decline in total federal government employment of 4,000 in March. However, the BLS notes that: “Employees on paid leave or receiving ongoing severance pay are counted as employed in the establishment survey.” It’s possible that as more federal employees end their period of receiving severance pay, future jobs reports may find a more significant decline in federal employment.
The establishment survey also includes data on average hourly earnings (AHE). As we noted in this post, many economists and policymakers believe the employment cost index (ECI) is a better measure of wage pressures in the economy than is the AHE. The AHE does have the important advantage of being available monthly, whereas the ECI is only available quarterly. The following figure shows the percentage change in the AHE from the same month in the previous year. The AHE increased 3.8 percent in March, down from 4.0 percent in February.
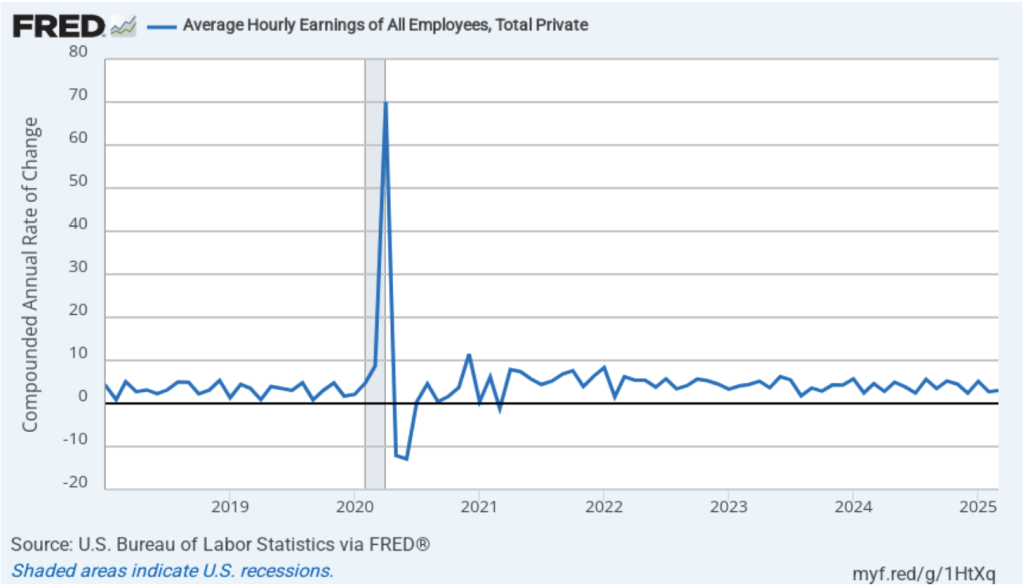
The following figure shows wage inflation calculated by compounding the current month’s rate over an entire year. (The figure above shows what is sometimes called 12-month wage inflation, whereas this figure shows 1-month wage inflation.) One-month wage inflation is much more volatile than 12-month wage inflation—note the very large swings in 1-month wage inflation in April and May 2020 during the business closures caused by the Covid pandemic. The March 1-month rate of wage inflation was 3.0 percent, up from 2.7 percent in February. Whether measured as a 12-month increase or as a 1-month increase, AHE is still increasing somewhat more rapidly than is consistent with the Fed achieving its 2 percent target rate of price inflation.
Taken by itself, today’s jobs report leaves the situation facing the Federal Reserve’s policy-making Federal Open Market Committee (FOMC) largely unchanged. There are some indications that the economy may be weakening, as shown by some of the data in the jobs report and by some of the data incorporated by the Atlanta Fed in its pessimistic nowcast of first quarter real GDP. But the Fed hasn’t yet brought inflation down to its 2 percent annual target.
Looming over monetary policy is the fallout from the Trump Administration’s implementation of unexpectedly large tariff increases. As we note in this blog post, a large unexpected increase in tariffs results in an aggregate supply shock to the economy. In terms of the basic aggregate demand and aggregate supply model that we discuss in Macroeconomics, Chapter 13 (Economics, Chapter 23), an unexpected increase in tariffs shifts the short-run aggregate supply curve (SRAS) to the left, increasing the price level and reducing the level of real GDP.
The effect of the tariffs poses a dilemma for the Fed. With inflation still running above the 2 percent annual target, additional upward pressure on the price level is unwelcome news. The dramatic decline in both stock prices and in the interest rate on the 10-Treasury note indicate that investors are concerned that the tariffs increases may push the U.S. economy into a recession. The FOMC can respond to the threat of a recession by cutting its target for the federal funds rate, but doing so runs the risk of pushing inflation higher.
In a speech today, Fed Chair Jerome Powell stated the following:
“We have stressed that it will be very difficult to assess the likely economic effects of higher tariffs until there is greater certainty about the details, such as what will be tariffed, at what level and for what duration, and the extent of retaliation from our trading partners. While uncertainty remains elevated, it is now becoming clear that the tariff increases will be significantly larger than expected. The same is likely to be true of the economic effects, which will include higher inflation and slower growth. The size and duration of these effects remain uncertain. While tariffs are highly likely to generate at least a temporary rise in inflation, it is also possible that the effects could be more persistent. Avoiding that outcome would depend on keeping longer-term inflation expectations well anchored, on the size of the effects, and on how long it takes for them to pass through fully to prices. Our obligation is to keep longer-term inflation expectations well anchored and to make certain that a one-time increase in the price level does not become an ongoing inflation problem.”
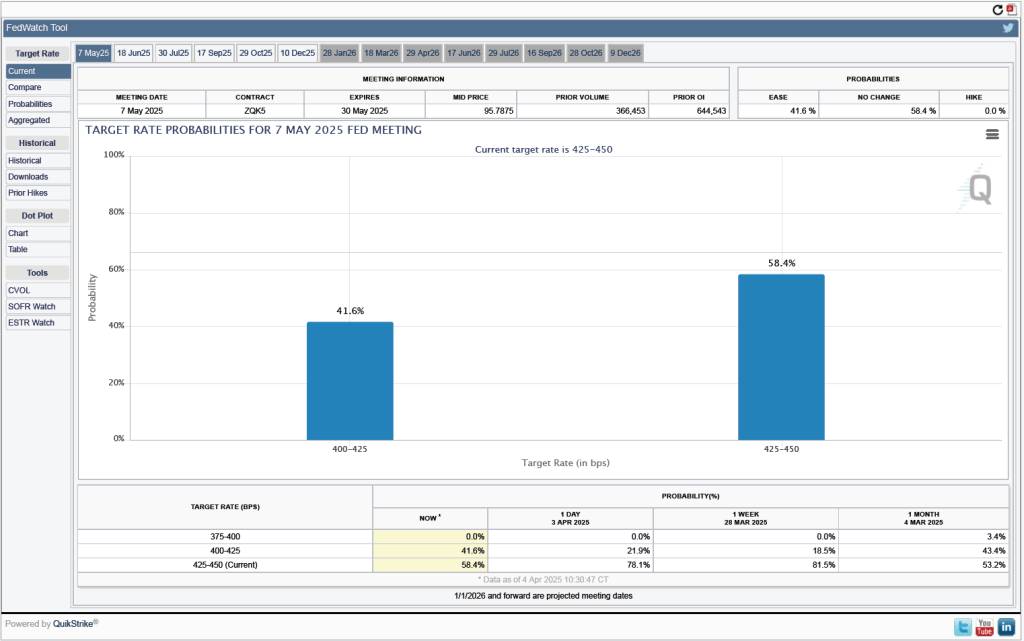
One indication of expectations of future cuts in the target for the federal funds rate comes from investors who buy and sell federal funds futures contracts. (We discuss the futures market for federal funds in this blog post.) The data from the futures market indicate that, despite the potential effects of the surprisingly large tariff increases, investors don’t expect that the FOMC will cut its target for the federal funds rate at its May 6–7 meeting. As shown in the following figure, investors assign a 58.4 percent probability to the committee keeping its target unchanged at 4.25 percent to 4.50 percent at that meeting.
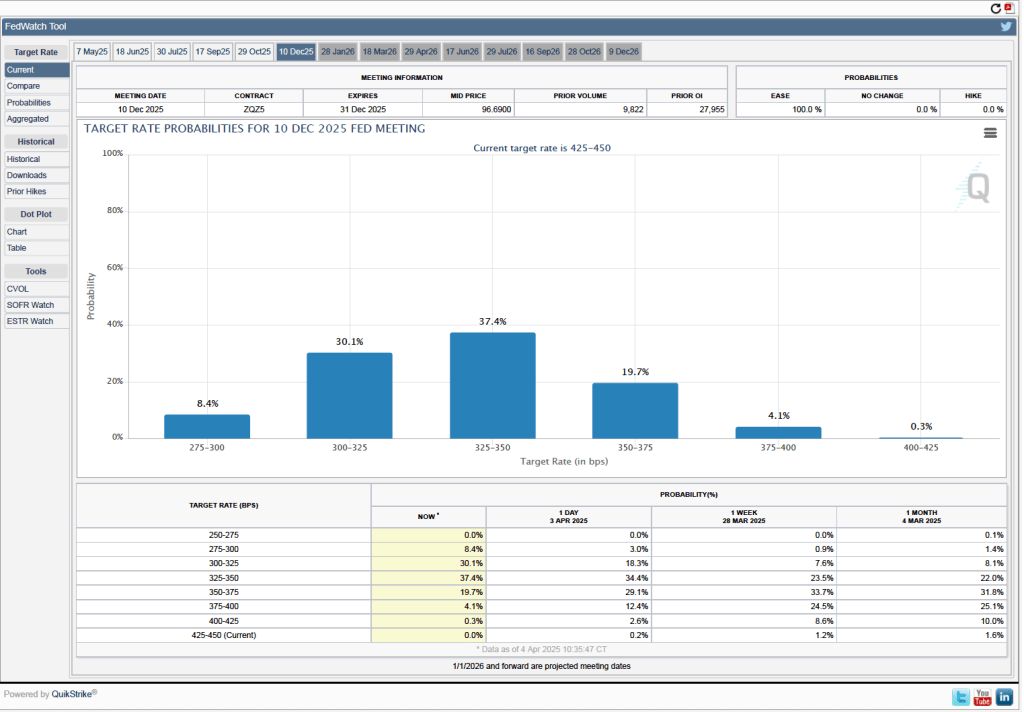
It’s a different story if we look at the end of the year. As the following figure shows, investors now expect that by the end of the FOMC’s meeting on December 9-10, the committee will have implemented at least four 0.25 percentage point (25 basis points) cuts in its target range for the federal funds rate. Investors assign a probability of 75.8 percent that the target range will end the year 3.25 percent to 3.50 percent or lower. At their March meeting, FOMC members projected only two 25 basis point cuts this year—but that was before the announcement of the unexpectedly large tariff increases.
Image generated by ChatGTP-4o of new cars on a dealer’s lot.
This afternoon (April 2), President Donald Trump announced a sweeping increase in tariff rates on imported goods. The increases were by far the largest since the Smoot-Hawley Tariff of 1930. The United States will impose 10 percent across-the-board tariff on all imports, with higher tariffs being imposed on individual countries. Taking into account earlier tariffs, Chinese imports will be subject to a 54 percent tariff. Imports from Vietnam will be subject to a 46 percent tariff, and imports from the countries in the European Union will be subject to a 20 percent tariff.
President Trump’s objectives in imposing the tariffs aren’t entirely clear because he and his advisers have emphasized different goals at different times. The most common objectives the president and his advisers have offered for the tariff increases are these three:
To increase the size of the U.S. manufacturing sector by raising the prices of imported manufactured goods.
To retaliate against barriers that other countries have raised against U.S. exports.
To raise revenue for the federal government.
The effects of the tariffs on the U.S. economy depend in part on whether foreign countries retaliate by raising their tariffs on imports from the United States and on whether, in the future, the president reduces tariffs in exchange for other countries reducing barriers to U.S. imports. For a background discussion of tariffs, see this post. Glenn and Tony discuss tariffs in this podcast, which was recorded on Friday afternoon (March 28). A discussion of the Smoot-Hawley Tariff can be found here.
The following Solved Problem looks at one aspect of the effects of a tariff increase.
Supports:Microeconomics and Economics, Chapter 6, Section 6.3.
Nearly every automobile assembled in the United States contains at least some imported parts. An article on axis.com made the following statement about the effect on U.S. automobile manufacturers of an increase in the tariff on imported auto parts: “If car prices [in the United States] go up, Americans will buy fewer of them, meaning less revenue ….” What assumption is the author of this article making about the demand for new automobiles in the United States?
Solving the Problem
Step 1: Review the chapter material. This problem is about the effect of price increases on a firm’s revenue, so you may want to review the section “The Relationship between Price Elasticity of Demand and Total Revenue.”
Step 2: Answer the question by explaining what must be true of the demand for new automobiles in the United States if an increase in automobile prices results in a decline in the revenue received by automobile producers. This section of Chapter 6 explains how the price elasticity of demand affects the revenue a firm receives following a price increase. A price increase, holding everything else constant that affects the demand for a good, always causes a decline in the quantity demanded. If demand is price inelastic, an increase in price will result in an increase in revenue because the percentage decline in quantity demanded will be smaller than the percentage increase in the price. If demand is price elastic, an increase in price will result in a decrease in revenue because the percentage decline in the quantity demanded will be larger than the percentage increase in price. We can conclude that the author of the article must be assuming that the demand for new automobiles in the United States is price elastic.
Please listen to a podcast discussion recorded just this past Friday between Glenn Hubbard and Tony O’Brien as they discuss tariffs and it’s impact on monetary policy. Also, check out the regular blog posts while on the site! So much has been happening and these posts helps both instructors and students integrate this discussion into their classroom.
Join authors Glenn Hubbard and Tony O’Brien as they discuss the impact of new tariff policies on trade but also on the larger economy. They delve into the Fed, monetary policy, and the impact on inflation. They also discuss some of the history back to when tariffs used to be a high proportion of government revenue and analyze the mix of products that are imported & exported by the US. Should the Fed change its current behavior due to the tariff environment?
Even though Russia and Ukraine were engaged in cease-fire talks with American representatives in Saudi Arabia, apparently with some progress on Tuesday, President Vladimir Putin of Russia has shown little actual commitment to ending his war.
President Trump needs some better cards.
Several weeks ago, the president floated the idea of sanctions and tariffs over Russian imports. But the Kremlin has been dismissive — mainly because the United States imports very little from Russia. Extensive financial and trade sanctions have been in place, most of them for around three years, and they are plainly not enough to bring peace.
Fortunately, there is a simple way to improve the American hand. The administration should impose sanctions on any company or individual — in any country — involved in a Russian oil and gas sale. Russia could avoid these so-called secondary sanctions by paying a per shipment fee to the United States Treasury. The payment would be called a Russian universal tariff, and it would start low but increase every week that passes without a peace deal.
Ships carry most Russian oil and gas to world markets. The secondary sanctions — if Russia does not make the required payments — would fall on all parties to the transaction, including the oil tanker owner, the insurer and the purchaser. Recent evidence confirms that Indian and Chinese entities — whose nations import considerable oil from Russia and have not imposed their own penalties on the Russian economy over the war in Ukraine — do not want to be caught up in American sanctions, making this idea workable. Another factor in its favor: All such tanker traffic is tracked carefully by commercial parties and by U.S. authorities.
Secondary sanctions are powerful tools: Violators can be cut off from the U.S. financial system, and they apply even to transactions that don’t directly involve American companies. They have been used to limit Iranian oil exports and to require that payments for Iranian oil be held in restricted accounts until sanctions were lifted. Our proposal would take this approach to another level. Under our plan, a portion of each Russian oil and gas sale would be paid to the U.S. Treasury until Russia agrees to a peace deal. The goal is to keep Russian oil flowing to global markets but with less money going to the Kremlin. The plan would sap Russia’s ability to continue waging war, and it puts money into U.S. government coffers.
In Russia, fossil fuel revenues and military spending are intertwined, although the country can also draw on its sovereign wealth fund and other sources. Fossil fuel exports provide the main source of dollar revenue for the Kremlin, which depends on hard currency to buy arms and other military supplies from abroad and pay for North Korean soldiers. The country currently exports about $500 million worth of crude oil and petroleum products and $100 million worth of natural gas every day. The Kremlin budgeted a slightly lower amount, almost $400 million per day for military spending in 2025.
The Russia universal tariff would provide money for the United States immediately, unlike the proposed Ukrainian critical minerals fund, which would take years to generate any returns. A fee of $20 per barrel of oil could generate up to $120 million per day (more than $40 billion per year), with additional revenue available if a similar fee is imposed on natural gas. Every dollar the United States collects is a dollar that Russia can’t spend to fund its war.
Ideally, the policy would pressure Russia into negotiations, where its removal could be part of a deal. If not, the United States would still collect billions annually, which could help fund Mr. Trump’s proposed tax cuts. In that scenario, Russia would effectively be helping repaythe U.S. tax dollars used to provide aid to Ukraine to defend itself against Russia’s assault.
For the past three years, Western sanctions and public outcry, including some dockworkers’ refusal to unload Russian oil tankers, have forced Russia to search for new buyers and sell its oil at a discount compared with global prices. The oil discount averaged about $9 per barrel over the previous 12 months and was as high as $35 per barrel in April 2022. Despite receiving lower prices for its oil, Russia has maintained export volumes, ensuring a steady supply in the global oil market.
By imposing secondary sanctions unless the Russia universal tariff is paid, the United States would be taking a cut of the revenues, effectively increasing the discount on Russian oil. Russia’s continued exports, despite facing large discounts over the past three years, suggest it would continue exporting the same volume. That would keep global oil supply stable and help keep oil prices in check. Oil and gas in Russia are inexpensive to produce, and it relies heavily on the income they generate, so it has little option but to keep selling, even at lower prices.
While Mr. Trump can adopt this strategy, Congress can strengthen his negotiating position by passing a bill that puts the Russia universal tariff in place on its own. That would allow the president to protect his lines of communication with Mr. Putin by blaming the measure on Congress. He would also determine if and when he wants to sign the bill, giving him additional leverage over Russia. It’s possible the mere discussion of such a bill could help push the Kremlin toward a peace deal.
Combining secondary sanctions, a strong tool in the U.S. economic kit, with a tarifflike fee could pressure Mr. Putin by threatening his most valuable source of revenues. It would also make it easier for Mr. Trump to deliver on his promise of a lasting peace.
Catherine Wolfram, a former deputy assistant secretary for climate and energy in the Treasury Department, is a professor at M.I.T.’s Sloan School of Management.
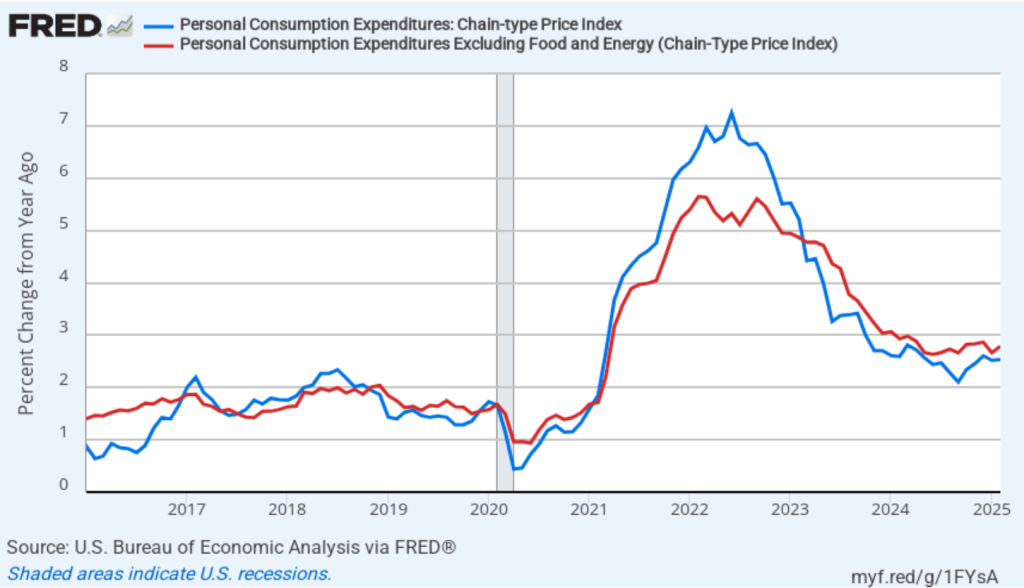
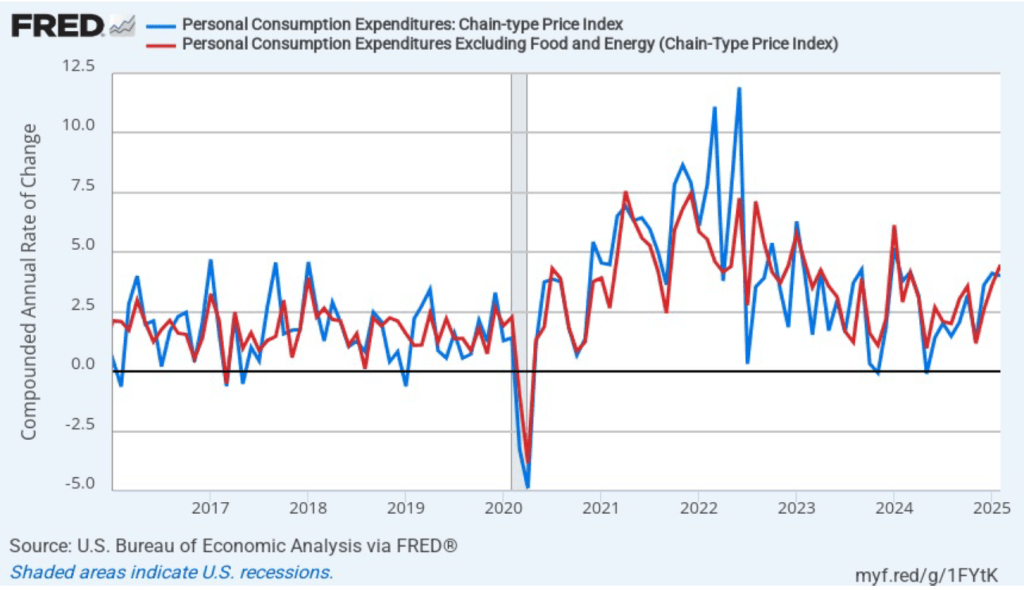
Today (March 28), the BEA released monthly data on the personal consumption expenditures (PCE) price index as part of its “Personal Income and Outlays” report. The Fed relies on annual changes in the PCE price index to evaluate whether it’s meeting its 2 percent annual inflation target. The following figure shows PCE inflation (the blue line) and core PCE inflation (the red line)—which excludes energy and food prices—for the period since January 2016 with inflation measured as the percentage change in the PCE from the same month in the previous year. In February, PCE inflation was 2.5 percent, unchanged since January. Core PCE inflation in January was 2.8 percent, up slightly from 2.7 percent in January. Headline PCE inflation was consistent with the forecasts of economists, but core PCE inflation was higher.
The following figure shows PCE inflation and core PCE inflation calculated by compounding the current month’s rate over an entire year. (The figure above shows what is sometimes called 12-month inflation, while this figure shows 1-month inflation.) Measured this way, PCE inflation declined slightly in February to 4.0 percent from 4.1 percent in January. Core PCE inflation jumped in February to 4.5 percent from 3.6 percent in January. So, both 1-month PCE inflation estimates are running well above the Fed’s 2 percent target. The usual caution applies that 1-month inflation figures are volatile (as can be seen in the figure), so we shouldn’t attempt to draw wider conclusions from one month’s data. But it is definitely concerning that 1-month inflation has risen each month since November 2024.
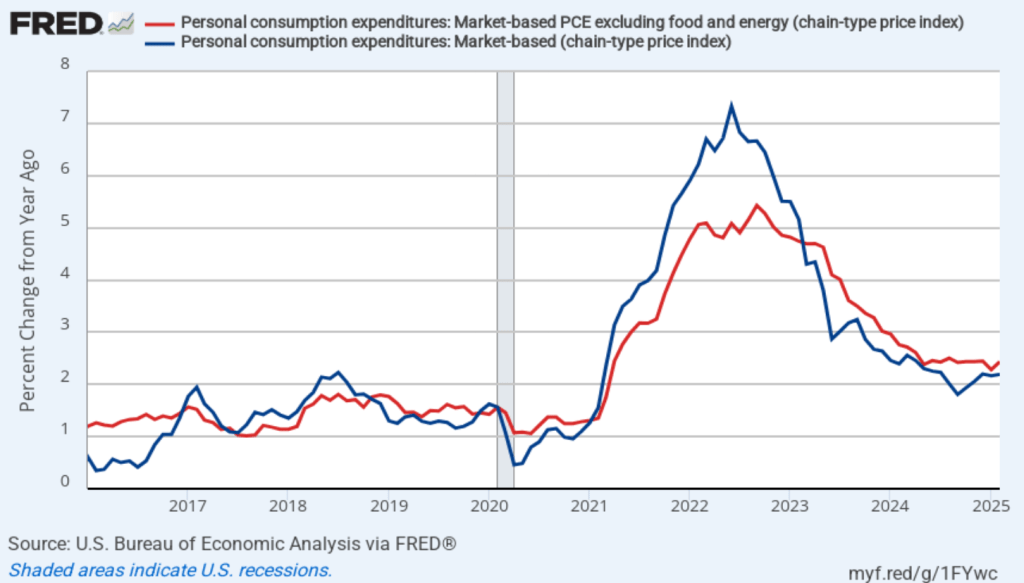
Fed Chair Jerome Powell has noted that inflation in non-market services has been high. Non-market services are services whose prices the BEA imputes rather than measures directly. For instance, the BEA assumes that prices of financial services—such as brokerage fees—vary with the prices of financial assets. So that if stock prices fall, the prices of financial services included in the PCE price index also fall. Powell has argued that these imputed prices “don’t really tell us much about … tightness in the economy. They don’t really reflect that.” The following figure shows 12-month headline inflation (the blue line) and 12-month core inflation (the green line) for market-based PCE. (The BEA explains the market-based PCE measure here.)
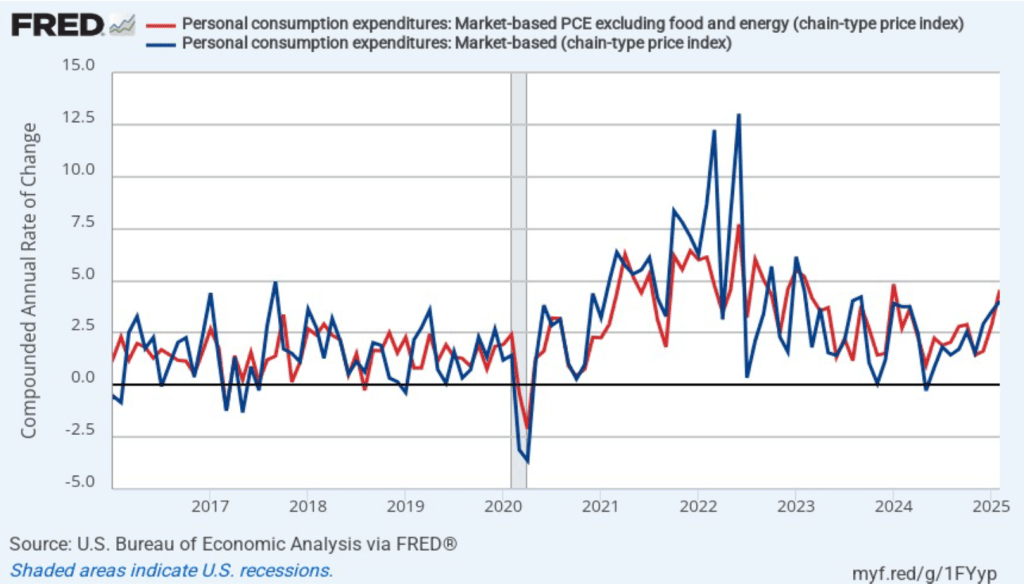
Headline market-based PCE inflation was 2.2 percent in February, and core market-based PCE inflation was 2.4 percent. So, both market-based measures show less inflation in February than do the total measures. In the following figure, we look at 1-month inflation using these measures. The 1-month inflation rates are both very high. Headline market-based inflation was 4.0 percent in February, up from 3.5 percent in January. Core market-based inflation was 4.6 percent in February, up from 2.8 percent in January. Both 1-month market-based inflation members have increased each month since November.
In summary, today’s data don’t show any evidence that inflation is returning to the Fed’s 2 percent annual target. It has to concern the Fed that the 1-month inflation measures have been increasing since November with the latest data showing inflation running far above the Fed’s target. The Fed’s goal of a “soft landing”—with inflation returning to the Fed’s 2 percent target without the economy entering a recession—no longer appears to be on the horizon. The current data seem more consistent with a “no landing” scenario in which the economy avoids a recession but inflation doesn’t return to the Fed’s target. As a result, it seems very unlikely that the Fed’s policymaking Federal Open Market Committee (FOMC) will lower its target for the federal funds rate at its next meeting on May 6-7, unless the unemployment rate jumps or the growth of output slows dramatically.
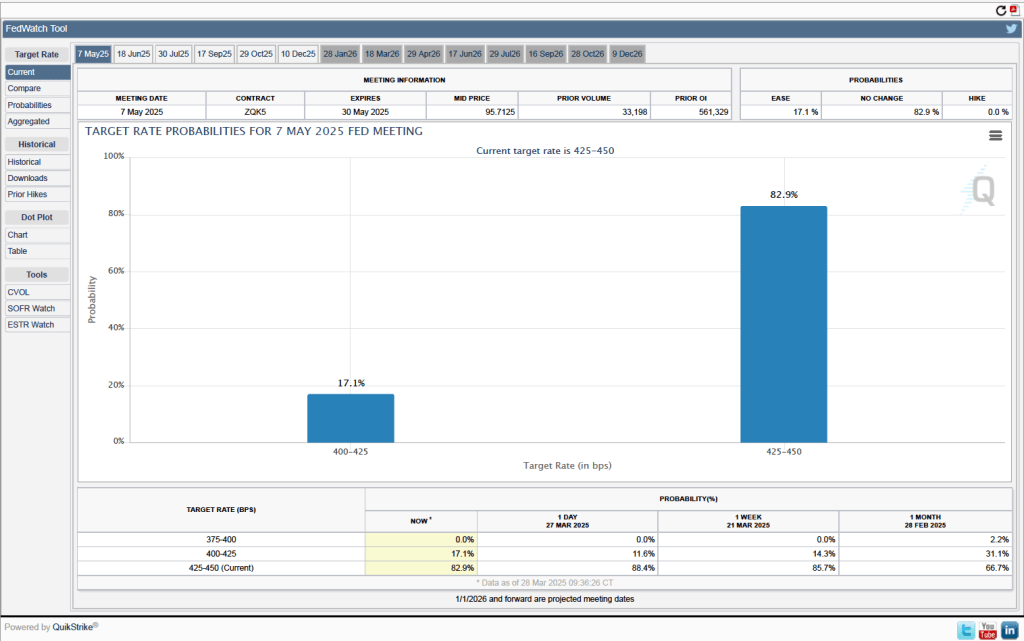
Investors who buy and sell federal funds futures contracts expect that the FOMC will leave its federal funds rate target unchanged at its next meeting. (We discuss the futures market for federal funds in this blog post.) As the following figure shows, investors assign a probability of 82.9 percent to the FOMC leaving its target for the federal funds rate unchanged at the current range of 4.25 percent to 4.50 percent. Investors assign a probability of only 17.1 percent to the FOMC cutting its target by 0.25 percentage point (25 basis points).
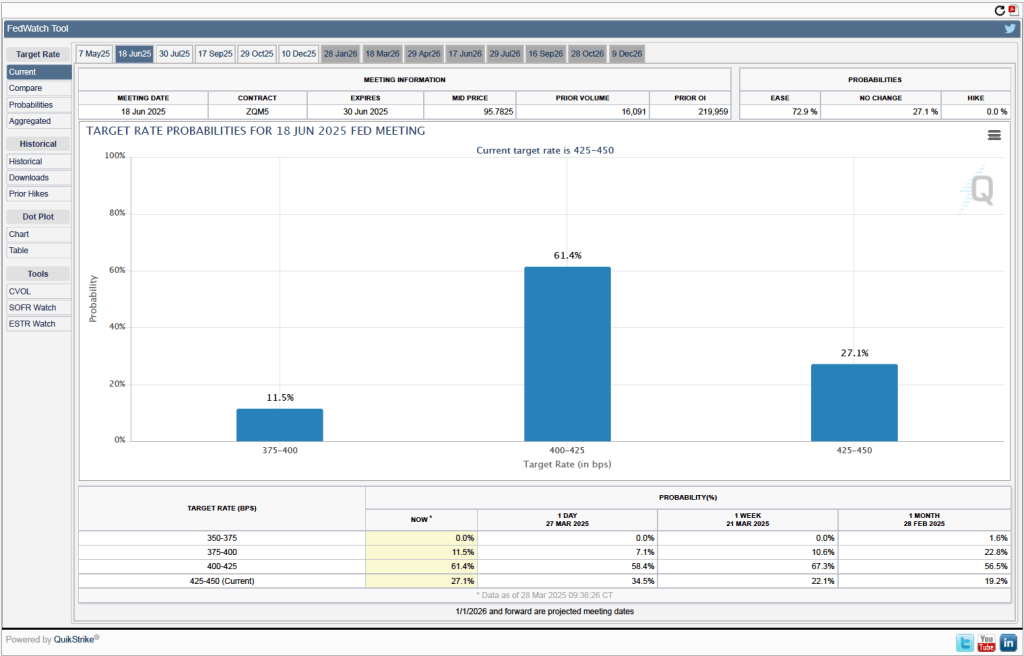
As the following figure shows, investors assign a probability of 72.9 percent percent to the FOMC cutting its target range by at least 25 basis points at its meeting on June 17–18. Despite the bad news on inflation in today’s BEA report, investors assign a zero probability to the FOMC increasing its target range for the federal funds rate to help push inflation back to the Fed’s target. One aspect of the current situation that both policymakers and investors are uncertain of is the effect of the Trump Administration’s new tariffs on the price level. It’s possible that some of the increase in inflation seen in today’s report is the result of tariff increases, but the full extent of the effect will only become evident when the tariffs are fully in place.
A tariff is a tax a government imposes on imports. Since the end of World War II, high-income countries have only occasionally used tariffs as an important policy tool. The following figure shows how the average U.S. tariff rate, expressed as a percentage of the value of total imports, has changed in the years since 1790. The ups and downs in tariff rates reflect in part political disa-greements in Congress. Generally speaking, through the early twentieth century, members of Congress who represented areas in the Midwest and Northeast that were home to many manufacturing firms favored high tariffs to protect those industries from foreign competition. Members of Congress from rural areas opposed tariffs, because farmers were primarily exporters who feared that foreign governments would respond to U.S. tariffs by imposing tariffs on U.S. agricultural exports. From the pre-Civil War period until after World War II the Republicans Party generally favored high tariffs and the Democratic Party generally favored low tariffs, reflecting the economic interests of the areas the parties represented in Congress. (Note: Because the tariffs that the Trump Administration will end up imposing are still in flux, the value for 2025 in the figure is only a rough estimate.)
By the end of World War II in 1945, government officials in the United States and Europe were looking for a way to reduce tariffs and revive international trade. To help achieve this goal, they set up the General Agreement on Tariffs and Trade (GATT) in 1948. Countries that joined the GATT agreed not to impose new tariffs or import quotas. In addition, a series of multilateral negotiations, called trade rounds, took place, in which countries agreed to reduce tariffs from the very high levels of the 1930s. The GATT primarily covered trade in goods. A new agreement to cover services and intellectual property, as well as goods, was eventually negotiated, and in January 1995, the GATT was replaced by the World Trade Organization (WTO). In 2025, 166 countries are members of the WTO.
As a result of U.S. participation in the GATT and WTO, the average U.S. tariff rate declined from nearly 20% in the early 1930s to 1.8% in 2018. The first Trump Administration increased tariffs beginning in 2018, raising the average tariff rate to 2.5%. (The Biden Administration continued most of the increases.) In 2025, the second Trump Administration’s substantial increases in tariffs raised the average tariff rate to the highest level since the 1940s.
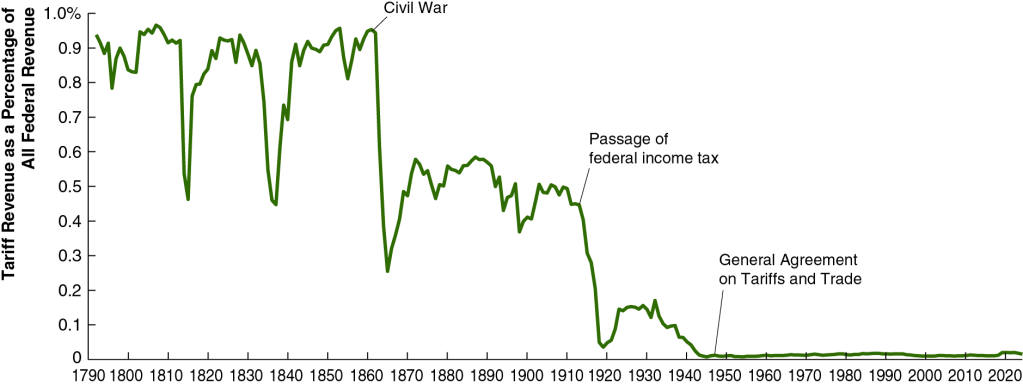
Until the enactment in 1913 of the 16th Amendment to the U.S. Constitution, which allowed for a federal income tax, tariffs were an important source of revenue to the federal government. As the following figure shows, in the early years of the United States, more than 90% of federal government revenues came from the tariff. As tariff rates declined and federal income and payroll taxes increased, tariffs declined to only 2% of federal government revenue. It’s unclear yet how much tariff’s share of federal government revenue will rise as a result of the Trump Administration’s tariff increases.
The effect of tariff increases on the U.S. economy are complex and depend on the details of which tariffs are increased, by how much they are increased, and whether foreign governments raise their tariffs on U.S. exports in response to U.S. tariff increases. We can analyze some of the effects of tariffs using the basic aggregate demand and aggregate supply model that we discuss in Macroeconomics, Chapter 13 (Economics, Chapter 23). We need to keep in mind in the following discussion that small increases in tariffs rates—such as those enacted in 2018—will likely have only small effects on the economy given that net exports are only about 3% or U.S. GDP.
An increase in tariffs intended to protect domestic industries can cause the aggregate demand curve to shift to the right if consumers switch spending from imports to domestically produced goods, thereby increasing net exports. But this effect can be partially or wholly offset if trading partners retaliate by increasing tariffs on U.S. exports. When Congress passed the Smoot-Hawley Tariff in 1930, which raised tariff rates to historically high levels, retaliation by U.S. trading partners contributed to a sharp decline in U.S. exports during the early 1930s.
International trade can increase a country’s production and income by allowing a country to specialize in the goods and services in which it has a comparative advantage. Tariffs shift a country’s allocation of labor, capital, and other resources away from producing the goods and services it can produce most efficiently and toward producing goods and services that other countries can produce more efficiently. The result of this misallocation of resources is to reduce the productive capacity of the country, shifting the long-run aggregate supply curve (LRAS) to the left.
Tariffs raise the prices of U.S. imports. This effect can be partially offset because tariffs increase the demand for U.S. dollars relative to trading partners’ currencies, increasing the dollar exchange rate. Because a tariff effectively acts as a tax on imports, like other taxes its incidence—the division of the burden of the tax between sellers and buyers—depends partly on the price elasticity of demand and the price elasticity of supply, which vary across the goods and services on which tariffs are imposed. (We discuss the effects of demand and supply elasticity on the incidence of a tax in Microeconomics, Chapter 17, Section 17.3.)
About two-thirds of U.S. imports are raw materials, intermediate goods, or capital goods, all of which are used as inputs by U.S. firms. For example, many cars assembled in the United States contain imported parts. The popular Ford F-Series pickup trucks are assembled in the United States, but more than two-thirds of the parts are imported from other countries. That fact indicates that the automobile industry is one of many U.S. industries that depend on global supply chains that can be disrupted by tariffs. Because tariffs on imported raw materials, parts and other intermediate goods, and capital goods increase the production costs of U.S. firms, tariffs reduce the quantity of goods these firms will produce at any given price. In terms of the aggregate demand and aggregate supply model , a large unexpected increase in tariffs results in an aggregate supply shock to the economy, shifting the short-run aggregate supply curve (SRAS) to the left.
Our thanks to Fernando Quijano for preparing the two figures.
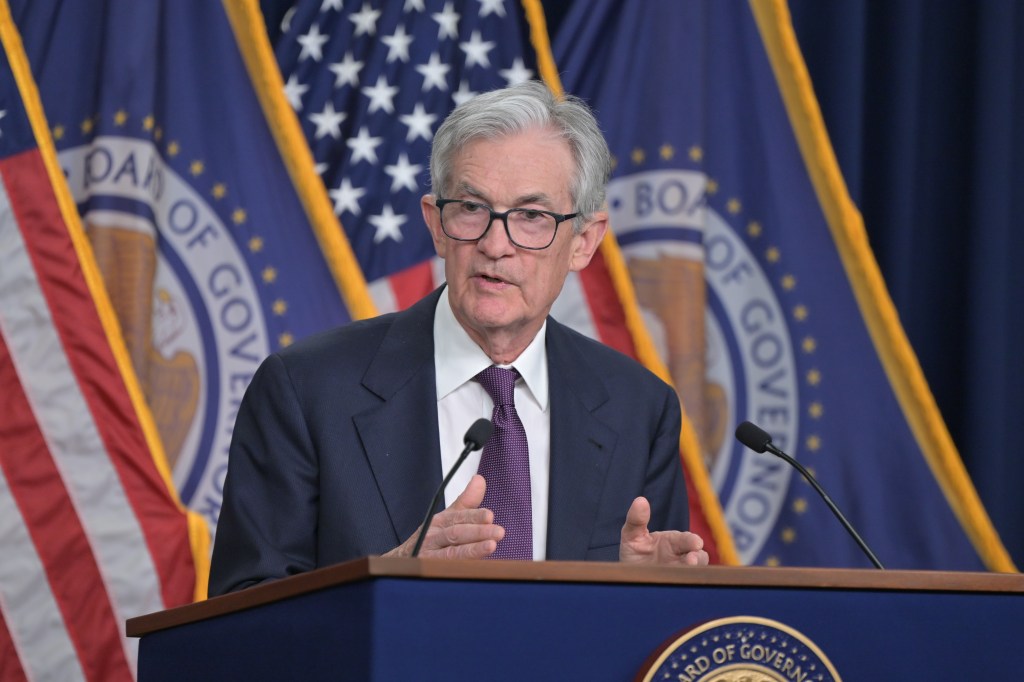
Fed Chair Jerome Powell speaking at a press conference following a meeting of the FOMC (photo from federalreserve.gov)
As they had before their previous meeting, members of the Fed’s Federal Open Market Committee (FOMC) had signaled that the committee was likely to leave its target range for the federal funds rate unchanged at 4.25 percent to 4.50 percent at its meeting today (March 19). In a press conference following the meeting, Fed Chair Jerome Powell noted that the FOMC was facing significant policy uncertainty:
“Looking ahead, the new Administration is in the process of implementing significant policy changes in four distinct areas: trade, immigration, fiscal policy, and regulation…. While there have been recent developments in some of these areas, especially trade policy, uncertainty around the changes and their effects on the economic outlook is high…. We do not need to be in a hurry to adjust our policy stance, and we are well positioned to wait for greater clarity.”
The next scheduled meeting of the FOMC is May 6–7. It seems likely that the committee will also keep its target rate constant at that meeting. Although at his press conference, Powell noted that “Policy is not on a preset course. As the economy evolves, we will adjust our policy stance in a manner that best promotes our maximum employment and price stability goals.” The statement the committee released after the meeting showed that the decision to leave the target rate unchanged was unanimous.
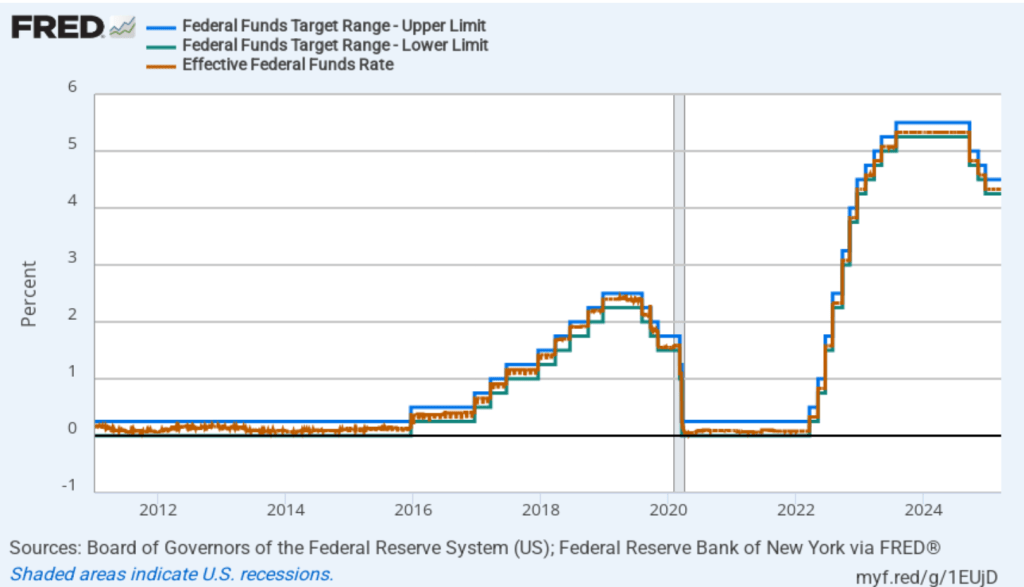
The following figure shows, for the period since January 2010, the upper bound (the blue line) and lower bound (the green line) for the FOMC’s target range for the federal funds rate and the actual values of the federal funds rate (the red line) during that time. Note that the Fed is successful in keeping the value of the federal funds rate in its target range. (We discuss the monetary policy tools the FOMC uses to maintain the federal funds rate in its target range in Macroeconomics, Chapter 15, Section 15.2 (Economics, Chapter 25, Section 25.2).)
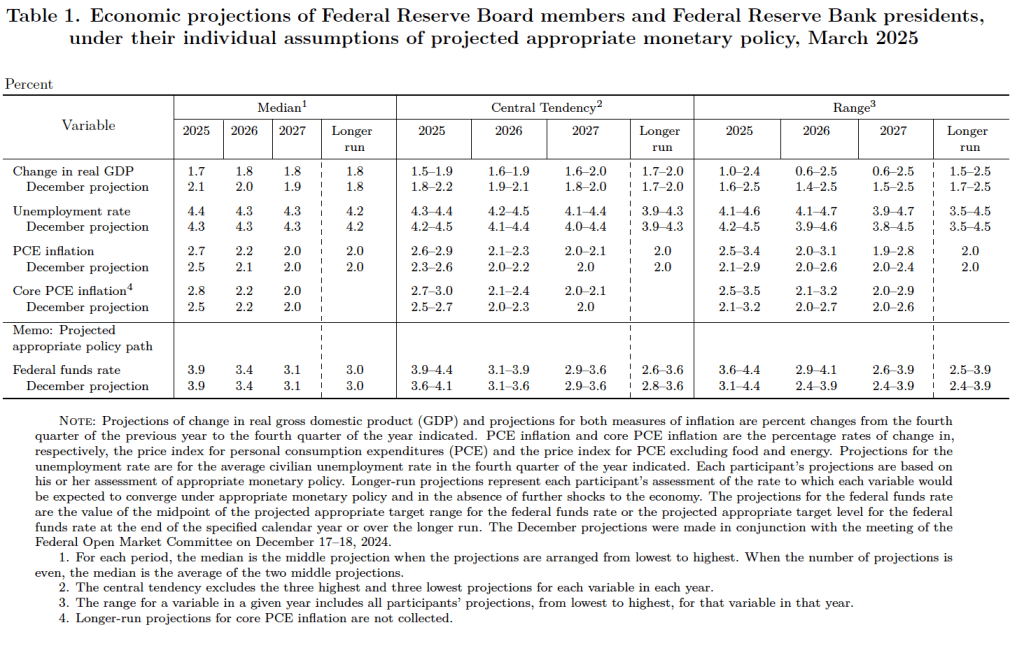
After the meeting, the committee also released a “Summary of Economic Projections” (SEP)—as it typically does after its March, June, September, and December meetings. The SEP presents median values of the 18 committee members’ forecasts of key economic variables. The values are summarized in the following table, reproduced from the release.
There are several aspects of these forecasts worth noting:
Committee members reduced their forecast of real GDP growth for 2025 from 2.1 percent in December to 1.7 percent today. Committee members also slightly increased their forecast of the unemployment rate at the end of 2025 from 4.3 percent to 4.4 percent. (The unemployment rate in February was 4.1 percent.)
Committee members now forecast that personal consumption expenditures (PCE) price inflation will be 2.7 percent at the end of 2025. In December, they had forecast that it would 2.5 percent. Similarly, their forecast of core PCE inflation increased from 2.5 percent to 2.8 percent. The committee does not expect that PCE inflation will decline to the Fed’s 2 percent annual target until 2027.
The committee’s forecast of the federal funds rate at the end of 2025 was unchanged at 3.9 percent. The federal funds rate today is 4.33 percent, which indicates that committee members expect to make two 0.25 percentage point (25 basis points) cuts in their target for the federal funds rate this year. Investors are similarly forecasting two 25 basis point cuts.
During his press conference, Powell indicated that a significant part of the increase in goods inflation during the first two months of the year was likely due to tariffs, although the Fed’s staff was unable to make a precise estimate of how much. Economists generally believe that tariffs cause one-time increases in the price level, rather than persistent inflation. Powell was asked during the press conference whether the FOMC was likely to “look through”—that is, not respond—to the tariffs. Powell replied that it was too early to make that decision, but that: “If there’s an inflation that’s going to go away on its own, it’s not the correct response to tighten policy.”
Powell noted that although surveys show that businesses and consumers expect an increase in inflation, over the long run, expectations are that the inflation rate will return to the Fed’s 2 percent annual target. In that sense, Powell said that expectations of inflation remain “well anchored.”
Barring a sharp slowdown in the growth of real GDP, a significant rise in the unemployment rate, or a significant rise in the inflation rate, the FOMC seems likely to leave its target for the federal funds rate unchanged over the next few months.
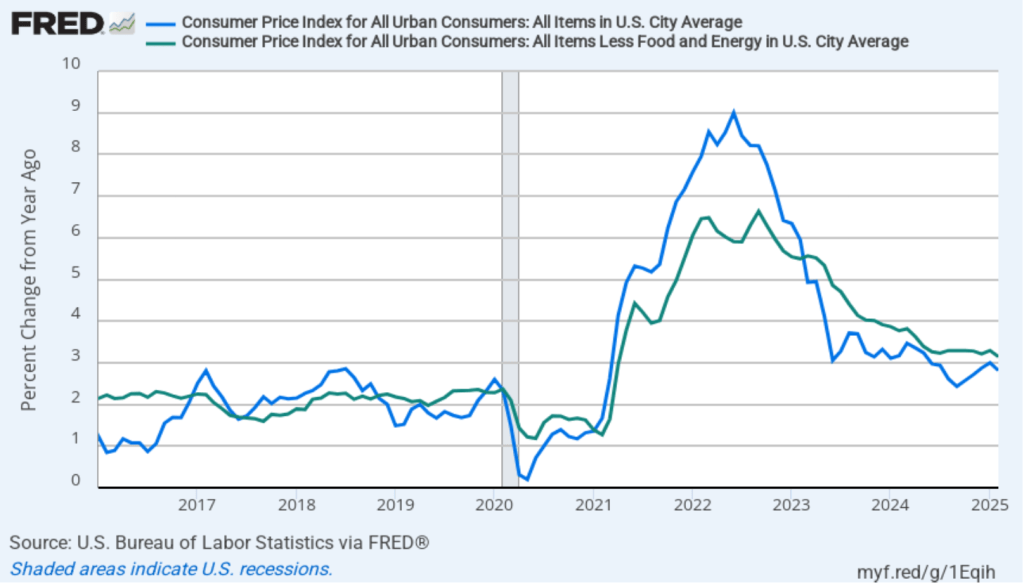
Today (March 12), the Bureau of Labor Statistics (BLS) released its monthly report on the consumer price index (CPI). The following figure compares headline inflation (the blue line) and core inflation (the green line).
The headline inflation rate, which is measured by the percentage change in the CPI from the same month in the previous year, was 2.8 percent in February—down from 3.0 percent in January.
The core inflation rate,which excludes the prices of food and energy, was 3.1 percent in February—down from 3.3 percent in January.
Both headline inflation and core inflation were slightly below what economists surveyed had expected.
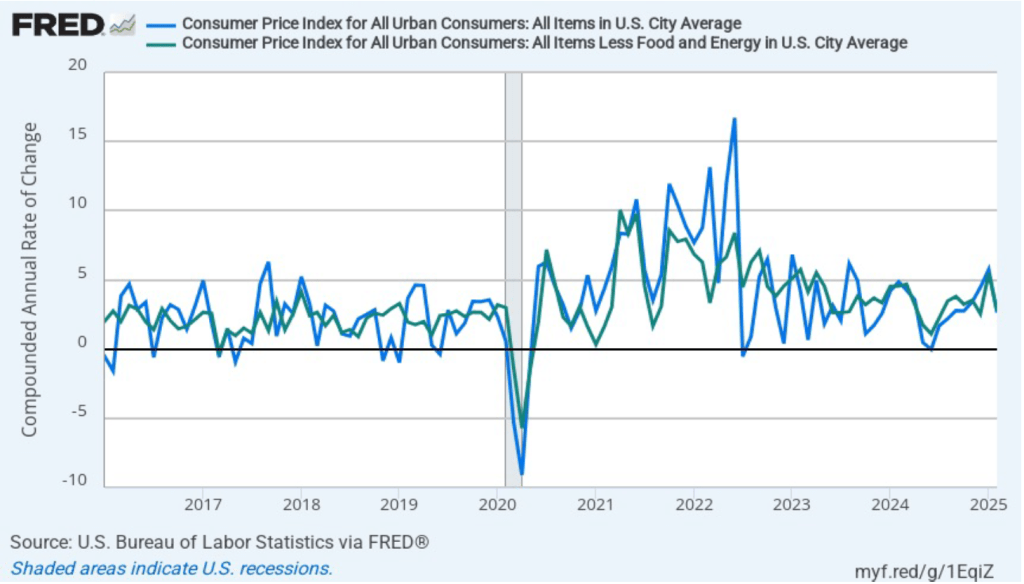
In the following figure, we look at the 1-month inflation rate for headline and core inflation—that is the annual inflation rate calculated by compounding the current month’s rate over an entire year. Calculated as the 1-month inflation rate, headline inflation (the blue line) fell sharply from 5.7 percent in February to 2.6 percent in January. Core inflation (the green line) decreased from 5.5 percent in January to 2.8 percent in January.
Overall, considering 1-month and 12-month inflation together, the most favorable news is the sharp decline in both the headline and the core 1-month inflation rats. But inflation is still running ahead of the Fed’s 2 percent annual inflation target.
Of course, it’s important not to overinterpret the data from a single month. The figure shows that 1-month inflation is particularly volatile. Also note that the Fed uses the personal consumption expenditures (PCE) price index, rather than the CPI, to evaluate whether it is hitting its 2 percent annual inflation target.
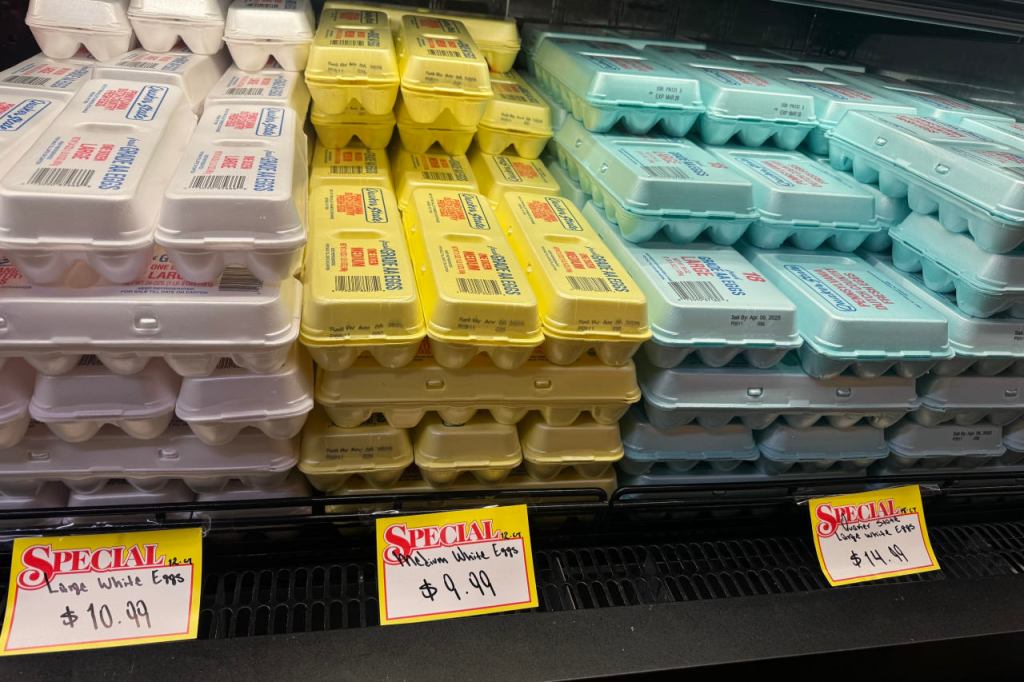
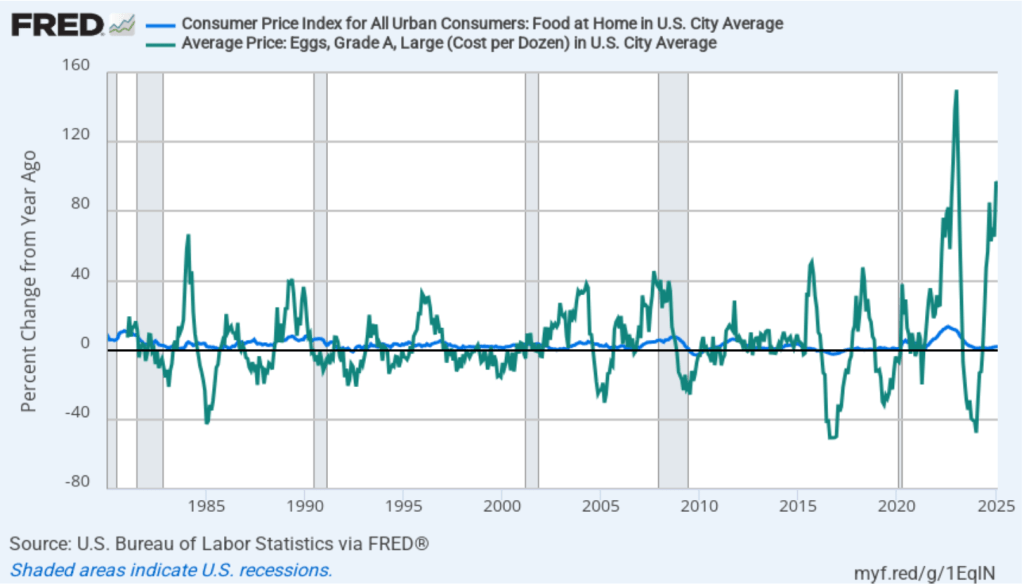
There’s been considerable discussion in the media about continuing inflation in grocery prices. In the following figure the blue line shows inflation in the CPI category “food at home,” which is primarily grocery prices. Inflation in grocery prices was 1.8 percent in February and has been below 2 percent every month since November 2023. Although on average grocery price inflation has been low, there have been substantial increases in the prices of some food items. For instance, egg prices—shown by the green line—increased by 96.8 percent in February. But, as the figure shows, egg prices are usually quite volatile month-to-month, even when the country is not dealing with an epidemic of bird flu.
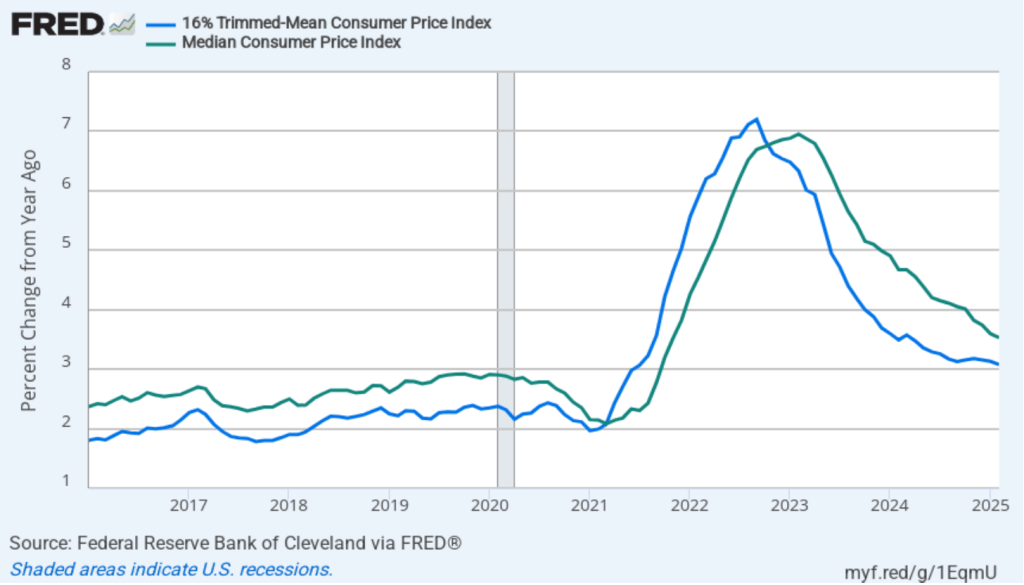
To better estimate the underlying trend in inflation, some economists look at median inflation and trimmed mean inflation.
Median inflation is calculated by economists at the Federal Reserve Bank of Cleveland and Ohio State University. If we listed the inflation rate in each individual good or service in the CPI, median inflation is the inflation rate of the good or service that is in the middle of the list—that is, the inflation rate in the price of the good or service that has an equal number of higher and lower inflation rates.
Trimmed-mean inflation drops the 8 percent of goods and services with the highest inflation rates and the 8 percent of goods and services with the lowest inflation rates.
The following figure shows that 12-month trimmed-mean inflation (the blue line) was 3.1 percent in February, unchanged from January. Twelve-month median inflation (the green line) declined slightly from 3.6 percent in January to 3.5 percent in February.
The following figure shows 1-month trimmed-mean and median inflation. One-month trimmed-mean inflation fell from 5.1 percent in January to 3.3. percent in February. One-month median inflation from 3.9 percent in January to 3.5 percent in February. These data provide confirmation that (1) CPI inflation at this point is likely running higher than a rate that would be consistent with the Fed achieving its inflation target, and (2) inflation slowed somewhat from January to February.
What are the implications of this CPI report for the actions the FOMC may take at its next several meetings? The major stock market indexes rose sharply at the beginning of trading this morning, but then swung back and forth between losses and gains. Inflation being lower than expected may have increased the probability that the FOMC will cut its target for the federal funds rate sooner rather than later. Lower inflation and lower interest rates would be good news for stock prices. But investors still appear to be worried about the extent to which a trade war might both slow economic growth and increase the price level.
Investors who buy and sell federal funds futures contracts still do not expect that the FOMC will cut its target for the federal funds rate at its next two meetings. (We discuss the futures market for federal funds in this blog post.) Today, investors assigned only a 1 percent probability that the Fed’s policymaking Federal Open Market Committee (FOMC) will cut its target from the current 4.25 percent to 4.50 percent range at its meeting next week. Investors assigned a probability of 33.3 percent that the FOMC would cut its target after its meeting on May 6–7. Investors today assigned a probability of 78.6 percent that the committee will cut its target after its meeting on June 17–18. That probability has fallen slightly over the past week.
At his press conference after next Wednesday’s FOMC meeting, Fed Chair Jerome Powell will give his thoughts on the current economic situation.