Image generated by GTP-4o
A tariff is a tax a government imposes on imports. Since the end of World War II, high-income countries have only occasionally used tariffs as an important policy tool. The following figure shows how the average U.S. tariff rate, expressed as a percentage of the value of total imports, has changed in the years since 1790. The ups and downs in tariff rates reflect in part political disa-greements in Congress. Generally speaking, through the early twentieth century, members of Congress who represented areas in the Midwest and Northeast that were home to many manufacturing firms favored high tariffs to protect those industries from foreign competition. Members of Congress from rural areas opposed tariffs, because farmers were primarily exporters who feared that foreign governments would respond to U.S. tariffs by imposing tariffs on U.S. agricultural exports. From the pre-Civil War period until after World War II the Republicans Party generally favored high tariffs and the Democratic Party generally favored low tariffs, reflecting the economic interests of the areas the parties represented in Congress. (Note: Because the tariffs that the Trump Administration will end up imposing are still in flux, the value for 2025 in the figure is only a rough estimate.)

By the end of World War II in 1945, government officials in the United States and Europe were looking for a way to reduce tariffs and revive international trade. To help achieve this goal, they set up the General Agreement on Tariffs and Trade (GATT) in 1948. Countries that joined the GATT agreed not to impose new tariffs or import quotas. In addition, a series of multilateral negotiations, called trade rounds, took place, in which countries agreed to reduce tariffs from the very high levels of the 1930s. The GATT primarily covered trade in goods. A new agreement to cover services and intellectual property, as well as goods, was eventually negotiated, and in January 1995, the GATT was replaced by the World Trade Organization (WTO). In 2025, 166 countries are members of the WTO.
As a result of U.S. participation in the GATT and WTO, the average U.S. tariff rate declined from nearly 20% in the early 1930s to 1.8% in 2018. The first Trump Administration increased tariffs beginning in 2018, raising the average tariff rate to 2.5%. (The Biden Administration continued most of the increases.) In 2025, the second Trump Administration’s substantial increases in tariffs raised the average tariff rate to the highest level since the 1940s.
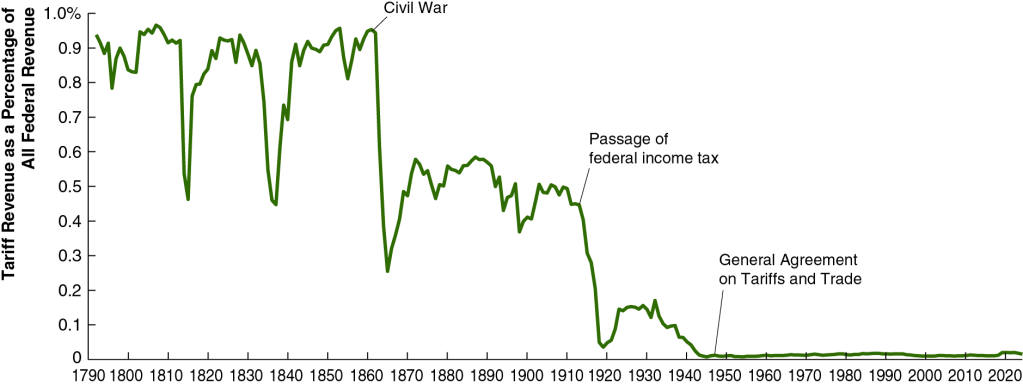
Until the enactment in 1913 of the 16th Amendment to the U.S. Constitution, which allowed for a federal income tax, tariffs were an important source of revenue to the federal government. As the following figure shows, in the early years of the United States, more than 90% of federal government revenues came from the tariff. As tariff rates declined and federal income and payroll taxes increased, tariffs declined to only 2% of federal government revenue. It’s unclear yet how much tariff’s share of federal government revenue will rise as a result of the Trump Administration’s tariff increases.
The effect of tariff increases on the U.S. economy are complex and depend on the details of which tariffs are increased, by how much they are increased, and whether foreign governments raise their tariffs on U.S. exports in response to U.S. tariff increases. We can analyze some of the effects of tariffs using the basic aggregate demand and aggregate supply model that we discuss in Macroeconomics, Chapter 13 (Economics, Chapter 23). We need to keep in mind in the following discussion that small increases in tariffs rates—such as those enacted in 2018—will likely have only small effects on the economy given that net exports are only about 3% or U.S. GDP.
An increase in tariffs intended to protect domestic industries can cause the aggregate demand curve to shift to the right if consumers switch spending from imports to domestically produced goods, thereby increasing net exports. But this effect can be partially or wholly offset if trading partners retaliate by increasing tariffs on U.S. exports. When Congress passed the Smoot-Hawley Tariff in 1930, which raised tariff rates to historically high levels, retaliation by U.S. trading partners contributed to a sharp decline in U.S. exports during the early 1930s.
International trade can increase a country’s production and income by allowing a country to specialize in the goods and services in which it has a comparative advantage. Tariffs shift a country’s allocation of labor, capital, and other resources away from producing the goods and services it can produce most efficiently and toward producing goods and services that other countries can produce more efficiently. The result of this misallocation of resources is to reduce the productive capacity of the country, shifting the long-run aggregate supply curve (LRAS) to the left.
Tariffs raise the prices of U.S. imports. This effect can be partially offset because tariffs increase the demand for U.S. dollars relative to trading partners’ currencies, increasing the dollar exchange rate. Because a tariff effectively acts as a tax on imports, like other taxes its incidence—the division of the burden of the tax between sellers and buyers—depends partly on the price elasticity of demand and the price elasticity of supply, which vary across the goods and services on which tariffs are imposed. (We discuss the effects of demand and supply elasticity on the incidence of a tax in Microeconomics, Chapter 17, Section 17.3.)
About two-thirds of U.S. imports are raw materials, intermediate goods, or capital goods, all of which are used as inputs by U.S. firms. For example, many cars assembled in the United States contain imported parts. The popular Ford F-Series pickup trucks are assembled in the United States, but more than two-thirds of the parts are imported from other countries. That fact indicates that the automobile industry is one of many U.S. industries that depend on global supply chains that can be disrupted by tariffs. Because tariffs on imported raw materials, parts and other intermediate goods, and capital goods increase the production costs of U.S. firms, tariffs reduce the quantity of goods these firms will produce at any given price. In terms of the aggregate demand and aggregate supply model , a large unexpected increase in tariffs results in an aggregate supply shock to the economy, shifting the short-run aggregate supply curve (SRAS) to the left.
Our thanks to Fernando Quijano for preparing the two figures.