Image illustrating stablecoins generated by ChatGTP4-o
Recently, U.S. Treasury Secretary Scott Bessent testified before Congress that the value of stablecoins could reach $2 trillion. In a post on X (formerly Twitter) he stated that “that stablecoins could grow into a $3.7 trillion market by the end of the decade.” Those amounts are far above the $250 billion estimated value of stablecoins in June 2025, yet still small relative to the value of M2—currently $21.9 trillion. But if the value of stablecoins were to rise to $2 trillion, that would be large enough to have a noticeable effect on the U.S. financial system.
As we discuss in Macroeconomics, Chapter 24 and in Money, Banking, and the Financial System, Chapter 2, stablecoins are a type of cryptocurrency—bitcoin is the best-known cryptocurrency—that can be bought and sold for a constant number of units of a currency, usually U.S. dollars. Typically, one stablecoin can be exchanged for one dollar.

Tether CEO Paolo Ardoino (photo from Bloomberg news via the Wall Street Journal)
Firms that issue stablecoins will redeem them in the underlying currency, which—as already noted—is nearly always the U.S. dollar. To make the promise to redeem stablecoins in dollars credible, firms that issue stablecoins hold reserve assets that are safe and highly liquid, such as U.S. Treasury bills or U.S. dollar bank deposits. Tether, which is headquartered in El Salvador, is the largest issuer of stablecoins, with about two-thirds of the market. As with bitcoins and other cryptocurrencies, stablecoins are stored and traded on public blockchains, which are decentralized networks of ledgers that record transactions. This system avoids the use of financial intermediaries—such as banks—which advocates for cryptocurrencies see as a key advantage because it eliminates the possibility that the intermediary might reject the transaction. But it also increases the appeal of stablecoins to people engaged in illegal activities.
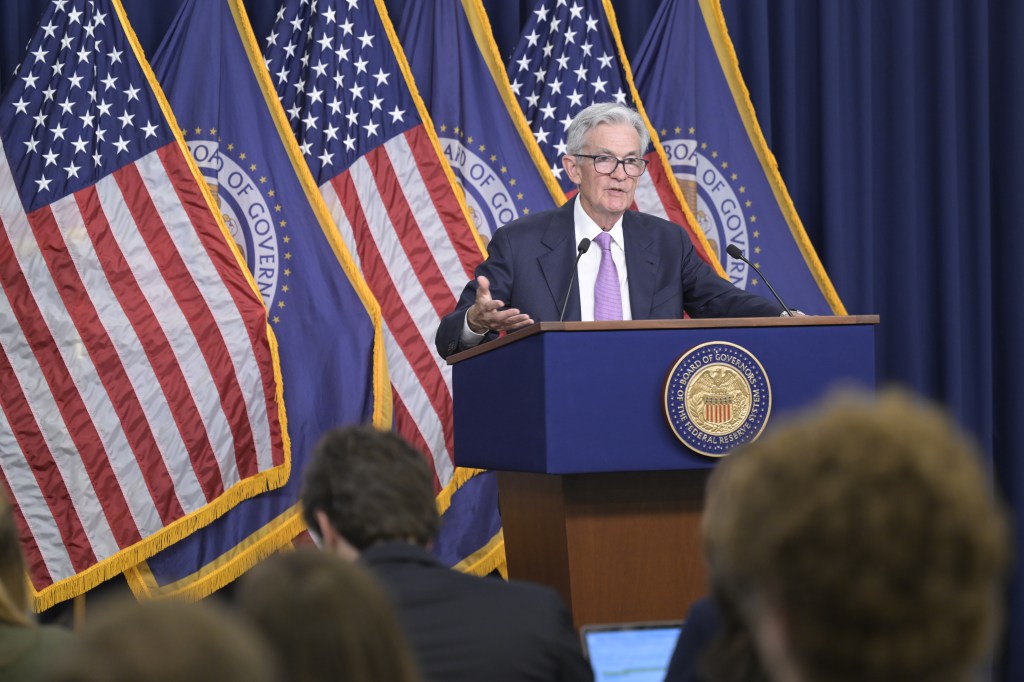
Advocates for stablecoins believe that they can become a digital medium of exchange, which is a role that initially bitcoin was intended to play. The swings in the value of bitcoin turned out to be much larger than most people expected and made that crypto currency unsuitable for use as a medium of exchange. Stablecoins avoid this problem by keeping the value of the stablecoins fixed at one dollar. To this point, though, stablecoins have been primarily used to buy and sell bitcoin and other crypto currencies. As Federal Reserve Governor Christopher Waller put it in a speech earlier this year: “By their tie to the dollar, stablecoins are the medium of exchange and unit of account in the crypto ecosystem.” According to Waller, more than 80 percent of trading in cryptocurrencies is conducted using stablecoins.
One drawback to stablecoins is that firms that issue them charge a fee to redeem them. For instance, Tether requires that a minimum of $100,000 of stablecoins be redeemed and charges a fee of 0.1 percent of the amount redeemed with a minimum charge of $1,000. The redemption fee would be less important if stablecoins are used in large dollar transactions, such as occur in international trade. Advocates for stablecoins believe that they are particularly well suited for use in cross-border transactions because they don’t involve banks, as typically is necessary when firms buy or sell goods or services in foreign countries. The fees stablecoin issuers charge are generally lower than the fees banks charge for foreign exchange transactions.
The main source of profit for firms issuing stablecoins is the interest they earn on the assets they use to back the stablecoins they issue. Note, though, that firms issuing stablecoins have an incentive to buy riskier assets in order to increase the return on the stablecoins they issue. The incentives are similar to those banks face in investing depositors’ funds in assets that are riskier than the depositors would prefer. However, the risk that commercial banks take on is limited by bank regulations, which don’t yet apply to firms issuing stablecoins, although they may soon.
On June 17, the U.S. Senate moved to provide a regulatory framework for stablecoins by passing the Guiding and Establishing National Innovation for U.S. Stablecoins Act (Genius Act). The act requires that firms issuing stablecoins in the United States back them 100 percent with a limited number of reserve assets: dollar deposits in banks, Treasury securities that mature in 93 days or less, repurchase agreements backed by Treasuries (we discuss repurchase agreements in Macroeconomics, Chapter 15; Economics, Chapter 25; and Money, Banking, and the Financial System, Chapter 10), and money market funds that invest in eligible Treasury securities and repurchase agreements. Issuers of stablecoins will be subject to audits by U.S. federal regulators. To become law, the Genius Act must also be passed by the U.S. House and signed by President Trump.
Passage of the Genius Act would potentially provide a regulatory framework that would reassure users that the stablecoins they hold can be readily redeemed for dollars. Passage is also expected to lead some large retail firms, such as Walmart and Amazon, to issue stablecoins that could be used to make purchases on their sites. If enough consumers are willing to use stablecoins, these large retailers could save the fees they currently pay to credit card companies. In addition, stablecoin transactions can be cleared instantly, as opposed to the several days it can take for credit card payments to clear. Why would a consumer want to use stablecoin rather than a credit card to pay for something? Apart from the familiarity of using credit cards, the cards often provide rewards, such as points that can be redeemed for airline tickets or hotel stays. To attract consumers, stablecoin issuers would likely have to offer similar rewards to consumers who use stablecoins to make purchases.
As Waller notes, it will likely take years before consumers and firms routinely use stablecoins for day-to-day transactions. Today, very few retail firms are equipped to accept stablecoins and very few consumers own stablecoins.
Passage of the Genius Act would pose potential problems for Tether. Tether has held a wide range of reserve assets to back its stablecoins, including bitcoin and precious metals. It has also not been willing to be fully audited. Either Tether would have to change its business model to fit the requirements of the Genius Act or it would have to issue a separate stablecoin that would be used only in the United States and would meet the Genius Act requirements.
We noted earlier that Treasury Secretary Bessent believes that over the next few years, the value of stablecoins could increase to several trillions dollars. If that happens, the demand for Treasury securities would increase substantially as firms issuing stablecoins accumulated reserve assets. The result could be higher prices on Treasury securities and lower interest rates, which would eventually reduce the interest payments the Treasury makes on the federal government’s debt.
Finally, as we note in the text, Barry Eichengreen of the University of California, Berkeley as been a notable skeptic of stablecoins. As he wrote back in 2018, when the idea of stablecoins was just beginning to be widely discussed, when someone exchanges a dollar for a stablecoin, “one of us then will have traded a perfectly liquid dollar, supported by the full faith and credit of the U.S. government, for a cryptocurrency with questionable backing that is awkward to use. This exchange may be attractive to money launderers and tax evaders, but not to others.”

Could issuers of stablecoins be subject to runs like the one that led to the failure of Silicon Valley Bank in the spring of 2023?
In a recent opinion column in the New York Times, Eichengreen wrote that he is concerned about the possibility of runs on stablecoins. As we discuss in Macroeconomics, Chapter 14, and in Money, Banking, and the Financial Systems, Chapter 10, a commercial bank can be subject to a run if the bank’s depositors believe that the value of the bank’s assets are no longer sufficient to pay off the bank’s depositors. As we discuss in this blog post, Silocon Valley Bank experienced a run in the spring of 2023 that affected several other banks. Runs on commercial banks are unusual in the United States because of deposit insurance and the willingness of the Federal Reserve to act as lender of last resort to banks suffering liquidity problems. Eichengreen raises the question of whether stablecoins could experience runs if holders of the stablecoins come to doubt that the value of issuers’ reserve assets is sufficient to redeem all the coins.
Although the Genius Act provides for regulation of stablecoin issuers, Eichengreen believes that if enough firms begin issuing stablecoins, it’s likely that at some point one of them will experience a decline in the value of its reserve assets, which will cause a run. If the run spreads from one issuer to many in a process called contagion, stablecoin issuers will have to sell reserve assets, including Treasury securities. The result could be a sharp fall in the prices of those asset and an increase in interest rates. It’s possible that the outcome could be a wider financial panic and a deep recession. To head off that possibility, the Federal Reserve might feel obliged to intervene to save some, possibly many, stablecoin issuers from failing. The result could be that taxpayer dollars would flow to firms issuing stablecoins, which would likely cause a significant political backlash.
Many people see stablecoins as an exciting development in the financial system. But, as we’ve noted, there still remain some substantial roadblocks in the way of stablecoins becoming an important means of transacting business in the U.S. economy.