Image generated by ChatGPT
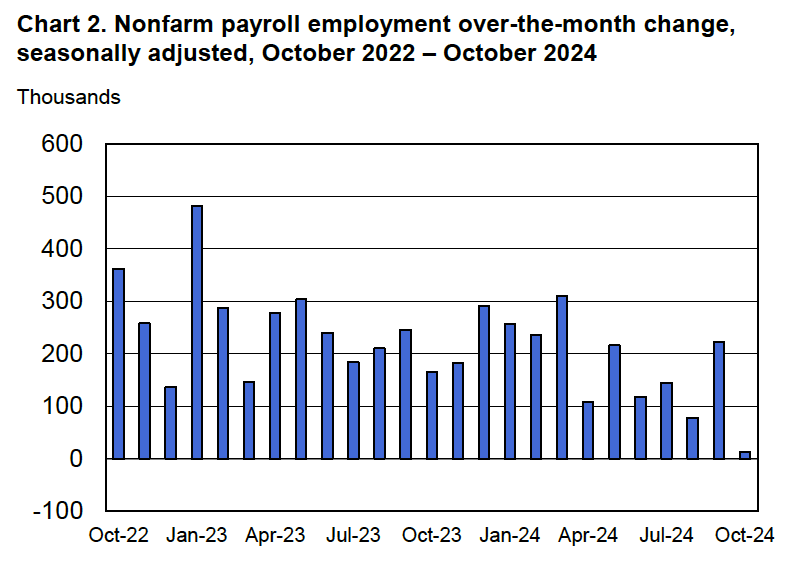
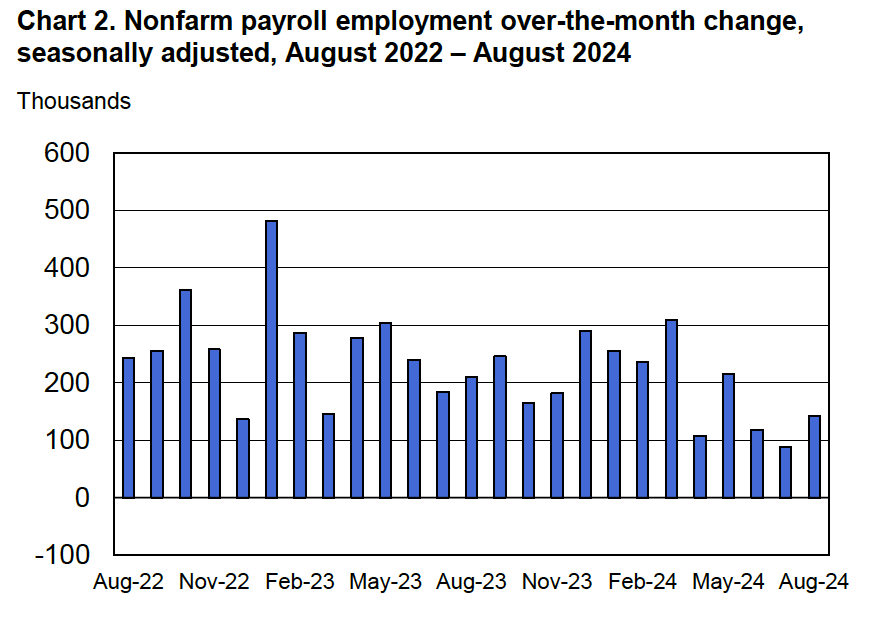
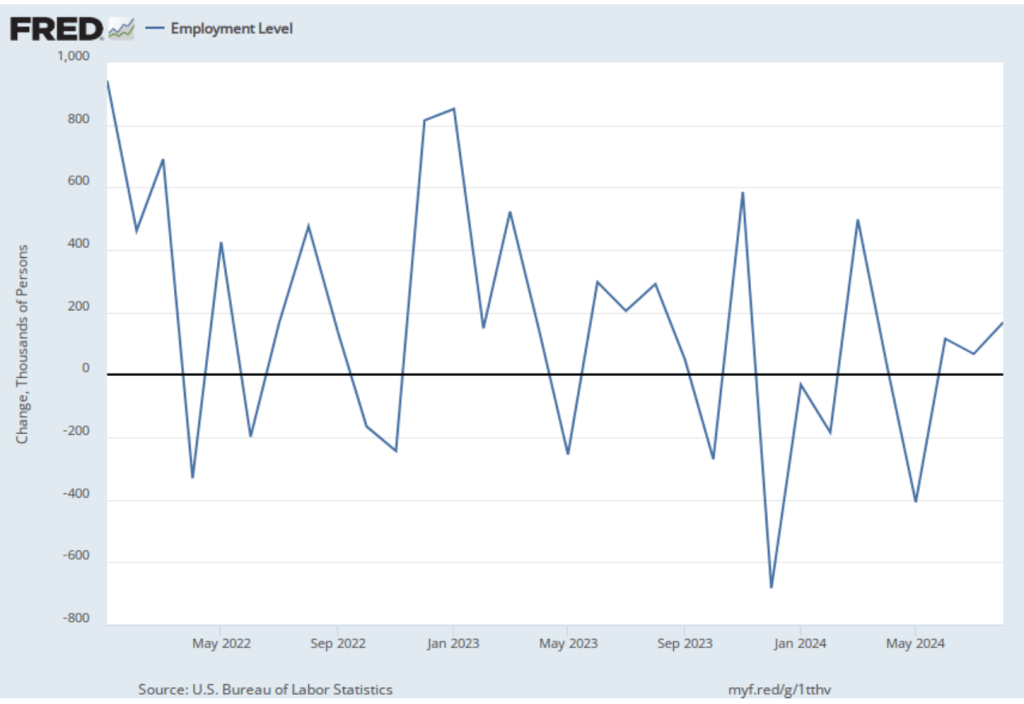
Today (September 9), the Bureau of Labor Statistics (BLS) issued revised estimates of the increase in employment, as measured by the establishment survey, over the period from April 2024 through March 2025. The BLS had initially estimated that during that period net employment had increased by a total of 1,758,000 or an average of 147,000 jobs per month. The revision lowered this estimate by more than half to a total of 839,000 jobs or an average of only 70,000 net new jobs created per month. The difference between those two monthly averages means that the U.S. economy had generated a total of 919,000 fewer jobs during that period. The revision was larger than the downward revision of 800,000 jobs forecast by economists at Wells Fargo, Comerica Bank, and Pantheon Macroeconomics.
Why does the BLS have to revise its employment estimates? As we discuss in Macroeconomics, Chapter 9, Section 9.1 (Economics, Chapter 19, Section 19.1) the initial estimates that the BLS issues each month in its “Employment Situation” reports are based on a sample of 121,000 businesses and government agencies representing 631,000 worksites or “establishments.” The monthly data also rely on estimates of the number of employees at establishments that opened or closed during the month and on employment changes at establishments that failed to respond to the survey. In August or September of each year, the BLS issues revised employment estimates based on data from the Quarterly Census of Employment and Wages (QCEW), which relies on state unemployment insurance tax records. The unemployment tax records are much more comprehensive than the original sample of establishments because nearly all employers are included.
In today’s report, the BLS cited two likely sources of error in their preliminary estimates:
“First, businesses reported less employment to the QCEW than they reported to the CES survey (response error). Second, businesses who were selected for the CES survey but did not respond reported less employment to the QCEW than those businesses who did respond to the CES survey (nonresponse error).”
The preliminary benchmark estimates the BLS released today will be revised again and the final estimates for these months will be released in February 2026. The difference between the preliminary and final benchmark estimates can be substantial. For example, last year, the BLS’s initially preliminary benchmark estimate indicated that the net employment increase from April 2023 to March 2024 had been overestimated by 818,000 jobs. In February 2025, the final benchmark estimate reduced this number to 598,000 jobs.
Although this year’s revision is particularly large in absolute terms—the largest since at least 2001—it still represents only about 0.56 percent of the more than 159.5 million people employed in the U.S. economy. Still the size of this revision is likely to increase political criticism of the BLS.
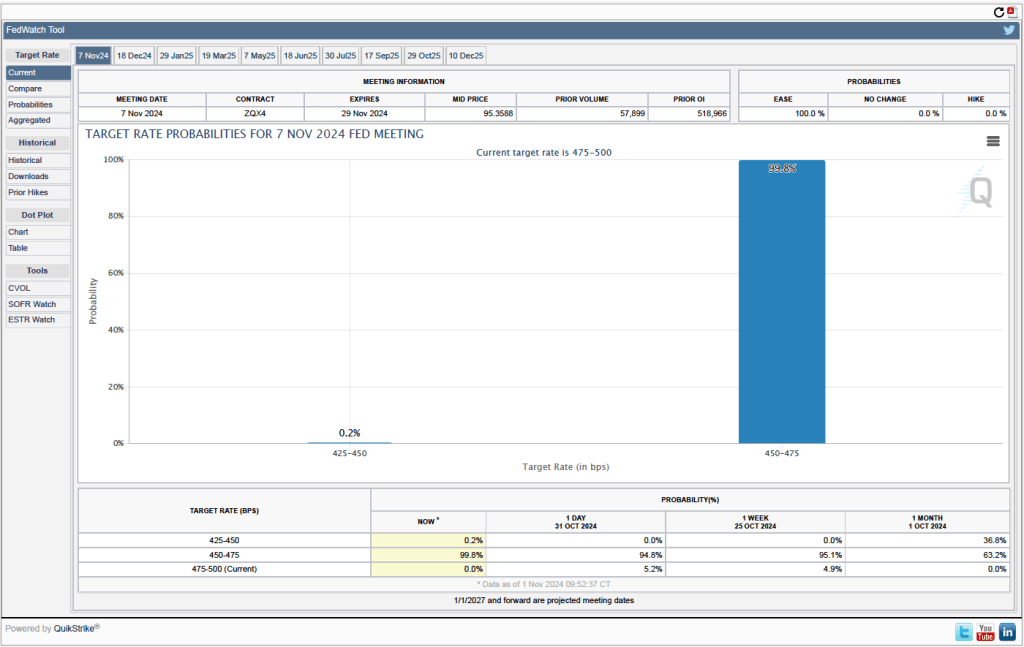
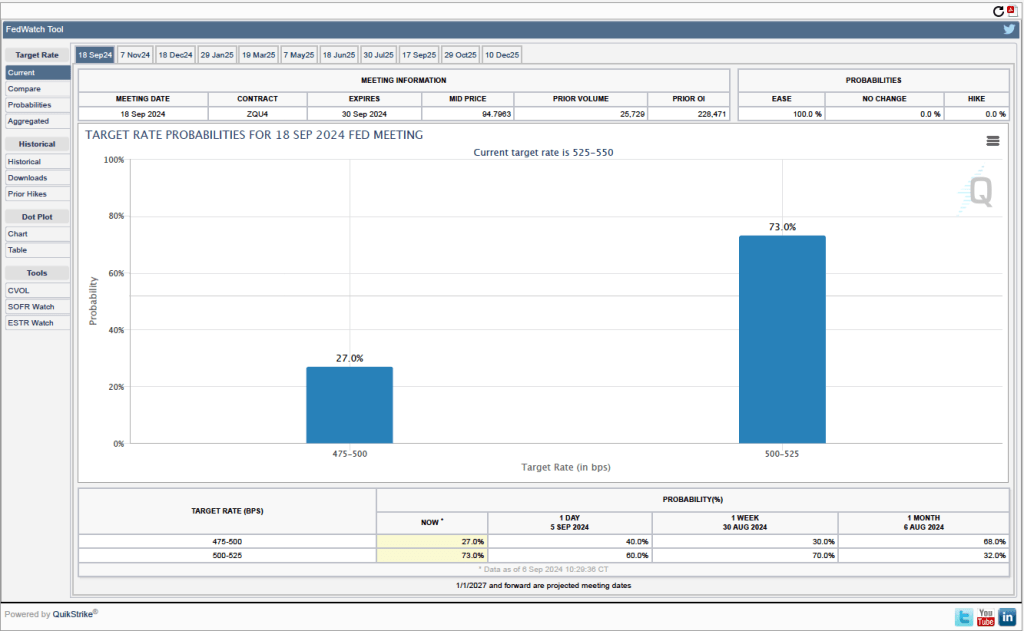
How will this revision affect the decision by the Federal Open Market Committee (FOMC) at its next meeting on September 16-17 to cut or maintain its target for the federal funds rate? The members of the committee were probably not surprised by the downward revision in the employment estimates, although they may have anticipated that the revision would be smaller. In six of the past seven years, the BLS has revised its estimates of payroll employment downward in its annual preliminary benchmark revision.
As we noted in this recent post, even before the BLS revised its employment estimates downward, recent monthly net employment increases were well below the increases during the first half of the year. There was already a high likelihood that the FOMC intended to cut its target for the federal funds rate at its meeting on September 16–17. The substantial downward revision in the employment data makes a cut at the September meeting nearly a certainty and increases the likelihood that the FOMC will implement a second cut in its target for the federal funds rate at the committee’s meeting on October 28–29.