Image created by ChatGPT
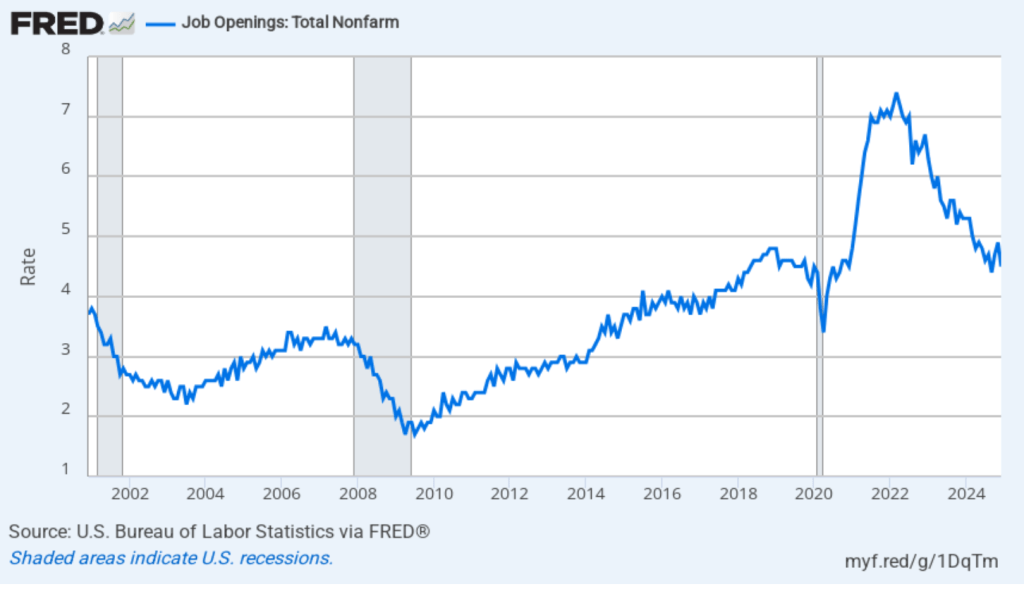
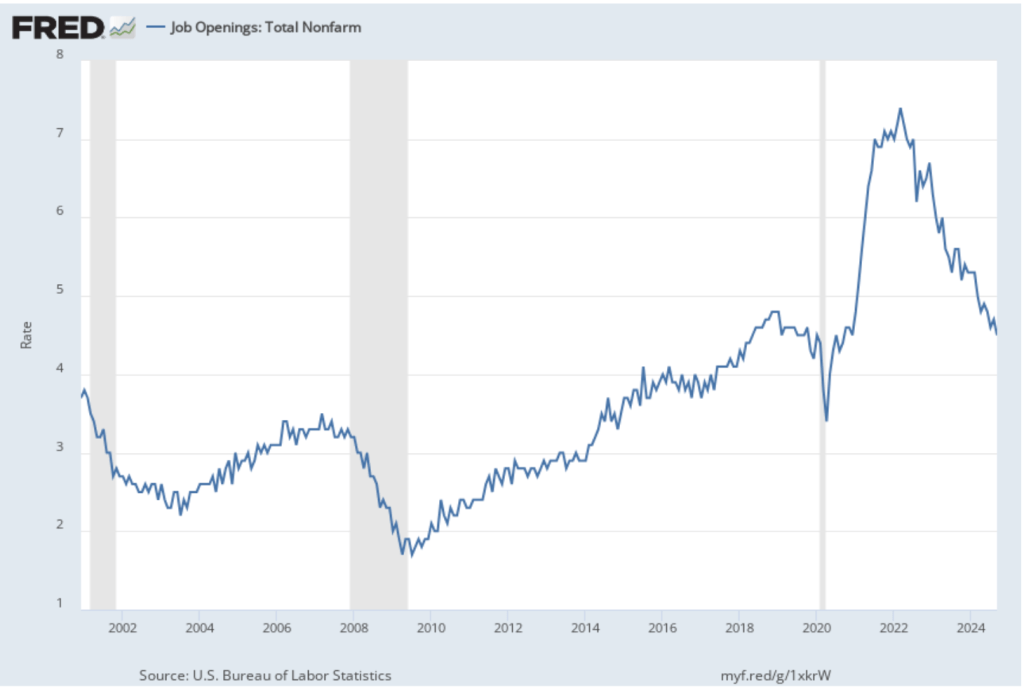
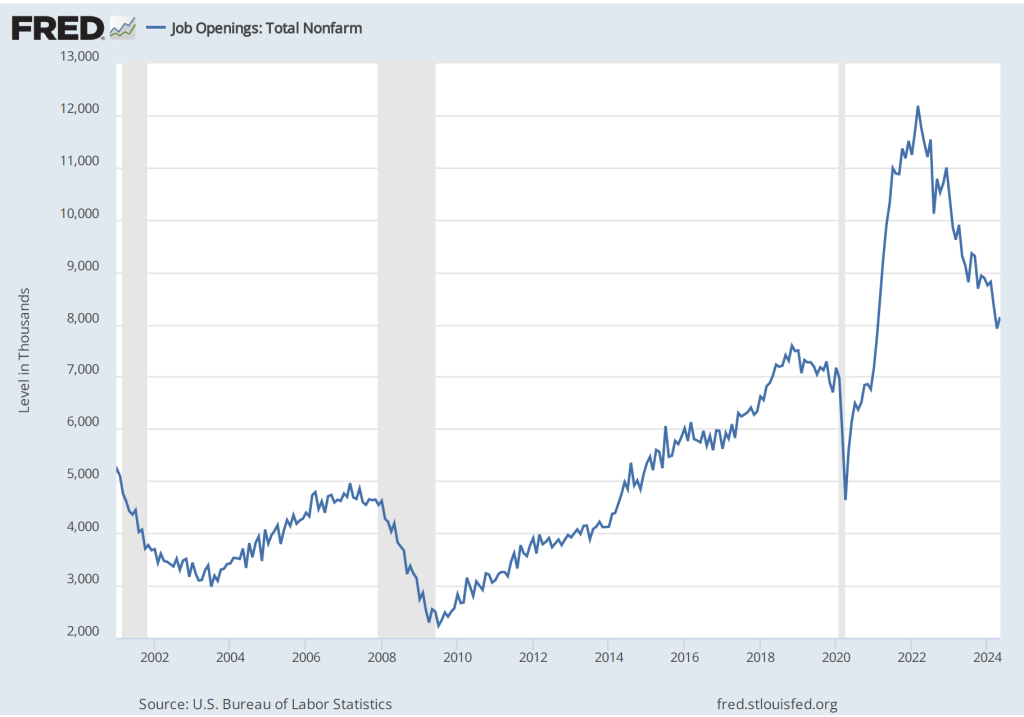
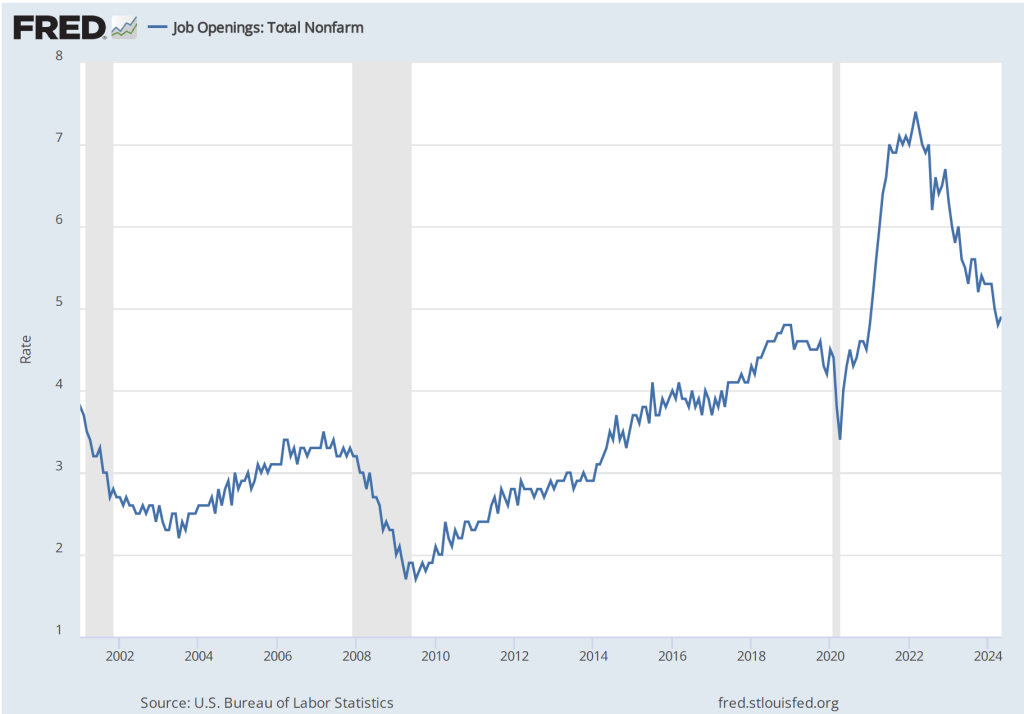
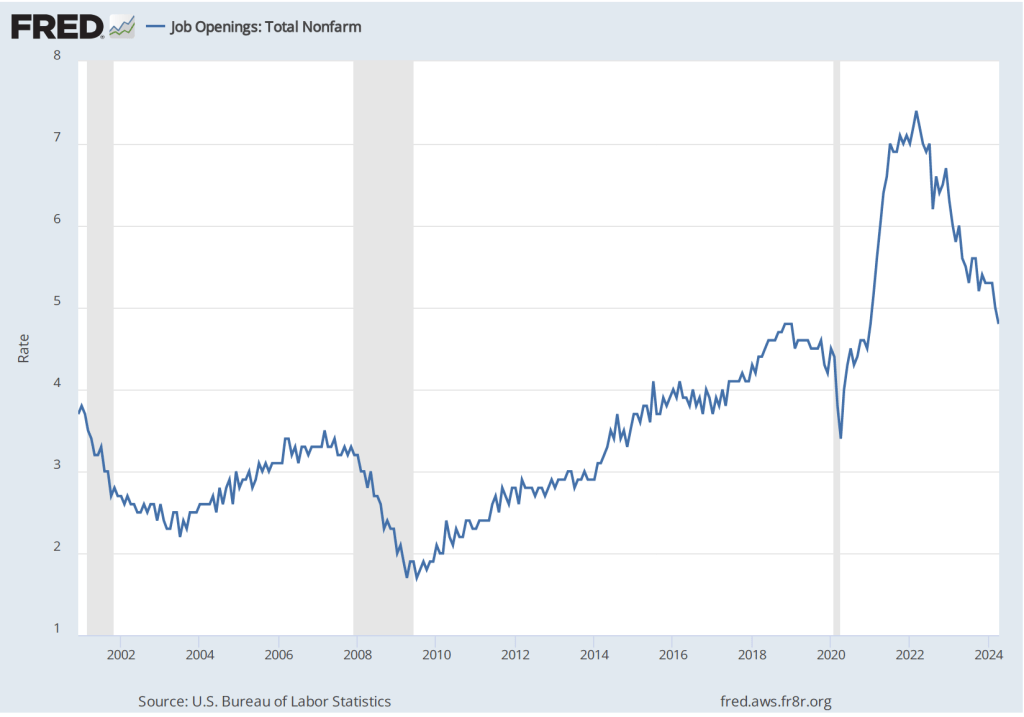
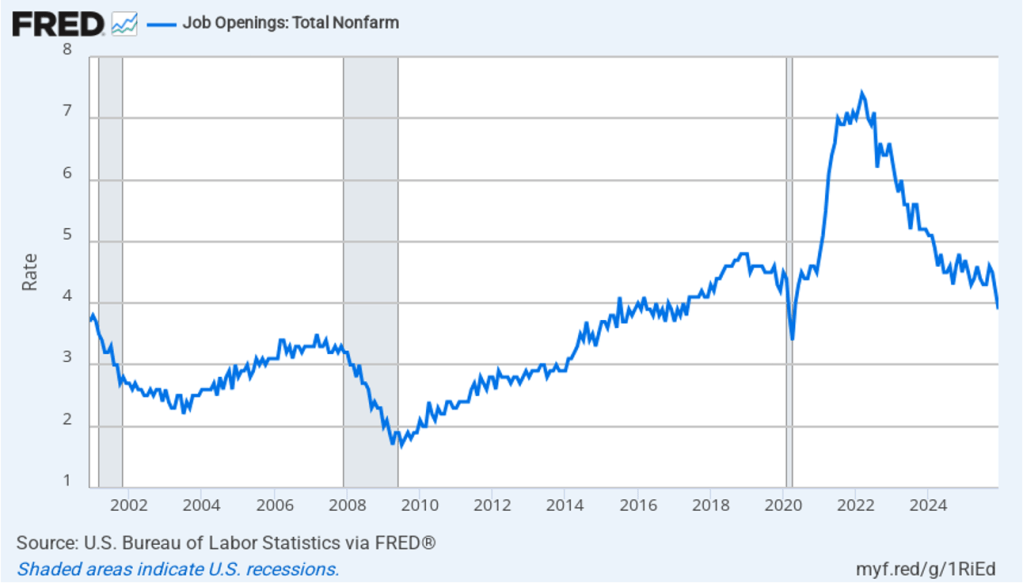
Today (February 5), the Bureau of Labor Statistics (BLS) released its “Job Openings and Labor Turnover” (JOLTS) report for December 2025. The report indicated that labor market conditions may be weakening. The following figure shows that the rate of job openings fell to 3.9 percent in December from 4.2 percent in November. The rate was 4.5 percent in October. The job openings rate is the lowest since April 2020, at the start of the Covid pandemic. We should note the usual caveat that the monthly JOLTS data is subject to potentially large revisions as the BLS receives more complete data.
(The BLS defines a job opening as a full-time or part-time job that a firm is advertising and that will start within 30 days. The rate of job openings is the number of job openings divided by the number of job openings plus the number employed workers, multiplied by 100.)
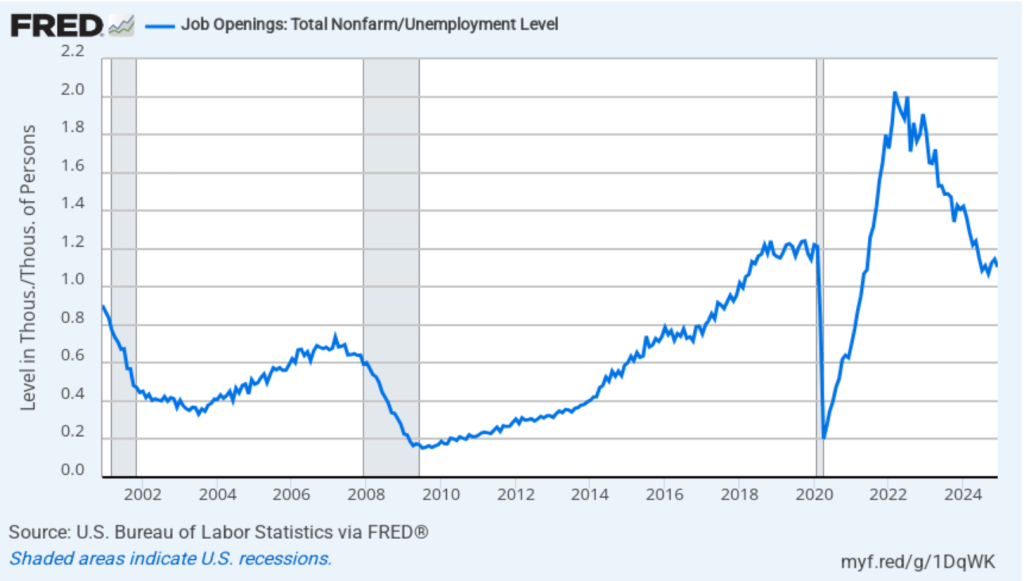
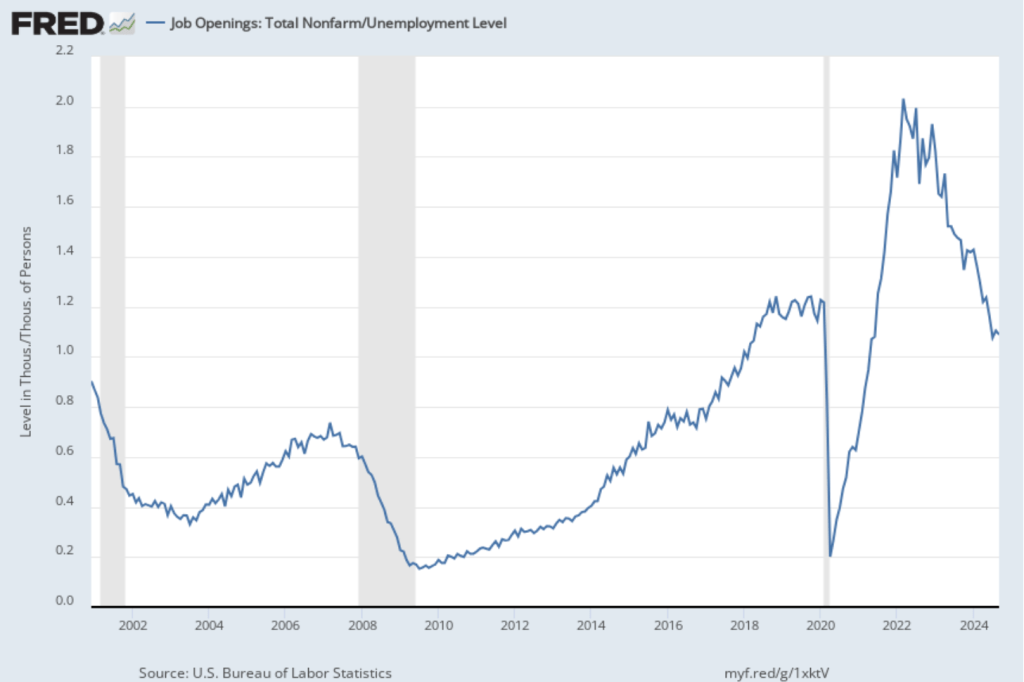
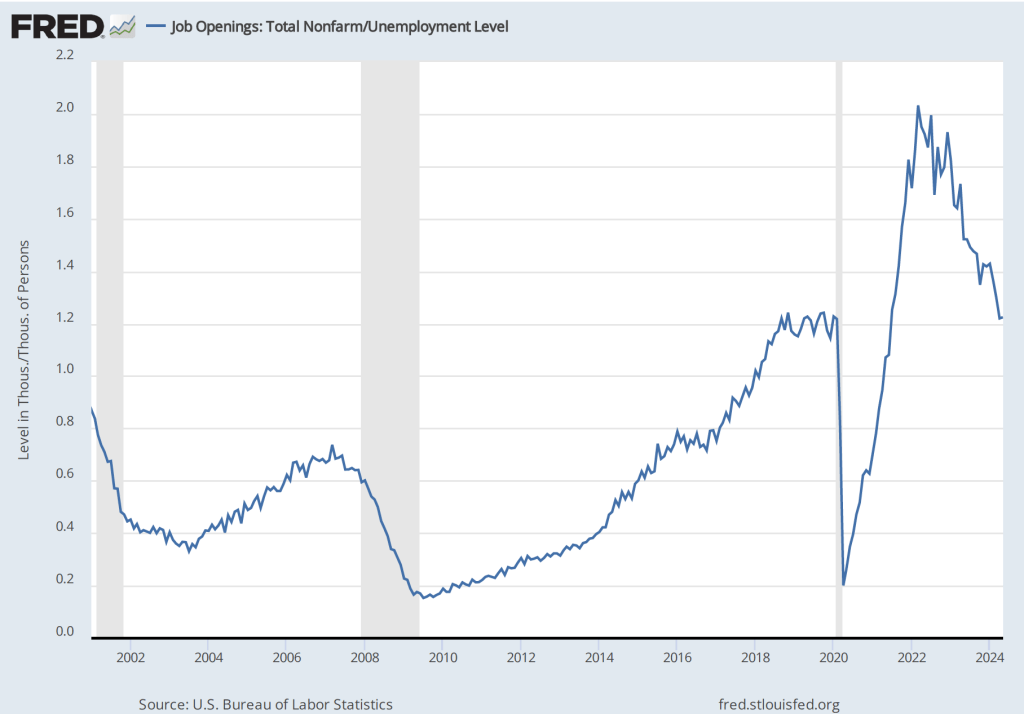
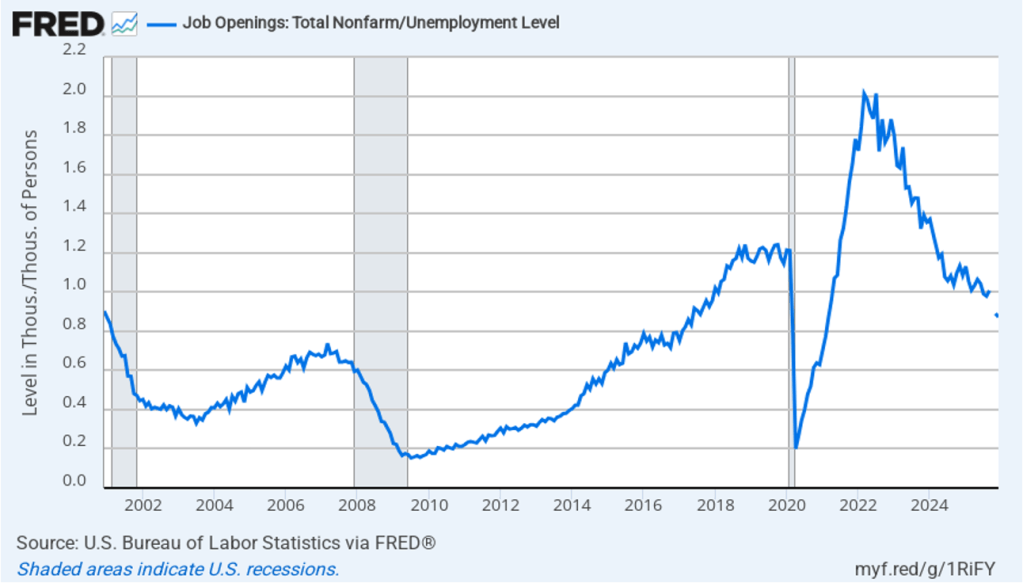
In the following figure, we show a measure of the state of the labor market that economists frequently use: the total number of job openings to the total number of people unemployed. In December there were 0.87 job openings per unemployed person, the lowest value for that measure since March 2021, during the recovery from the pandemic. The value was 1.0 in September. (Note that data for October and November are unavailable because the data weren’t collected during the shutdown of the federal government from October 1 to November 12 last year.) The value for December is well below the 1.21 job openings per employed person in February 2020, just before the pandemic. (Note that, as we discussed in this blog post, the employment-population ratio for prime age workers, which many economists consider a key measure of the state of the labor market, rose in December, putting it above what the ratio was in any month during the period from January 2008 to February 2020.)
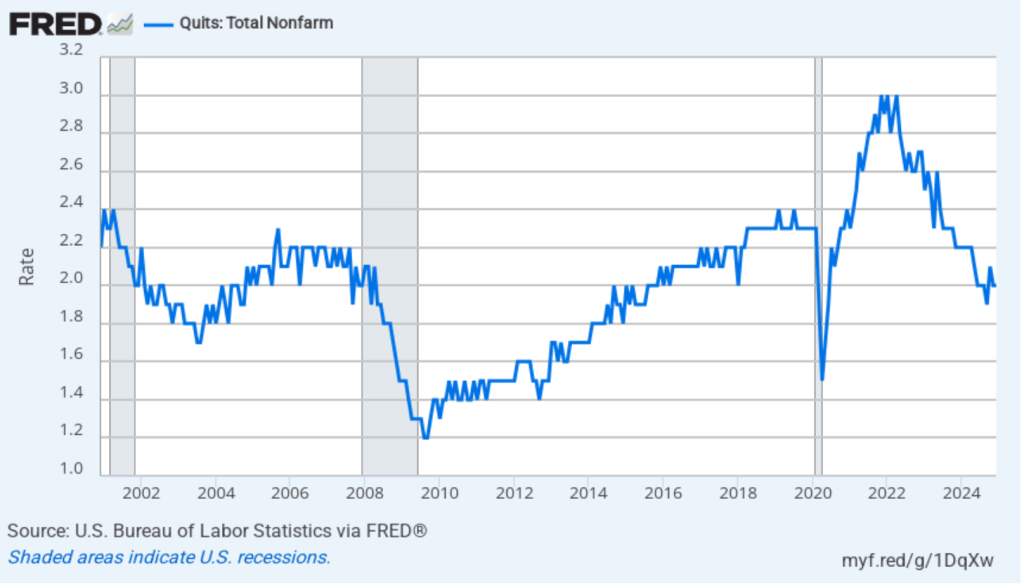
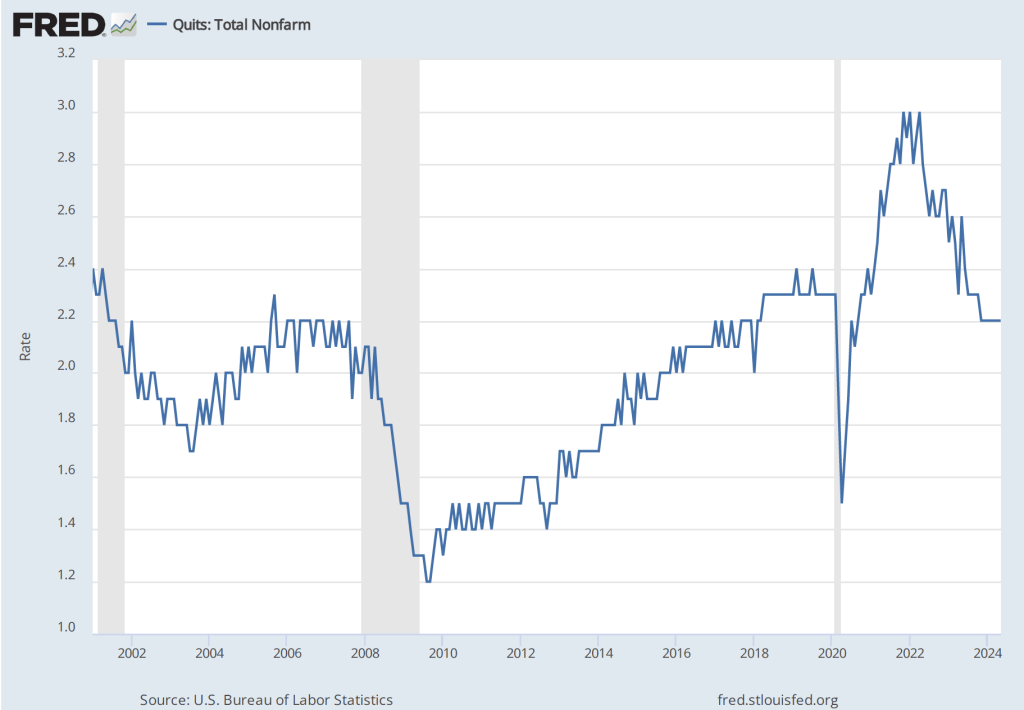
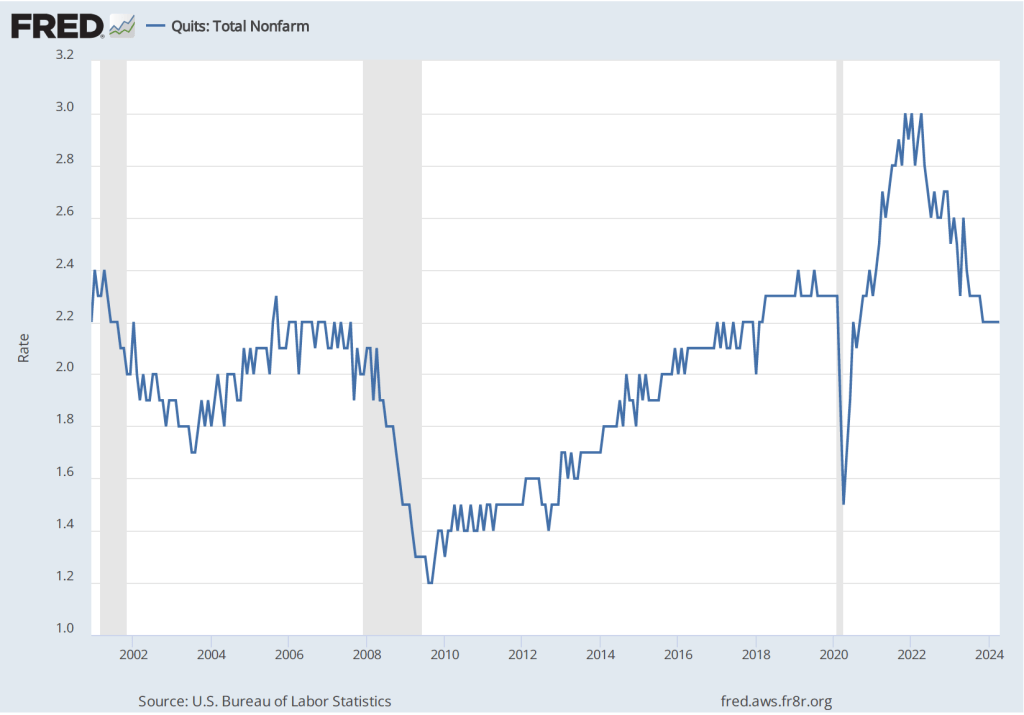
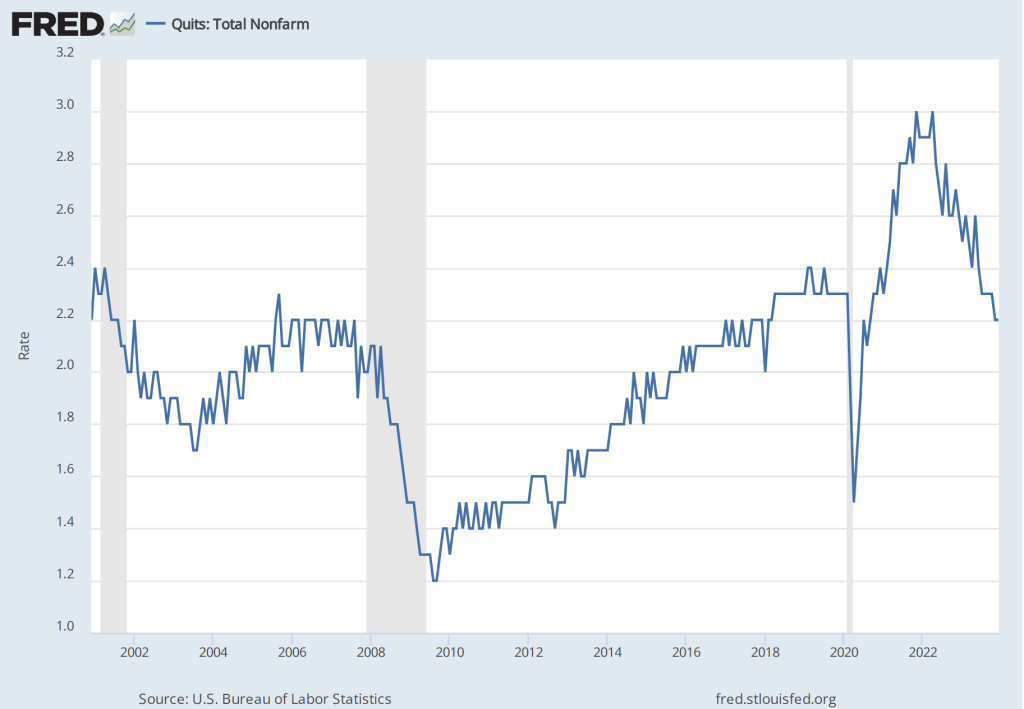
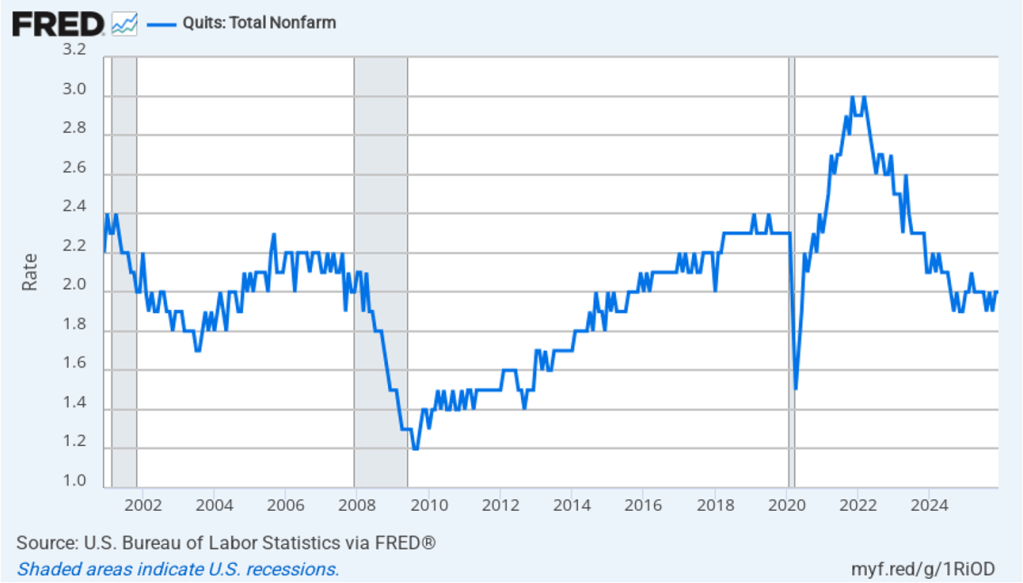
The rate at which workers are willing to quit their jobs is an indication of how they perceive the ease of finding a new job. As the following figure shows, the quit rate declined slowly from a peak of 3 percent in late 2021 and early 2022 to 2.0 percent in August 2024, the same value as in December 2025. That rate is below the rate during 2019 and early 2020. By this measure, workers’ perceptions of the state of the labor market have remained remarkably stable over the last year and a half.
Overall, this JOLTS report is consistent with what some economists have labeled a “slow hire, slow fire” labor market. Fed Chair Jerome Powell’s remarks at his press conference following the last meeting of the Federal Open Market Committee (FOMC) indicates that Fed policymakers share this view, which Powell believes complicates monetary policymaking:
“So there are lots of … little places that suggest that the labor market has softened, but part of … payroll job softening is that both the supply and demand for labor has come down … growth in those two have come down. So that makes it a difficult time to read the labor market. So, imagine they both came down a lot, to the point where there is no job growth. Is that full employment? In a sense it is. If demand and supply are … in balance, you could say that’s full employment. At the same time, is it—do we really feel like … that’s a maximum employment economy? It’s a challenging—it’s very challenging and quite unusual situation.”
The BLS was scheduled to release its monthly “Employment Situation” report (often called the “jobs report”) for January 2026 tomorrow. Because of the temporary lapse in funding that began Saturday, the report will instead be released next Wednesday, February 11. That report will provide additional data on the state of the labor market. (Note that the data in the JOLTS report lag the data in the “Employment Situation” report by one month.)