CBO Estimates Fiscal 2024 Federal Budget Deficit Was $1.8 trillion

Logo of the Congressional Budget Office from cbo.gov.

The federal government’s fiscal year runs from October 1 to September 30 of the following calendar year. The Congressional Budget Office (CBO) estimates that the federal government’s budget deficit for fiscal 2024, which just ended, was $1.8 trillion. (The Office of Management and Budget (OMB) will release the official data on the budget later this month.)

The federal budget deficit increased by about $100 billion from fiscal 2023, although the comparison of the deficits in the two years is complicated by the question of how to account for the $333 billion in student debt cancellation that President Biden ordered (which would reduce federal revenues by that amount) but which wasn’t implemented because of a decision by the U.S. Supreme Court.

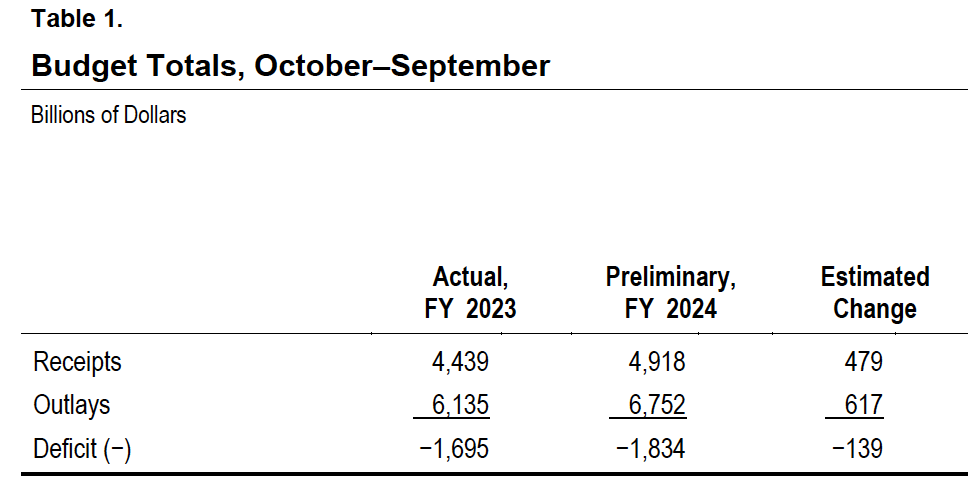
The following table from the CBO report compares federal receipts and outlays for fiscal years 2023 and 2024. Recipts increased by $479 billion from 2023 to 2024, but outlays increased by $617 billion, resulting in an increase of $139 billion in the federal budget deficit.

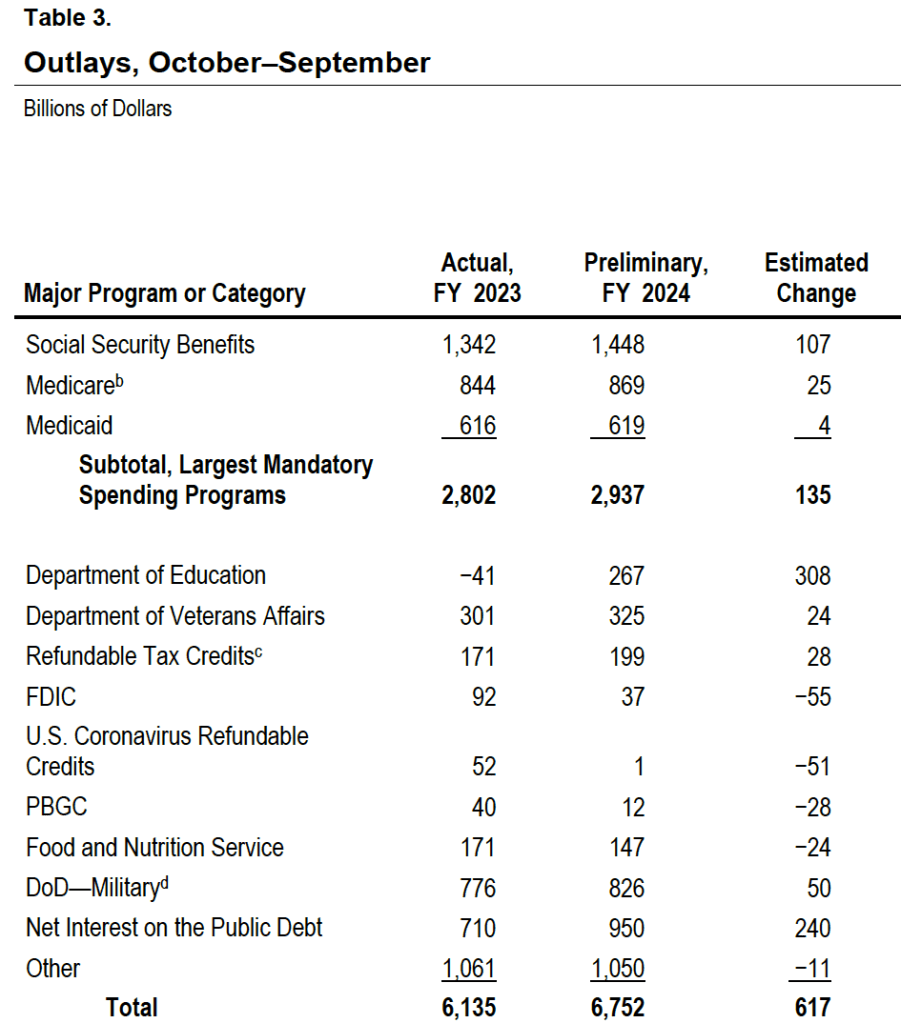
The following table shows the increases in the major spending categories in the federal budget. Spending on the Social Security, Medicare, and Medicaid programs increased by a total of $135 billion. The large increase in spending on the Department of Education is distorted by accounting for the reversal of the student debt cancellation following a Suprement Court ruling, as previously mentioned. The FDIC is the Federal Deposit Insurance Corporation, which had larger than normal expenditures in 2023 due the failure of several regional banks. (We discuss this episode in several earlier blog posts, including this one.) Interest on the public debt increased by $240 billion because of increases in the debt as a result of persistently high federal deficits and because of increases in the interest rates the Treasury has paid on new issues of bill, notes, and bonds necessary to fund those deficits. (We discuss the federal budget deficit and federal debt in Macroeconomics, Chapter 16, Section 16.6 (Economics, Chapter 26, Section 26.6).)

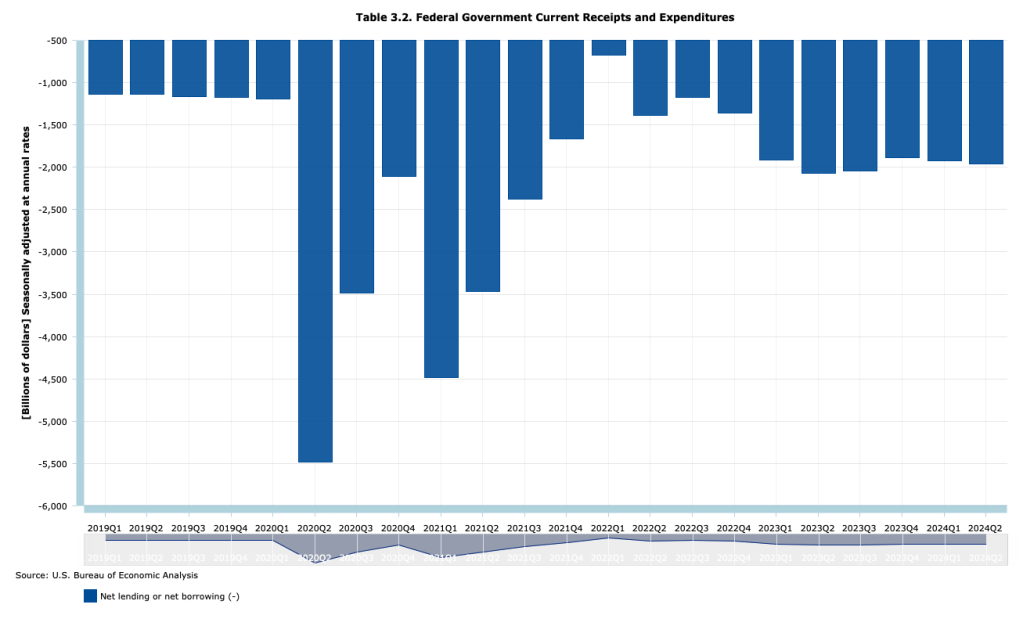
A troubling aspect of the large federal budget deficits is that they are occurring during a time of economic expansion when the economy is at full employment. The following figure, using data from the Bureau of Economic Analysis (BEA), shows that at an annual rate, the federal budget deficit has beening running between $1.9 trillion and $2.1 trillion each quarter since the first quarter of 2023, well after most of the federal spending increases to meet the Covid pandemic ended.

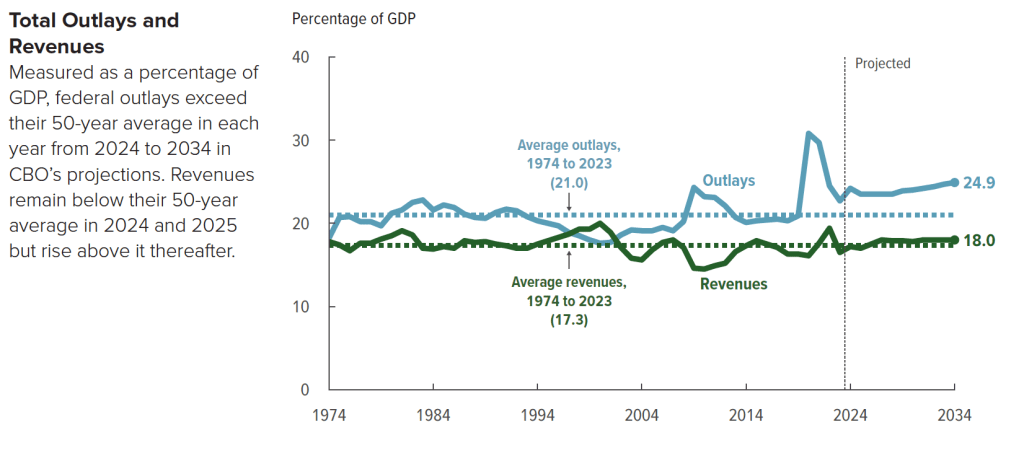
The following figure from the CBO shows trends in federal revenue and spending. From 1974 to 2023, federal spending averaged 21.o percent of GDP, but is forecast to rise to 24.9 percent of GDP by 2023. Federal revenue averaged 17.3 percent of GDP from 1974 to 2023 and is forecast to rise to 18.0 percent of GDP in 2034. As a result, the federal budget deficit, which had averaged 3.7 percent of GDP between 1974 and 2023 (already high in a longer historical context) will nearly double to 6.9 percent of GDP in 2034.

Slowing the growth of federal spending may prove difficult politically because the majority of spending increases are from manadatory spending on Social Security and Medicare, and from interest on the debt. Discretionary outlays are scheduled to decline in future years according to current law, but may well also increase if Congress and future presidents increase defense spending to meet the foreign challenges the country faces.

One possible course of future policy that would result in smaller future federal deficits is outlined in this post and the material at the included links.

How Did the United States Reduce the Debt-to-GDP Ratio after World War II?

Main Gun Mount Assembly Plant, Northern Pump Co. Plant, Fridley, Minnesota, 1942. (Photo from the Franklin D. Roosevelt Presidential Library & Museum.)

To fight World War II, the federal government had to dramatically increase spending. As the following figure shows, total federal spending rose from $6.8 billion in 1940 to a peak of $100.1 billion in 1944. National defense spending made up most of the increase, rising from $2.8 billion in 1940 to $97.3 billion in 1944.

Part of the increased spending was paid for by increases in taxes. Total federal tax receipts rose from $6.2 billion in 1940 to $35.8 billion in 1945. Individual income taxes rose from $1.0 billion in 1940 to 18.6 billion in 1945. Tax rates were raised and the minimum income at which people had to pay tax on their income was reduced. From the introduction of the federal individual income tax in 1913 until 1940, only people who had at least upper middle class incomes paid any federal income taxes. Following the passage by Congress of the Revenue Act of 1942, most workers had to pay federal income taxes. In 1940, 7.4 million people had to pay federal individual income taxes. In 1945, 42.7 million people had to. For the first time, the federal government withheld taxes from workers paychecks. Previously, all taxes were due on March 15th of the year following the year being taxed. Milton Friedman, who in the 1970s won the Nobel Prize in Economics, was part of the team at the U.S. Treasury that designed and implemented the system of withholding income taxes. Withholding of individual income taxes has continued to the present day.

Although large, the increases in federal taxes were insufficient to fund the massive military spending required to win the war. As a result, the U.S. Treasury had to greatly increase its sales of Treasury bonds. Recall from Macroeconomics, Chapter 16, Section 16.6 (Economics, Chapter 26, Section 26.6 and Essentials of Economics, Chapter 18, Section 18.6) that the total value of outstanding Treasury bonds is called the federal government debt, sometimes called the national debt. The part of federal government debt held by the public rather than by government agencies, such as the Social Security Trust Funds, is call the public debt. In order to gauge the effects of the debt on the economy, economists typically look at the size of the public debt relative to GDP. The following figure shows the public debt as a percentage of GDP for the years from 1929 to 2022.

The figure shows that the ratio of debt to GDP increased sharply from 1929 to the mid-1930s, reflecting the federal budget deficits resulting from the Great Depression, and then soared beginning in 1940. Debt peaked at 113 percent of GDP in 1945 and then began a long decline that lasted until 1974, when debt had fallen to 23 percent of GDP. The ratio of debt to GDP then fluctuated until the Great Recession of 2007-2009 when it began a steady increase that turned into a surge during and after the Covid-19 pandemic. (We discuss the causes of the recent surge in debt in this blog post.)

What caused the long decline in the ratio of debt to GDP that began in 1946 and continued until 1974? The usual explanation is that the decline was not primarily due to the federal government paying off a signficiant portion of the debt. The public debt did decline from a peak of $241.9 billion in 1946 to $214.3 billion in 1949 but there were no significant declines in the level of the public debt after 1949. Instead the ratio of debt to GDP declined because GDP grew faster than did the debt.

Recently in a National Bureau of Economic Research Working Paper, “Did the U.S. Really Grow Out of Its World War II Debt?” Julien Acalin and Laurence M. Ball of Johns Hopkins University have analyzed the issue more closely. They conclude that economic growth played a smaller role in reducing the debt-to-GDP ratio than has previously been thought. In particular, they highlight the fact that for significant periods through the 1970s, the Treasury was able to pay a real interest rate on the debt that was lower than market rates. Lower real interest rates reduced the amount by which the debt might otherwise have grown.

As we discuss in Money, Banking, and the Financial System, Chapter 13, Section 13.2, in April 1942, to support the war effort, the Federal Reserve announced that it would fix interest rates on Treasury securities at low levels: 0.375 percent on Treasury bills and 2.5 percent on Tresaury bonds. This policy continued after the end of the war in 1945 until the Fed was allowed to abandon the policy of pegging the interest rates on Treasury securities following the March 1951 Treasury-Federal Reserve Accord. Acalin and Ball also note that even after the Accord, there were periods in which actual inflation was well above expected inflation, causing the real interest rate the Treasury was paying on debt to be below the expected real interest rate. In other words, part of the falling debt-to-GDP ratio was financed by investors receiving lower returns on their purchases of Treasury securities than they had expected to.

Acalin and Ball conclude that if the Treasury had not done the relatively small amount of debt repayment mentioned earlier and if it had had to pay market real interest rates on the debt, debt would have declined to only 74 percent of GDP in 1974, rather than to 23 percent.

Sources: The debt and GDP data are from the Congressional Budget Office, which can be found here, and from the Office of Management and the Budget, which can be found here.