
Join authors Glenn Hubbard and Tony O’Brien as they discuss how core economic principles illuminate two of the most pressing policy debates facing the economy today: tariffs and artificial intelligence. Drawing on a recent Supreme Court decision striking down broad tariff increases, Hubbard and O’Brien explain why economists view tariffs as taxes, who ultimately bears their burden, and how trade policy uncertainty shapes business decisions, inflation, and economic growth—bringing textbook concepts like tax incidence, intermediate goods, and GDP measurement vividly to life. The conversation then turns to AI, where they cut through market hype and dire predictions to place generative AI in historical context as a general‑purpose technology, comparing it to past innovations that transformed jobs without eliminating work. Along the way, they explore how AI can both substitute for and complement labor, why fears of mass unemployment are likely overstated, and what economists can—and cannot yet—say about AI’s long‑run effects on productivity, profits, and the labor market.
Tag: Labor market
Real GDP Growth Comes in Slightly Below Expectations, Inflation Is Below Target, and the Labor Market Shows Some Weakening
Image of GDP generated by GTP-4o
This week, two data releases paint a picture of the U.S. economy as possibly slowing slightly, but still demonstrating considerable strength. The Bureau of Economic Analysis (BEA) released its advance estimate of GDP for the third quarter of 2024. (The report can be found here.) The BEA estimates that real GDP increased by 2.8 percent at an annual rate in the third quarter—July through September. That was down from the 3.0 percent increase in real GDP in the second quarter and below the 3.1 percent that economists surveyed by the Wall Street Journal had expected. The following figure from the BEA report shows the growth rate of real GDP in each quarter since the fourth quarter of 2020.
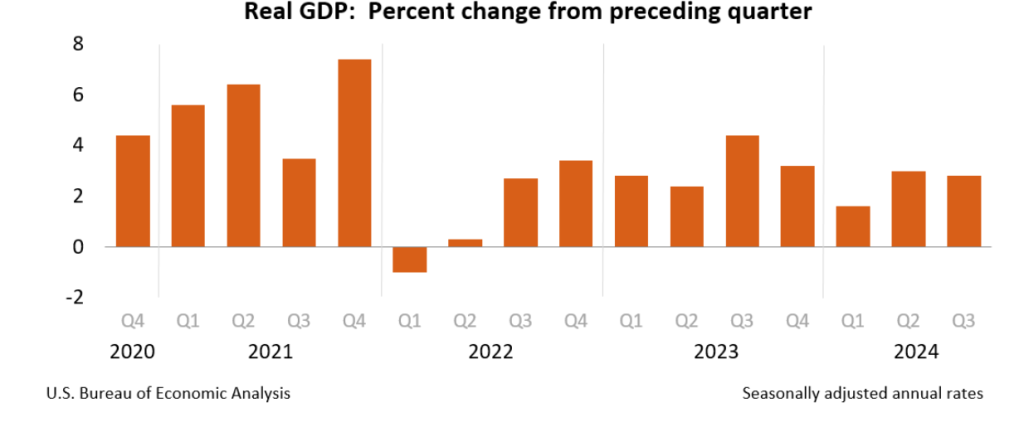
Two other points to note: In June, the Congressional Budget Office (CBO) had forecast that the growth rate of real GDP in the third quarter would be only 2.1 percent. The CBO forecasts that, over the longer run, real GDP will grow at a rate of 1.7 to 1.8 percent per year. So, the growth rate of real GDP according to the BEA’s advance estimate (which, it’s worth recalling, is subject to potentially large revisions) was above expectations from earlier this year and above the likely long run growth rate.
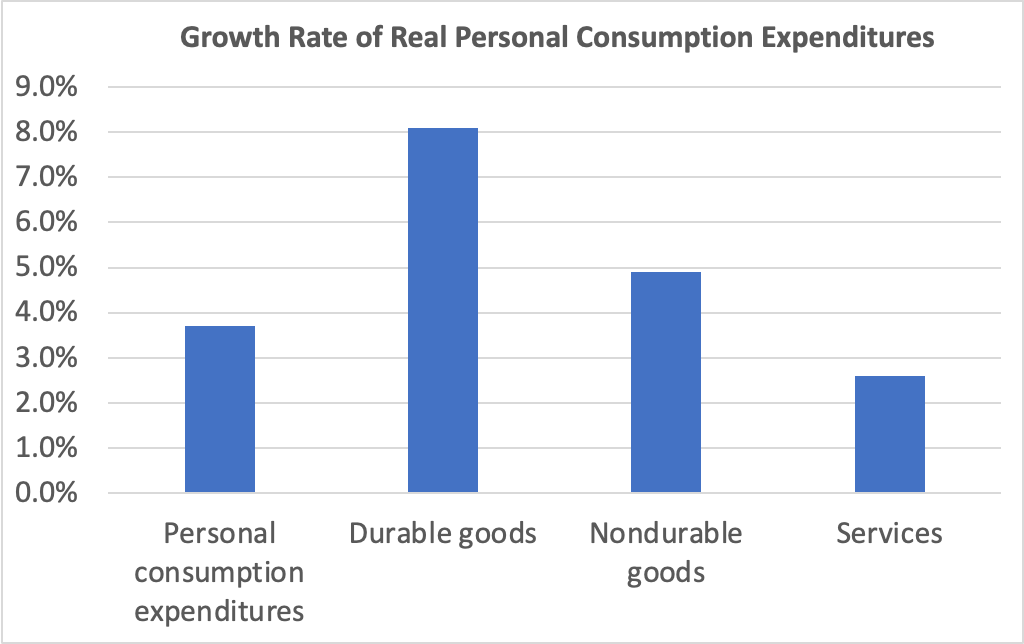
Consumer spending was the largest contributor to third quarter GDP growth. The following figure shows growth rates of real personal consumption expenditures and the subcategories of expenditures on durable goods, nondurable goods, and services. There was strong growth in each component of consumption spending. The 8.1 percent increase in expenditures on durables was particularly strong. It was the second quarter in a row of strong growth in spending on durables after a decline of –1.8 percent in the first quarter.
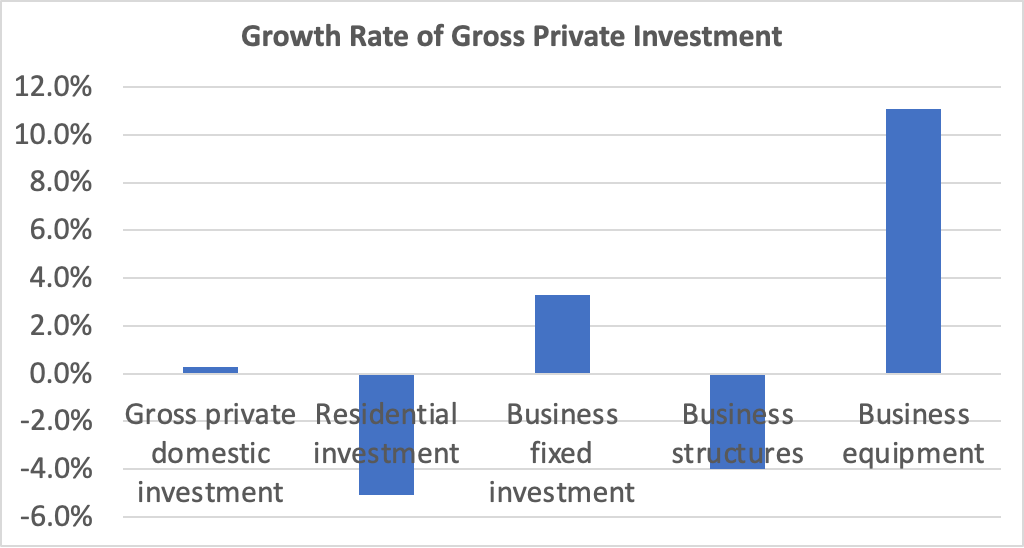
Investment spending and its components were a more mixed bag, as shown in the following figure. Investment spending is always more volatile than consumption spending. Overall, gross private domestic investment increased at a slow rate of 0.3 percent—the slowest rate since a decline in the first quarter of 2023. Residential investment decreased by 5.1 percent, reflecting difficulties in residential construction due to mortgage interest rates remaining high. Business fixed investment grew 3.1 percent, powered by an increase of 11.1 percent in spending on business equipment. Spending on structures—such as factories and office buildings—had increased rapidly over the past two years before slowing to a 0.2 percent increase in the second quarter and a decline of 4.0 percent in the fourth quarter.
The GDP report also contained data on the private consumption expenditure (PCE) price index, which the FOMC uses to determine whether it is achieving its goal of a 2 percent inflation rate. The following figure shows inflation as measured using the PCE and the core PCE—which excludes food and energy prices—since the beginning of 2016. (Note that these inflation rates are measured using quarterly data and as compound annual rates of change.) Despite the strong growth in real GDP, inflation as measured by PCE was only 1.5 percent, below the 2.5 percent increase in the second quarter and below the Federal Reserve’s 2.0 percent inflation target. Core PCE, which may be a better indicator of the likely course of inflation in the future, declined to 2.2 percent in the third quarter from 2.8 percent in the second quarter. The third quarter increase was slightly above the rate that economists surveyed by the Wall Street Journal had expected.

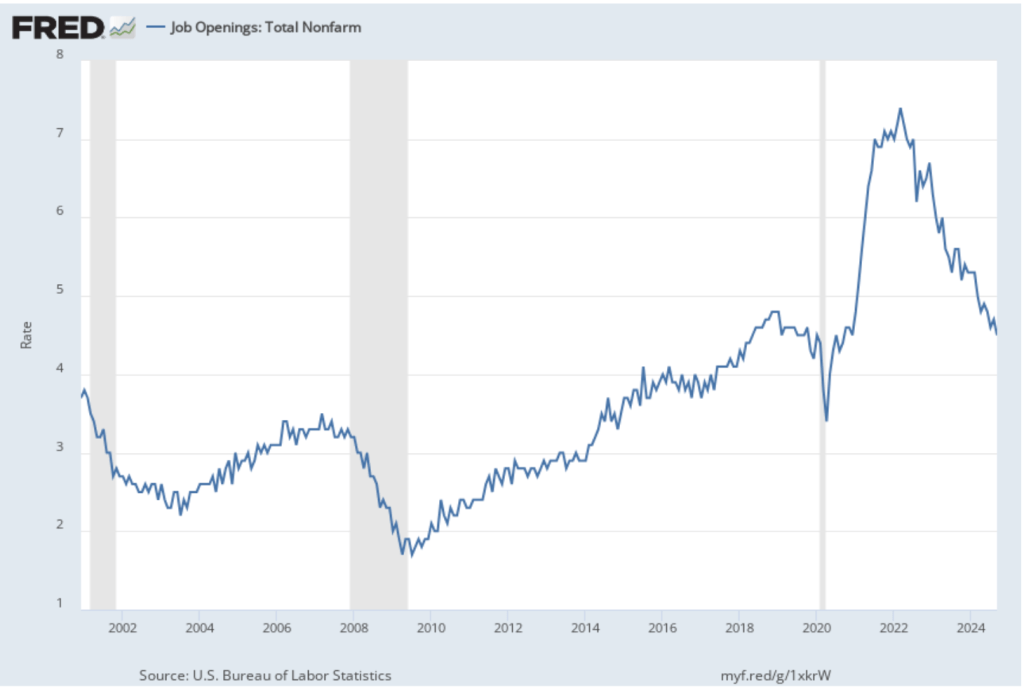
This week, the Bureau of Labor Statistics (BLS) released its “Job Openings and Labor Turnover” (JOLTS) report for September 2024. The report provided data indicating some weakening in the U.S. labor market. The following figure shows the rate of job openings. The BLS defines a job opening as a full-time or part-time job that a firm is advertising and that will start within 30 days and the rate of job openings as the number of job openings divided by the number of job openings plus the number of employed workers, multiplied by 100. The 4.9 percent job opening rate in September continued the slow decline from the peak rate of 7.4 percent in March 2022. The rate is also slightly below the rate during late 2018 and 2019 before the Covid pandemic.
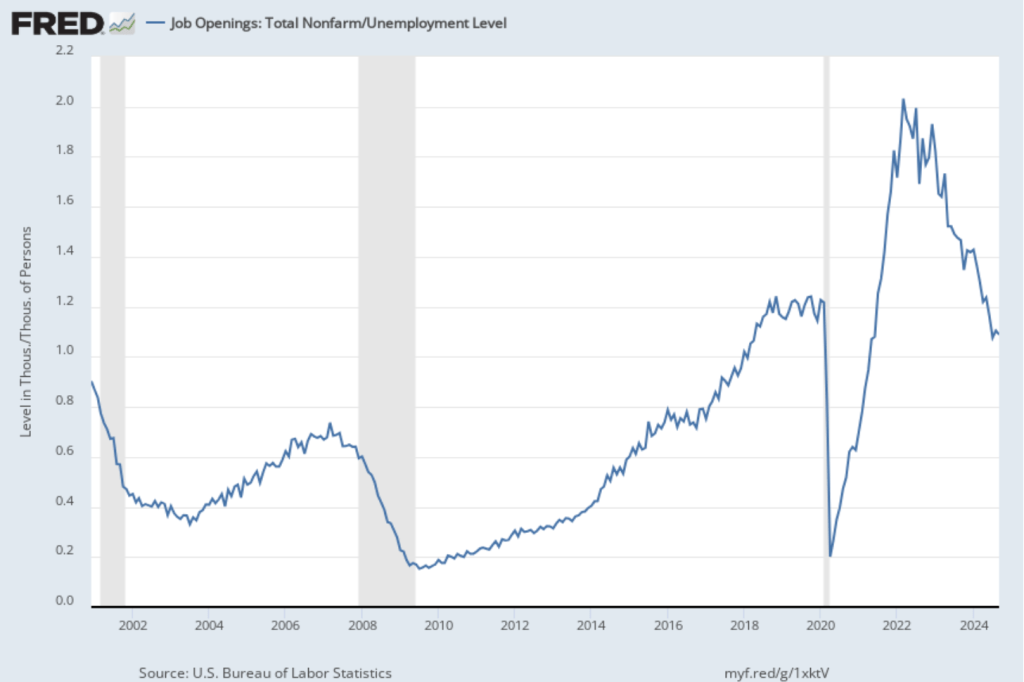
In the following figure, we compare the total number of job openings to the total number of people unemployed. The figure shows a slow decline from a peak of more than 2 job openings per unemployed person in the spring of 2022 to 1.1 job openings per employed person in September 2024, somewhat below the levels in 2019 and early 2020, before the pandemic. Note that the number is still above 1.0, indicating that the demand for labor is still high, although no higher than during the strong labor market of 2019.
Finally, note from the figure that over the period during which the BLS has been conducting the JOLTS survey, the rate of job openings has declined just before and during recessions. Does that fact indicate that the decline in the job opening rate in recent months is signaling that a recession is likely to begin soon? We can’t say with certainty, particularly because the labor market was severely disrupted by the pandemic. The decline in the job openings rate since 2022 is more likely to reflect the labor market returning to more normal conditions than a weakening in hiring that signals a recession is coming.
To summarize these data:
- Real GDP growth is strong, although below what economists had been projecting.
- Inflation as measured by the PCE is below the Fed’s 2 percent target, although core inflation remains slightly above the target.
- The job market has weakened somewhat, although there is no strong indication that a recession will happen in the near future.
FOMC Holds Rate Target Steady While Hinting at a Cut at the September Meeting

Image of “Federal Reserve Chair Jerome Powell speaking at a podium” generated by GTP-4o.
At the conclusion of its July 30-31 meeting, the Federal Reserve’s policy-making Federal Open Market Committee (FOMC) voted unamiously to leave its target range for the federal funds rate unchanged at 5.25 percent to 5.5 percent. (The statement the FOMC issued following the meeting can be found here.)
In the statement Fed Chair Jerome Powell read at the beginning of his press conference after the meeting, Powell appeared to be repeating a position he has stated in speeches and interviews during the past month:
“We have stated that we do not expect it will be appropriate to reduce the target range for the federal funds rate until we have gained greater confidence that inflation is moving sustainably toward 2 percent. The second-quarter’s inflation readings have added to our confidence, and more good data would further strengthen that confidence. We will continue to make our decisions meeting by meeting.”
But in answering questions from reporters, he made it clear that—as many economists and Wall Street investors had already concluded—the FOMC was likely to reduce its target for the federal funds rate at its next meeting on September 17-18. Powell noted that recent data were consistent with the inflation rate continuing to decline toward the Fed’s 2 percent annual target. Powell summarized the consensus from the discussion among committee members as being that “the time was approaching for cutting rates.”
Futures markets allow investors to buy and sell futures contracts on commodities–such as wheat and oil–and on financial assets. Investors can use futures contracts both to hedge against risk—such as a sudden increase in oil prices or in interest rates—and to speculate by, in effect, betting on whether the price of a commodity or financial asset is likely to rise or fall. (We discuss the mechanics of futures markets in Chapter 7, Section 7.3 of Money, Banking, and the Financial System.) The CME Group was formed from several futures markets, including the Chicago Mercantile Exchange, and allows investors to trade federal funds futures contracts. The data that result from trading on the CME indicate what investors in financial markets expect future values of the federal funds rate to be. The following chart from the CME’s FedWatch Tool shows the current values resulting from trading of federal funds futures.
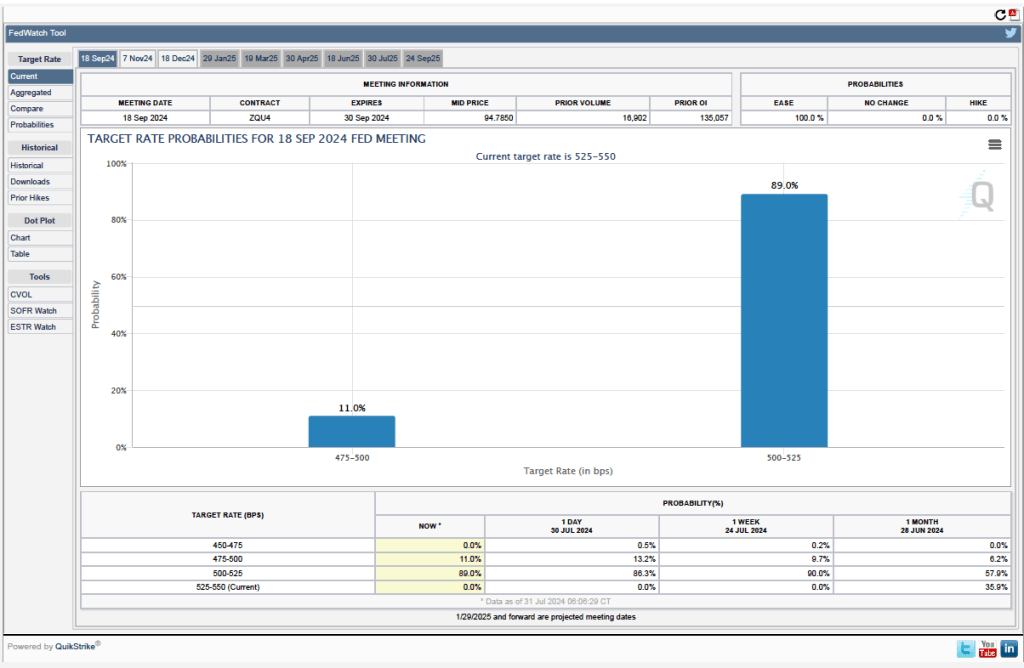
The probabilities in the chart reflect investors’ predictions of what the FOMC’s target for the federal funds rate will be after the committee’s September meeting. The chart indicates that investors assign a probability of 100 percent to the FOMC cutting its federal funds rate target at this meeting. Investors assign a probability of 89.0 percent that the committee will cut its target by 0.25 percentage point and a probability of 11.0 percent that the commitee will cut its target by 0.50 percentage point. When asked at his press conference whether the committee had given any consideration to making a 0.50 percentage point cut in its target, Powell said that it hadn’t.
Powell stated that the latest data on wage increases had led the committee to conclude that the labor market was no longer a source of inflationary pressure. The morning of the press conference, the Bureau of Labor Statistics (BLS) released its latest report on the Employment Cost Index (ECI). As we’ve noted in earlier posts, as a measure of the rate of increase in labor costs, the FOMC prefers the ECI to average hourly earnings (AHE).
As a measure of how wages are increasing or decreasing during a particular period, AHE can suffer from composition effects because AHE data aren’t adjusted for changes in the mix of occupations workers are employed in. In contrast, the ECI holds the mix of occupations constant. The ECI does have the drawback that it is only available quarterly whereas the AHE is available monthly.
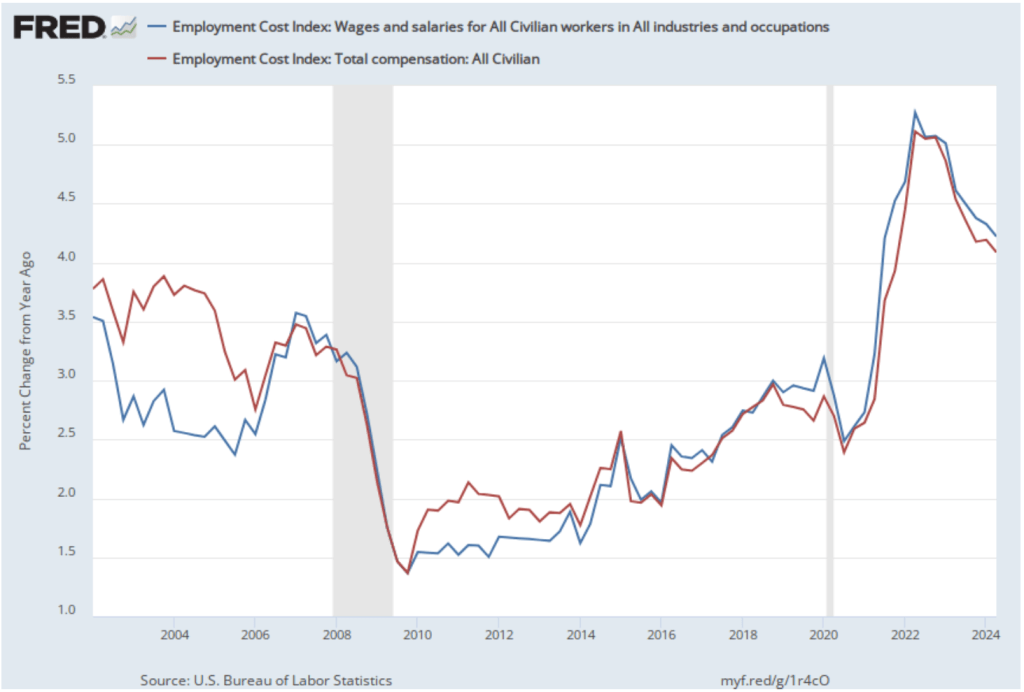
The following figure shows the percentage change in the ECI for all civilian workers from the same quarter in the previous year. The blue line looks only at wages and salaries, while the red line is for total compensation, including non-wage benefits like employer contributions to health insurance. The rate of increase in the wage and salary measure decreased slightly from 4.3 percent in the first quarter of 2024 to 4.2 percent in the second quarter of 2024. The rate of increase in compensation also declined slightly from 4.2 percent to 4.1 percent. As the figure shows, both measures continued their declines from the peak of wage inflation during the second quarter of 2022. In his press conference, Powell said that the this latest ECI report was a little better than the committee had expected.
Finally, Powell noted that the committee saw no indication that the U.S. economy was heading for a recession. He observed that: “The labor market has come into better balance and the unemployment rate remains low.” In addition, he said that output continued to grow steadily. In particular, he pointed to growth in real final sales to private domestic purchasers. This macro variable equals the sum of personal consumption expenditures and gross private fixed investment. By excluding exports, government purchases, and changes in inventories, final sales to private domestic purchasers removes the more volatile components of gross domestic product and provides a better measure of the underlying trend in the growth of output.
As the following figure shows, this measure of output has grown at an annual rate of more than 2.5 percent in each of the last three quarters. Output expanding at that rate is indicative of an economy that is neither overheating nor heading toward a recession.

At this point, unless macro data releases are unexpectedly strong or weak during the next six weeks, it seems nearly certain that at its September meeting the FOMC will reduce its target range for the federal funds rate by 0.25 percentage point.
Latest JOLTS Report Confirms that the Labor Market Is Returning to Pre-Pandemic Conditions

When inflation began to accelerate in the spring of 2022, the highly unusual situation in the U.S. labor market was one of the reasons. This morning (July 2), the Bureau of Labor Statistics (BLS) released its “Job Openings and Labor Turnover” (JOLTS) report for May 2024. The report proivided more data indicating that the U.S. labor market is continuing its return to pre-pandemic conditions.
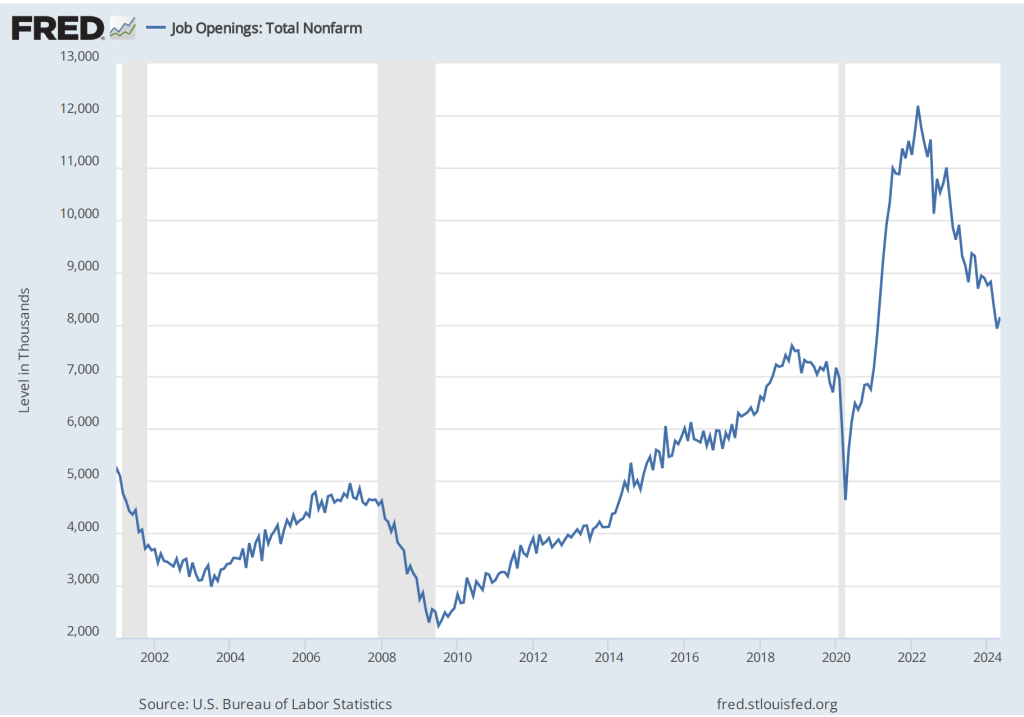
The following figures shows the total number of job openings. The BLS defines a job opening as a full-time or part-time job that a firm is advertising and that will start within 30 days. Although the total number of job openings, at 8.1 million, is still somewhat above pre-pandemic levels, it has been gradually declining since reaching a peak of 12.2 million in March 2022.
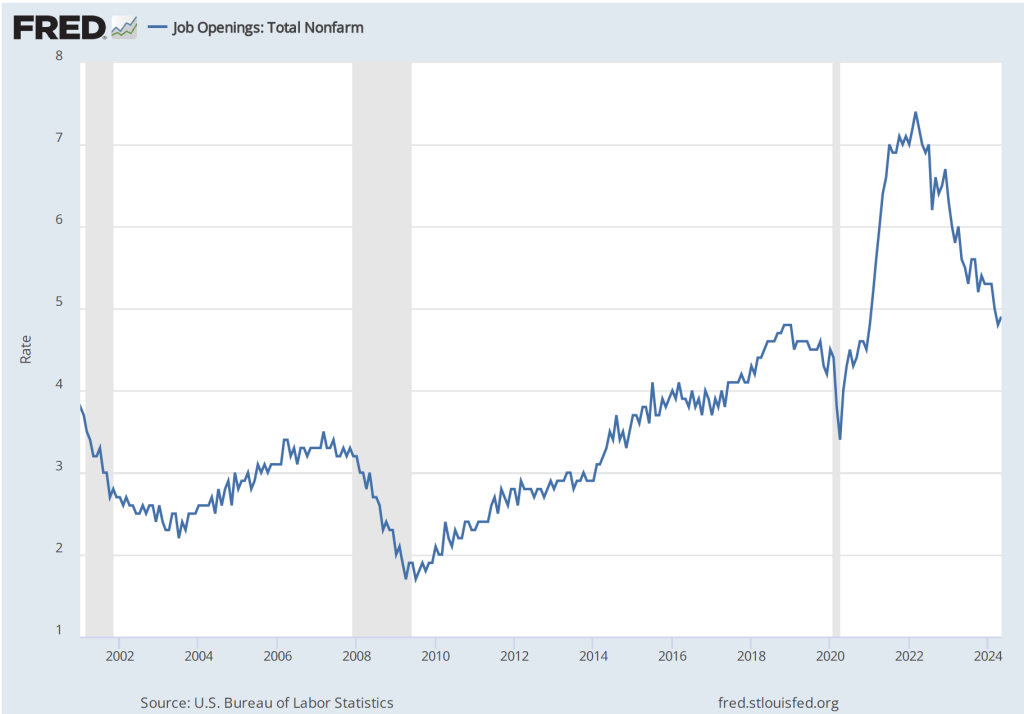
The next figure shows that, at 4.9 percent, the rate of job openings has continued its slow decline from 7.4 percent in March 2022. The rate in May was just slightly above the rate in January 2019, although it was till above the rates during most of 2019 and early 2020, as well as the rates during most of the period following the Great Recession of 2007–2009. The rate of job openings is defined by the BLS as the number of job openings divided by the number of job openings plus the number of employed workers, multiplied by 100.
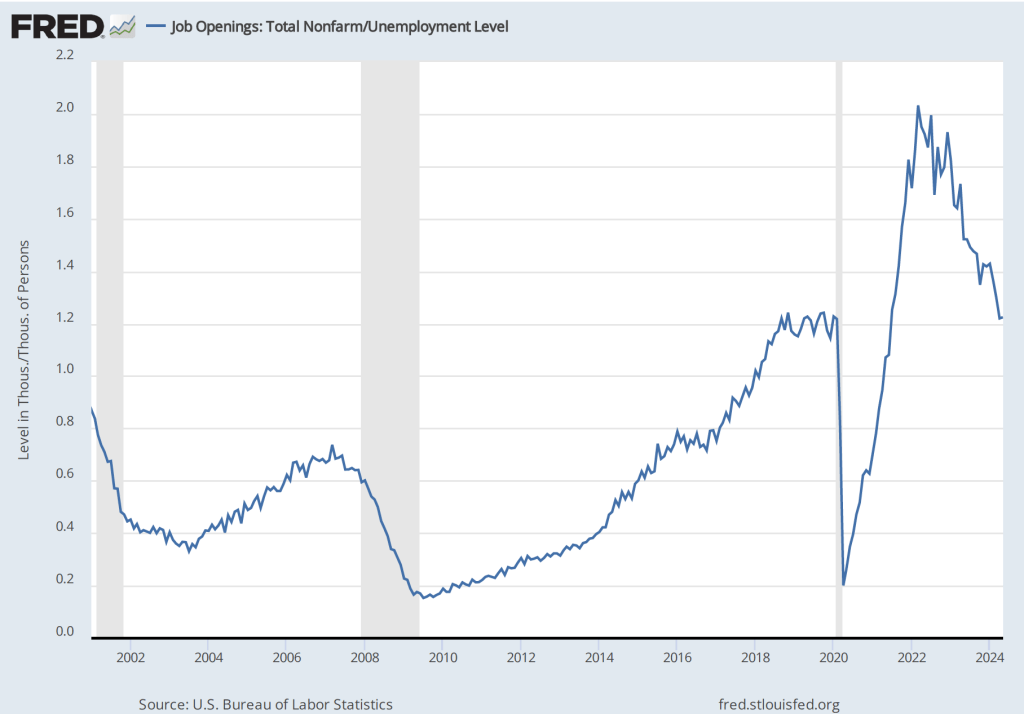
In the following figure, we compare the total number of job openings to the total number of people unemployed. The figure shows a slow decline from a peak of more than 2 job openings per unemployed person in the spring of 2022 to 1.2 job openings per employed person in May 2024—the same as in April and about the same as in 2019 and early 2020, before the pandemic. Note that the number is still above 1.0, indicating that the demand for labor is still high, although no higher than during the strong labor market of 2019.
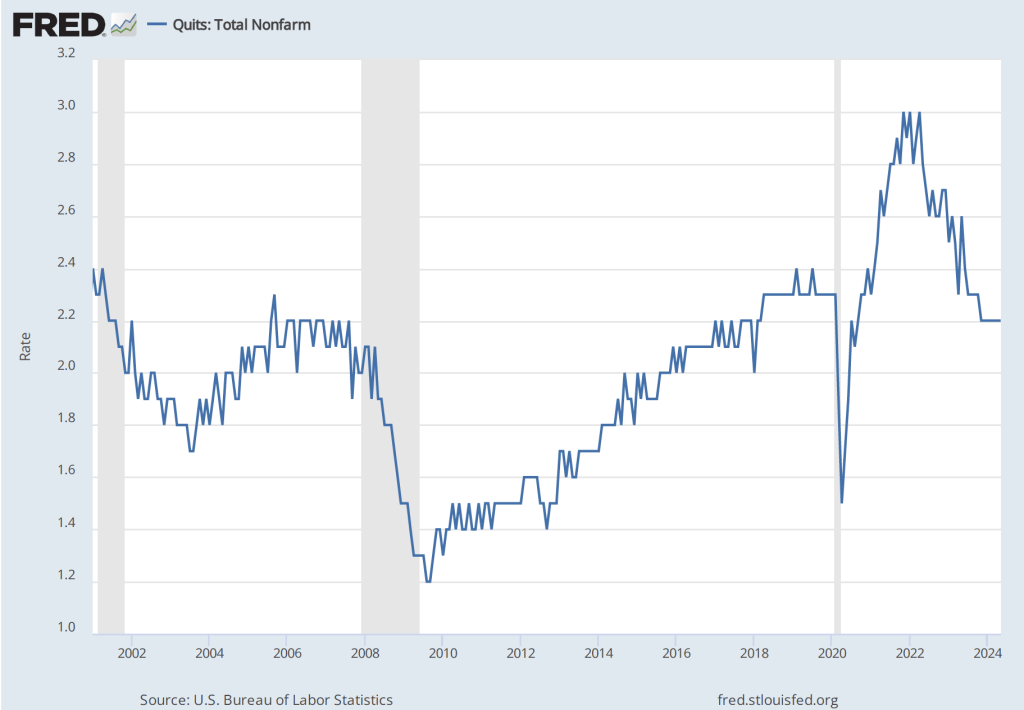
The rate at which workers are willing to quit their jobs is an indication of how they perceive the ease of finding a new job. As the following figure shows, the quit rate declined slowly from a peak of 3 percent in late 2021 and early 2022 to 2.2 percent in November 2023, where it has remained through May 2024. That rate is slightly below the rate during 2019 and early 2020. By this measure, workers perceptions of the state of the labor market seem largely unchanged in recent months.
The JOLTS data indicate that the labor market is about as strong as it was in the months priod to the start of the pandemic, but it’s not as historically tight as it was through most of 2022 and 2023. Speaking today at a conference hosted by the European Central Bank, Fed Chair Jerome Powell was quoted as saying that the Fed had made “a lot of progress” in reducing inflation and that the labor market had made “a pretty substantial” move toward a better balance between labor demand and labor supply.
On Friday morning, the BLS will release its “Employment Situation” report for June, which will provide additional data on the state of the labor market. (Note that the data in the JOLTS report lag the data in the “Employment Situation” report by one month.)
The Labor Market Continues to Cool
As we discussed in this post, most recent data are consistent with the labor market having cooled, which should reduce upward pressure on wages and prices. On Friday morning, the Bureau of Labor Statistics (BLS) released its employment report for August 2023. (The report can be found here.) On balance, the data in the report are consistent with the labor market continuing to cool.
Data from the establishment survey showed an increase in payroll employment of 187,000, which is close to the increase of 170,000 economists surveyed by the Wall Street Journal had forecast. The following figure shows monthly changes in payroll employment since January 2021.
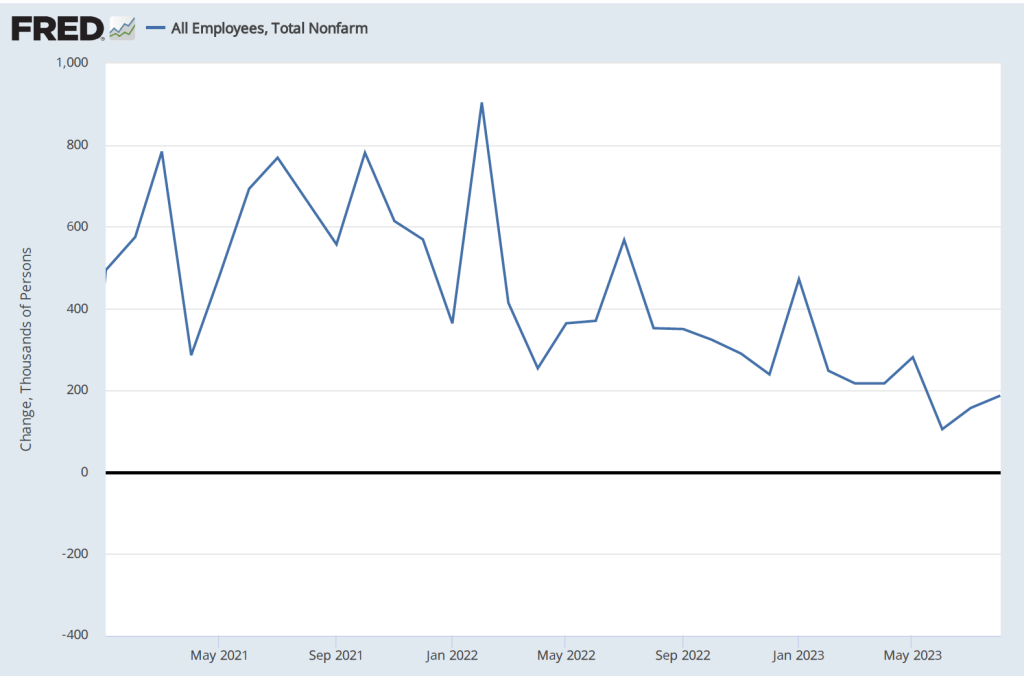
Although the month-to-month changes have been particularly volatile during this period as the U.S. economy recovered from the Covid–19 recession, the general trend in job creation has been downward. The following table shows average monthly increases in payroll employment for 2021, 2022, and 2023 through August. In the most recent three-month period, the average monthly increase in employment was 150,000.
| Period | Average Monthly Increases in Employment |
| 2021 | 606,000 |
| 2022 | 399,000 |
| Jan.-Aug. 2023 | 236,000 |
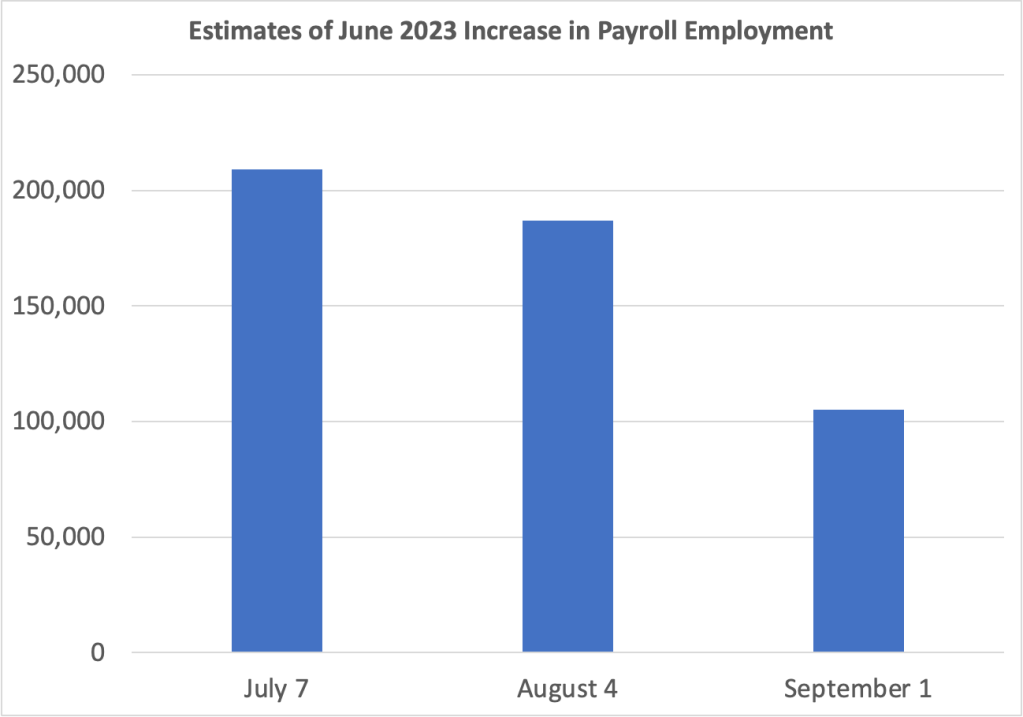
The BLS revised downward its previous estimates of employment increases in June and July by a combined 110,000. The changes to the estimate of the employment increase for June are particularly notable. As the following graph shows, on July 7, the BLS initially estimated the increase as 209,000. The BLS’s first revision on August 4, lowered the estimate to an increase of 187,000. The BLS’s second revision on September 1, lowered the estimate further to 105,000. In other words, the BLS now estimates that employment increased by only half as much in June as it initially reported. As we discuss in Macroeconomics, Chapter 9, Section 9.1 (Economics, Chapter 19, Section 19.1 and Essentials of Economics, Chapter 13, Section 13.1), the revisions that the BLS makes to its employment estimates are likely to be particularly large when the economy is about to enter a period of significantly lower or higher growth. So, the large revisions to the June employment estimate may indicate that during the summer economic growth slowed and labor market conditions eased.
Data from the household survey showed the unemployment rate increasing from 3.5 percent in July to 3.8 percent in August. The following figure shows that the unemployment rate has fluctuated in a narrow range since March 2022. Employment as estimated from the household survey increased by 222,000. The seeming paradox of the number of people employed and the unemployment rate both increasing is accounted for by the substantial 736,000 increase in the labor force.

Finally, as the first of the following figures shows, measured as the percentage change from the same month in the previous year, the increase in average hourly earnings (AHE) remained in its recent range of between 4.25 and 4.50 percent. That rate is down from its peak in mid-2022 but still above the rate of increase in 2019, before the pandemic. But, as the second figure shows, if we look at the compound rate of increase in AHE—that is the rate at which AHE would increase for the year if the current rate of monthly increase persisted over the following 11 months—we can see a significant cooling in the rate at which wages are increasing.


As a reminder, AHE are the wages and salaries per hour worked that private, nonfarm businesses pay workers. AHE don’t include the value of benefits that firms provide workers, such as contributions to 401(k) retirement accounts or health insurance. As an economy-wide average they suffer from a composition effect during periods in which employment either increases or decreases substantially because the mix of high-wage and low-wage workers may change. AHE are also subject to significant revisions. Therefore, short-range changes in AHE can sometimes be misleading indicators of the state of the labor market.
