Image generated by GTP-4o of people shopping.
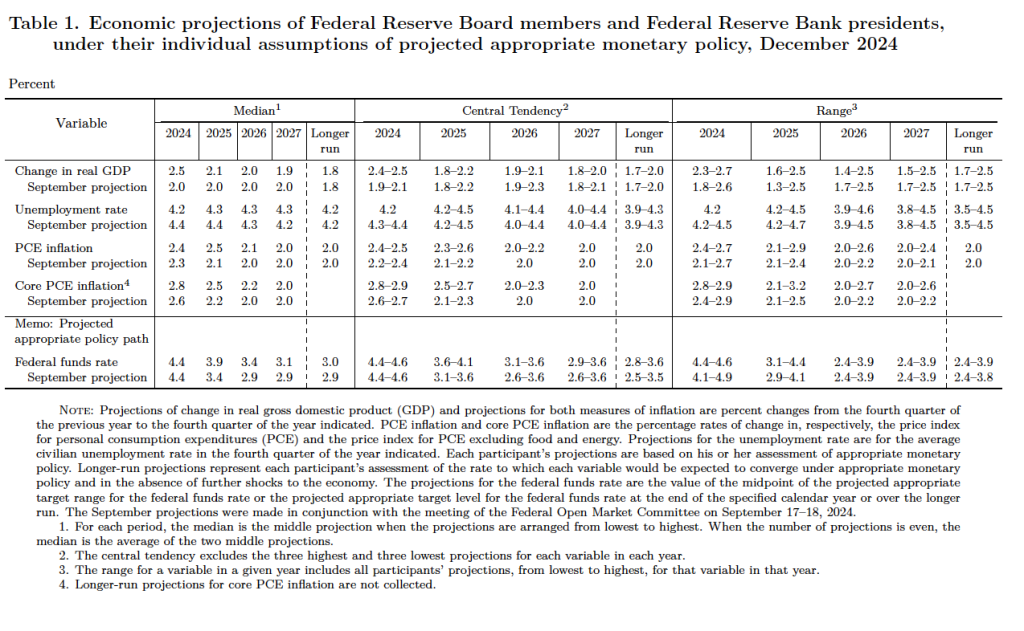
As we discussed in this blog post on Wednesday, the Federal Reserve’s policymaking Federal Open Market Committee (FOMC) voted to reduce its target for the federal funds rate by 0.25 percentage point. After the meeting, the committee released its “Summary of Economic Projections” (SEP). The SEP showed that the committee’s forecasts of the inflation rate as measured by the personal consumption expenditures (PCE) price index for this year and next year are both higher than the committee had forecast in September, when the last SEP was released. The Fed relies on annual changes in the PCE price index to evaluate whether it’s meeting its 2 percent annual inflation target.
This morning (December 20), the BEA released monthly data on the PCE price index as part of its “Personal Income and Outlays” report for November.
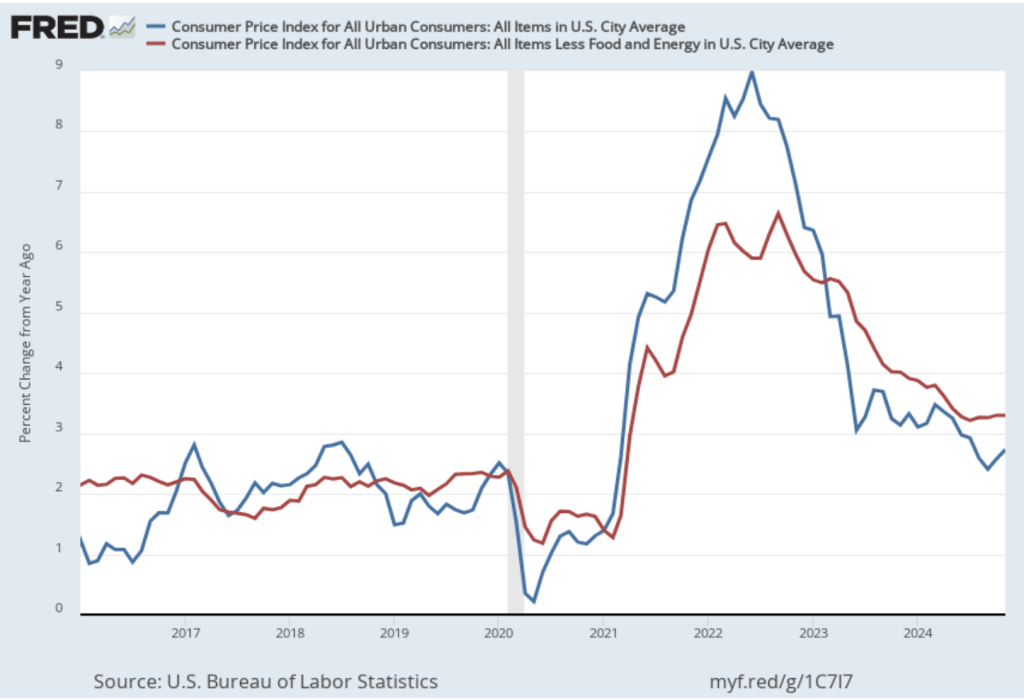
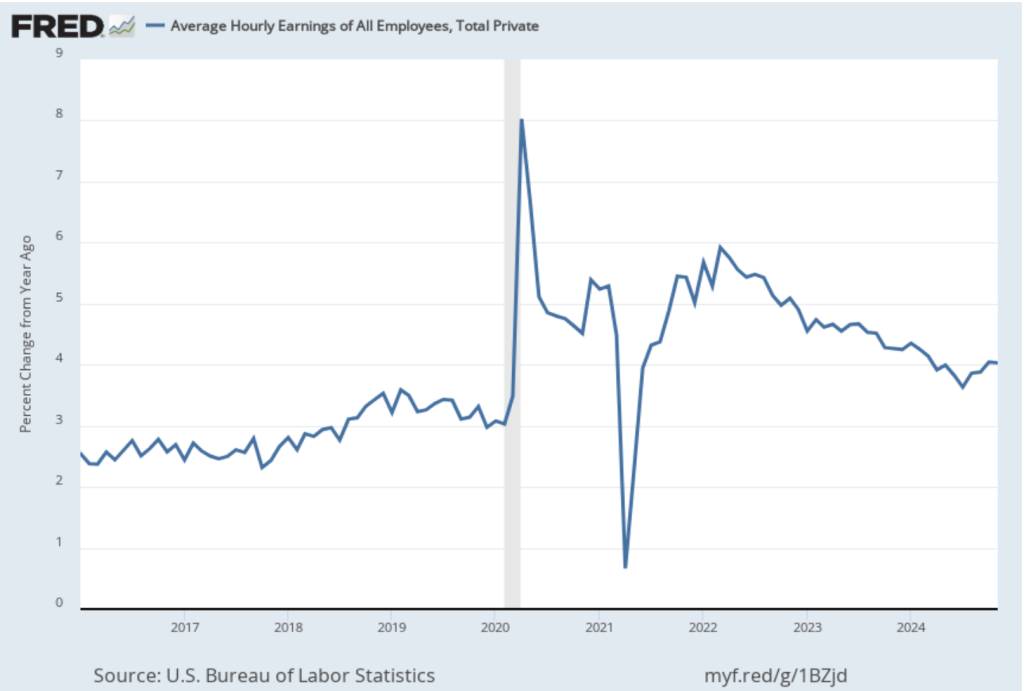
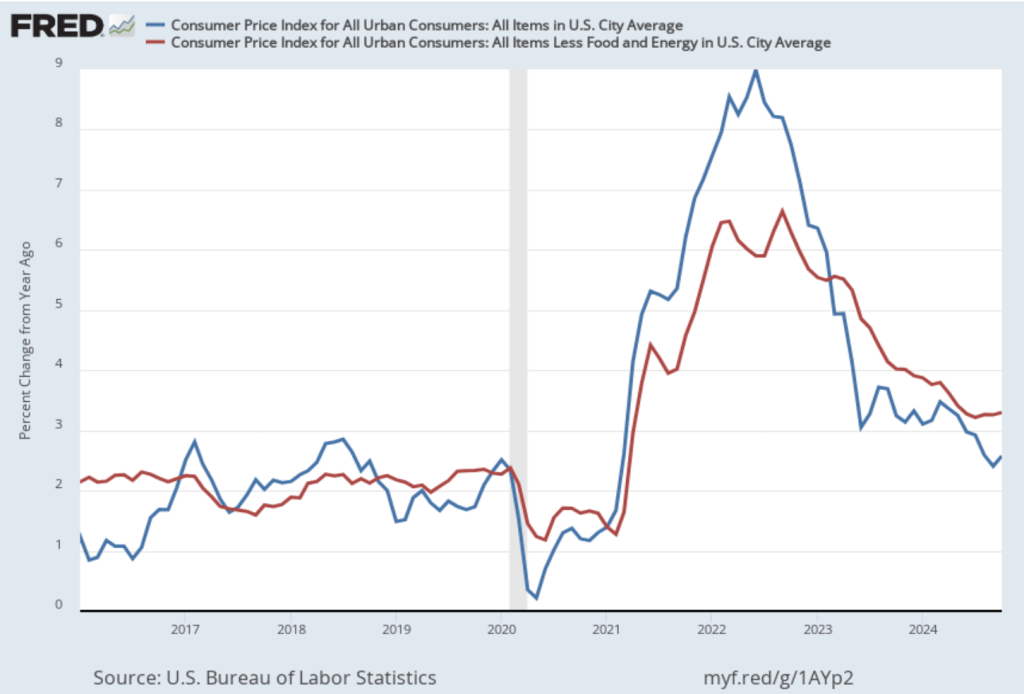
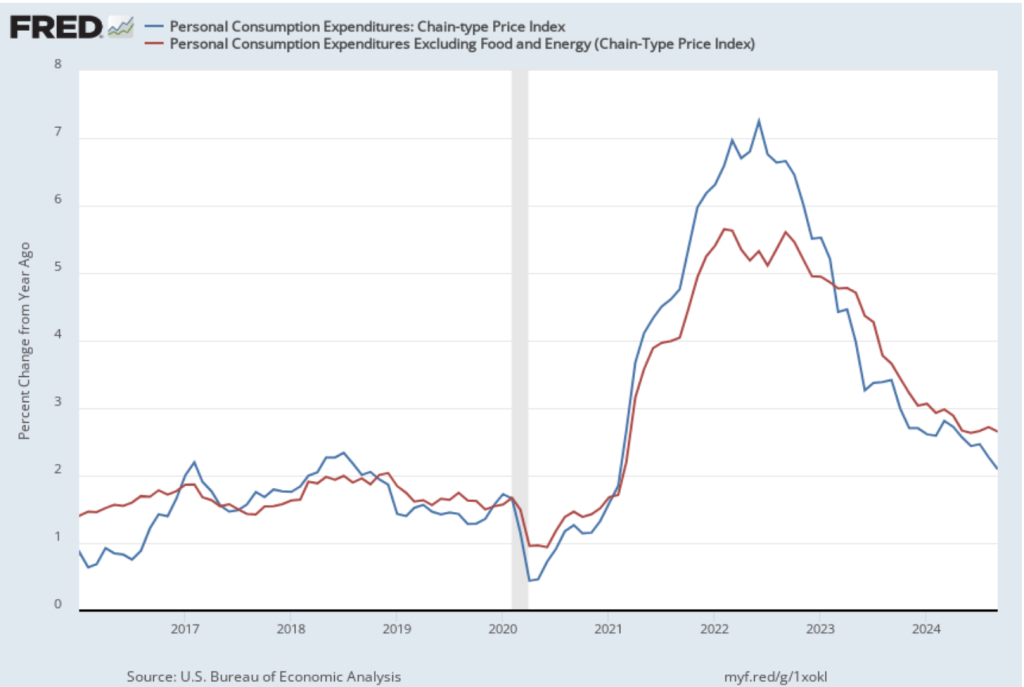
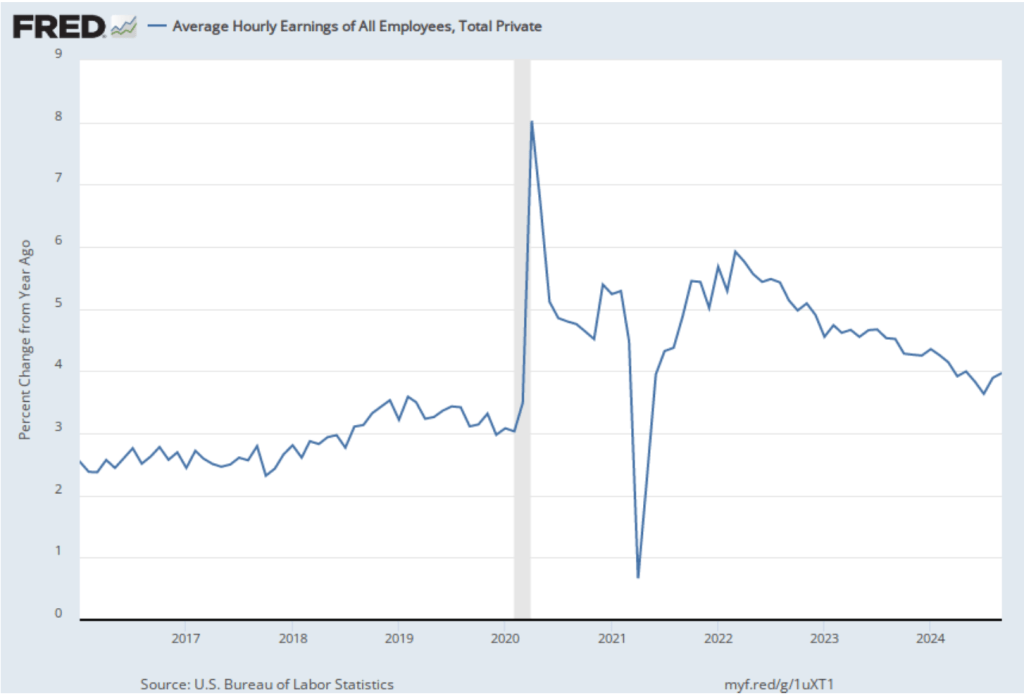
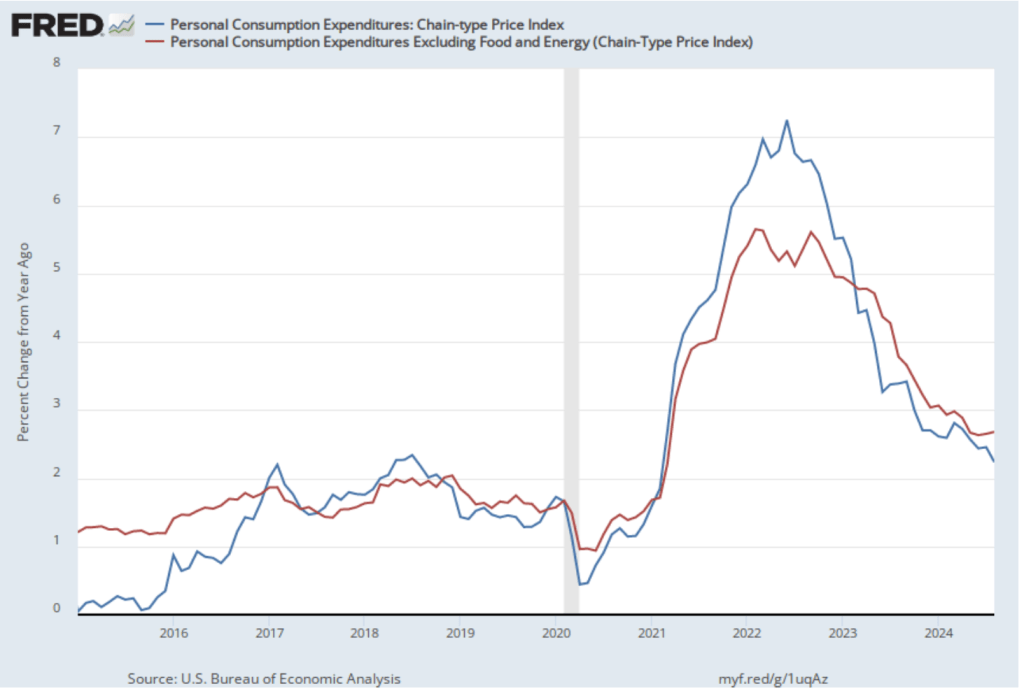
The following figure shows PCE inflation (the blue line) and core PCE inflation (the red line)—which excludes energy and food prices—for the period since January 2016 with inflation measured as the percentage change in the PCE from the same month in the previous year. Measured this way, in November PCE inflation was 2.4 percent, up from 2.3 percent in October. Core PCE inflation in November was 2.8 percent, unchanged from October. Both PCE inflation and core PCE inflation were slightly lower than the expectations of economists surveyed before the data were released.
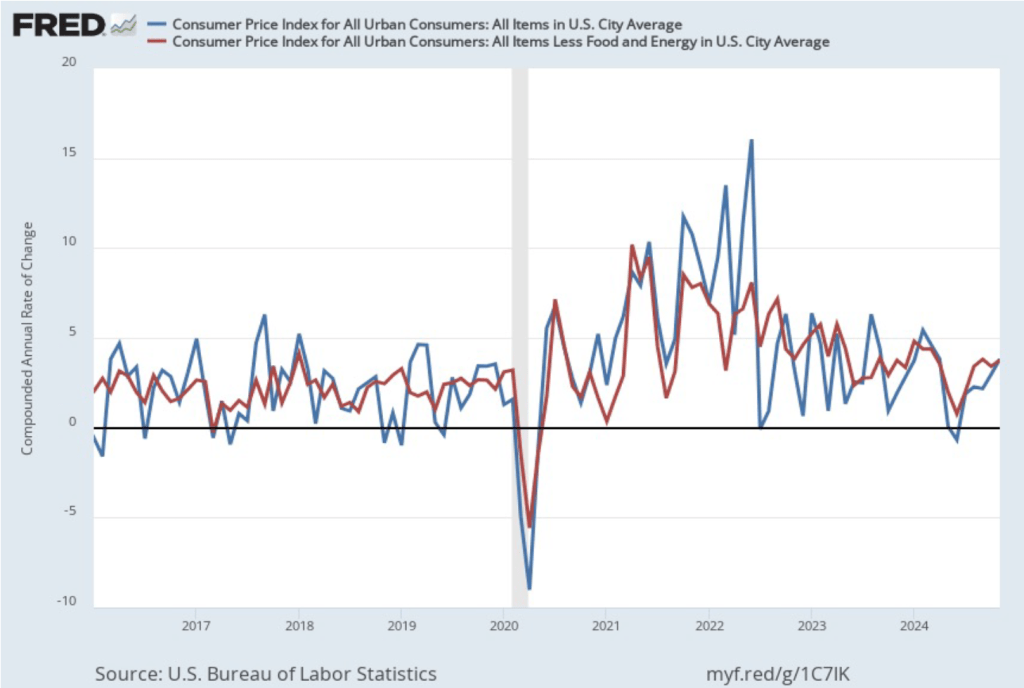
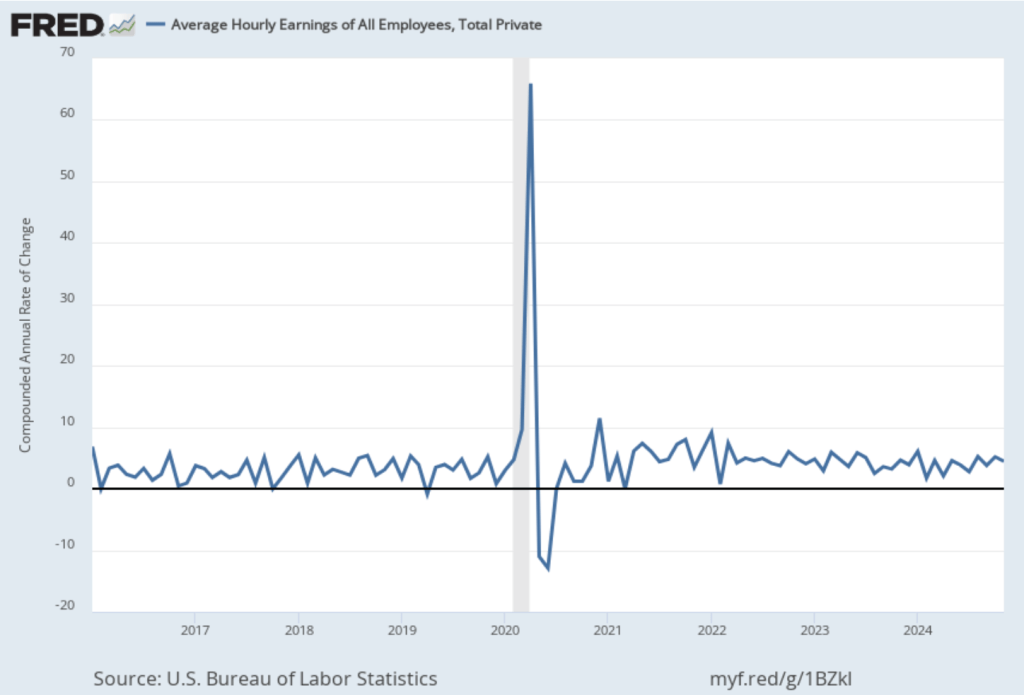
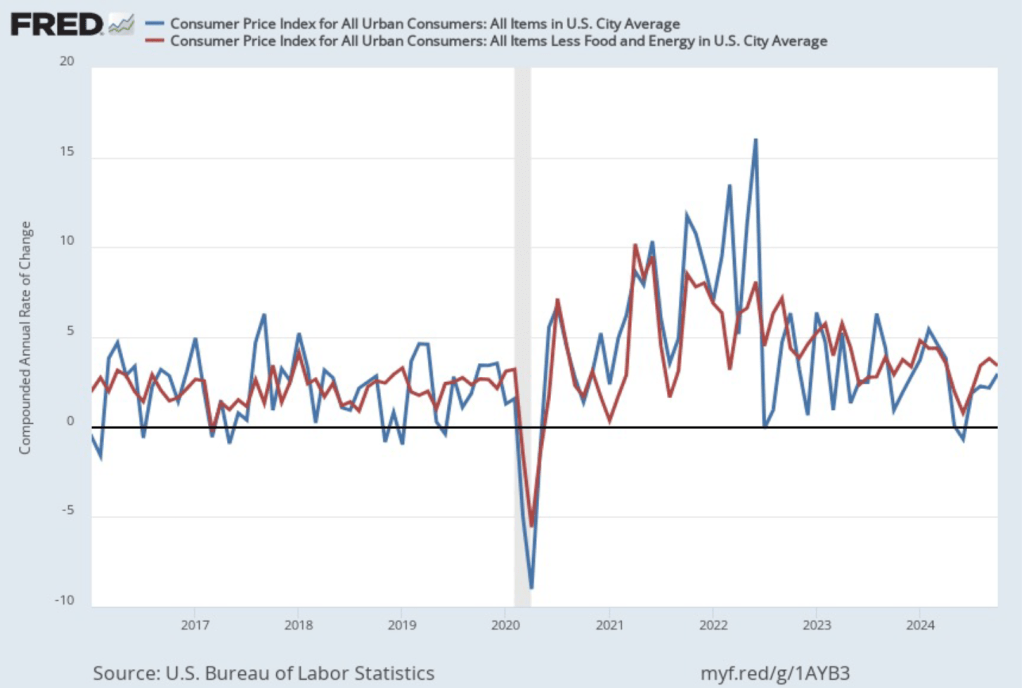
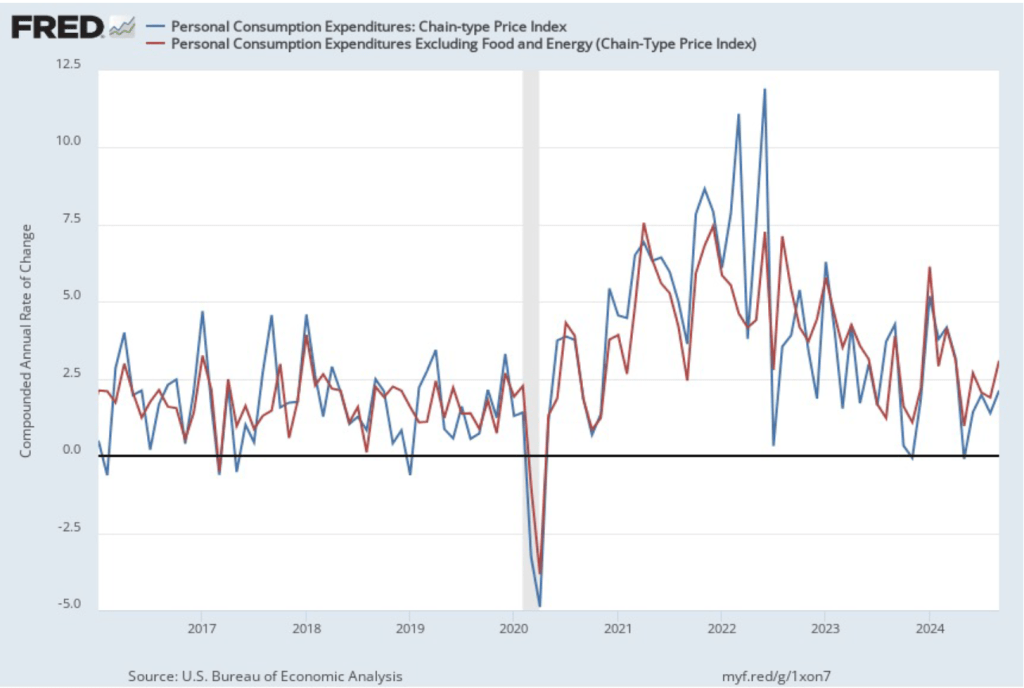
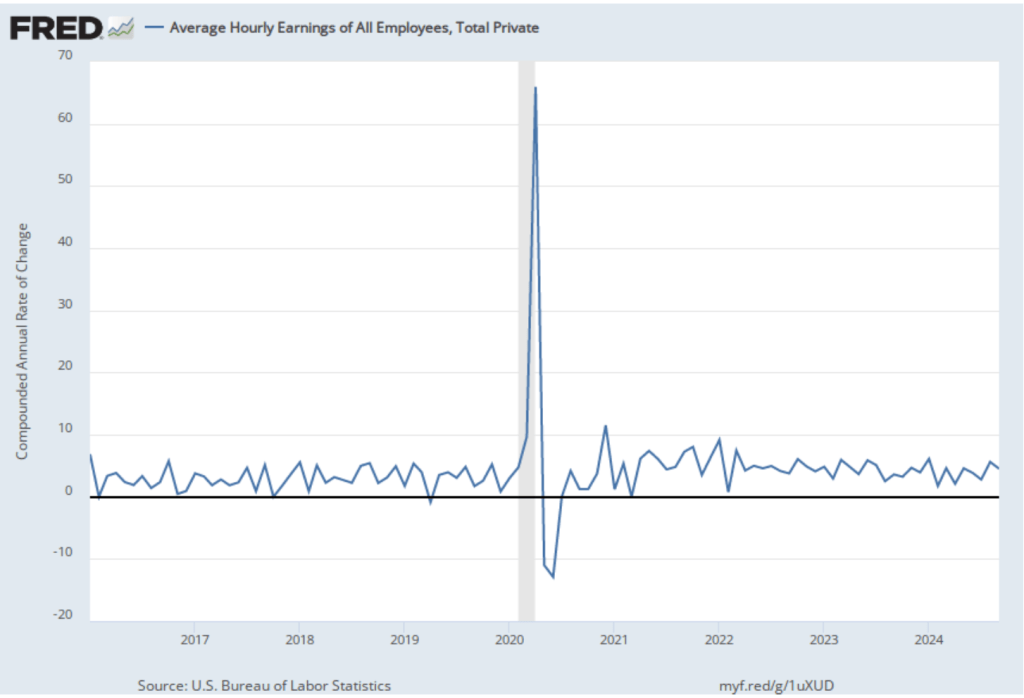
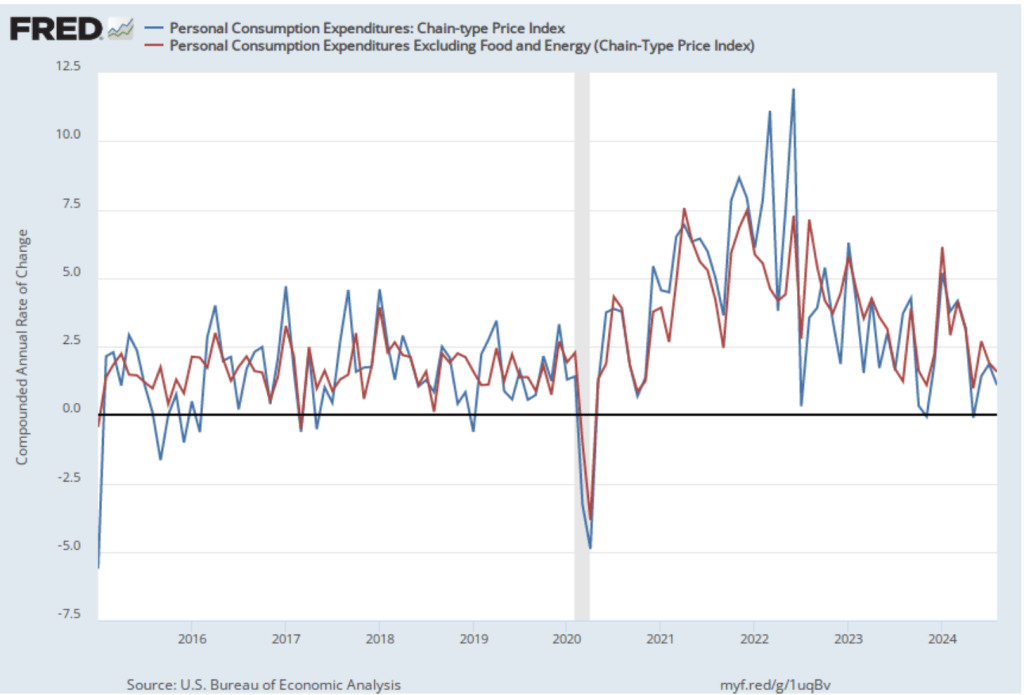
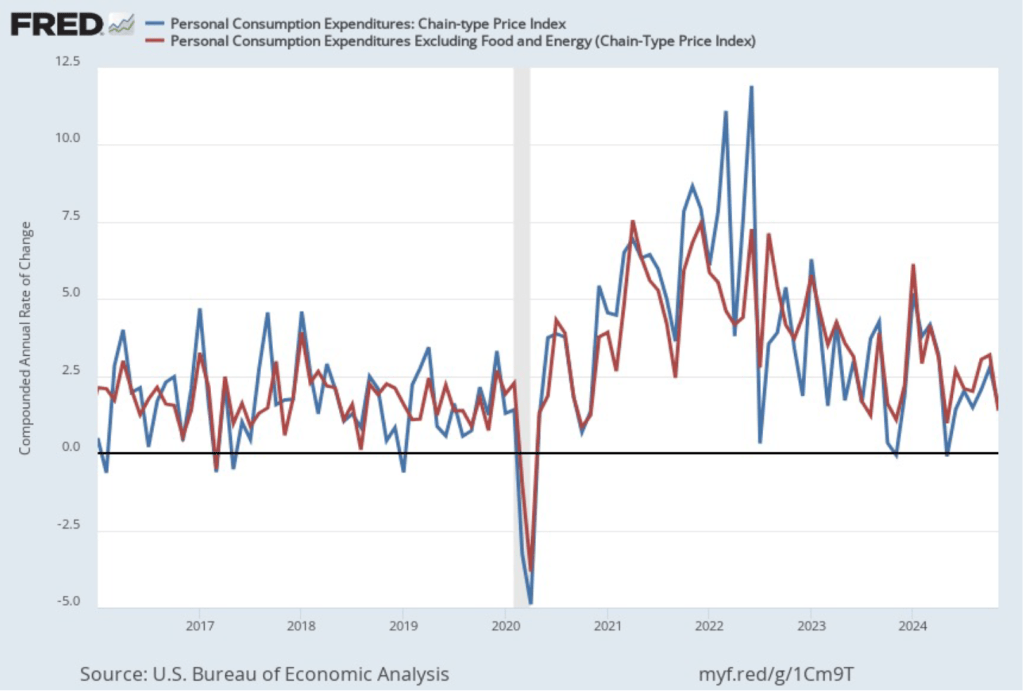
The following figure shows PCE inflation and core PCE inflation calculated by compounding the current month’s rate over an entire year. (The figure above shows what is sometimes called 12-month inflation, while this figure shows 1-month inflation.) Measured this way, PCE inflation fell sharply in November to 1.5 percent from 2.8 percent in October. Core PCE inflation also fell from 3.2 percent in October to 1.4 percent in November. Although both 12-month PCE inflation and 12-month core PCE inflation remained above the Fed’s 2 percent annual inflation target, 1-month PCE inflation and 1-month core PCE inflation dropped to well below the inflation target. But the usual caution applies that data from one month shouldn’t be overly relied on; it’s far too soon to draw the conclusion that inflation is likely to remain below the 2 percent target in future months.
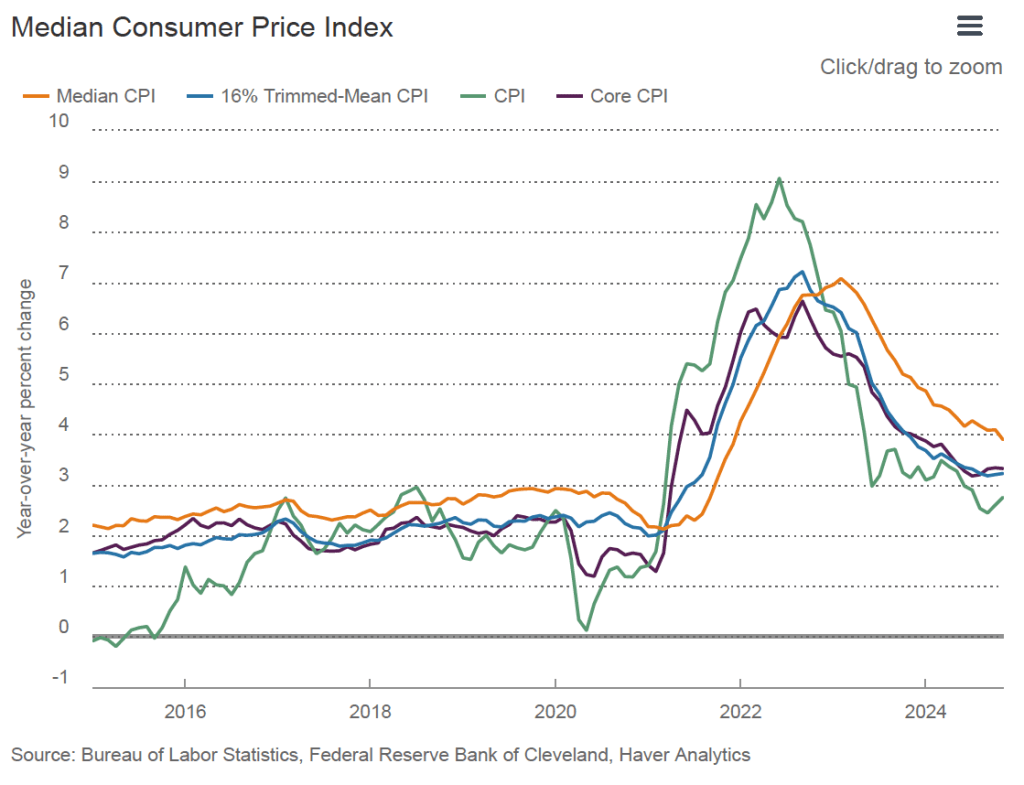
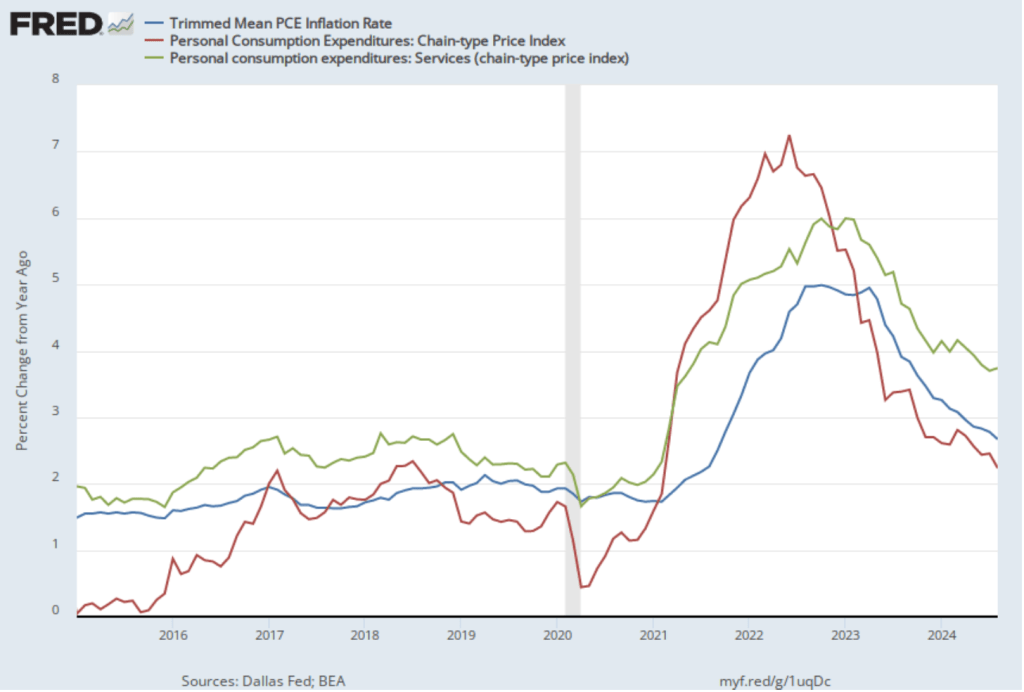
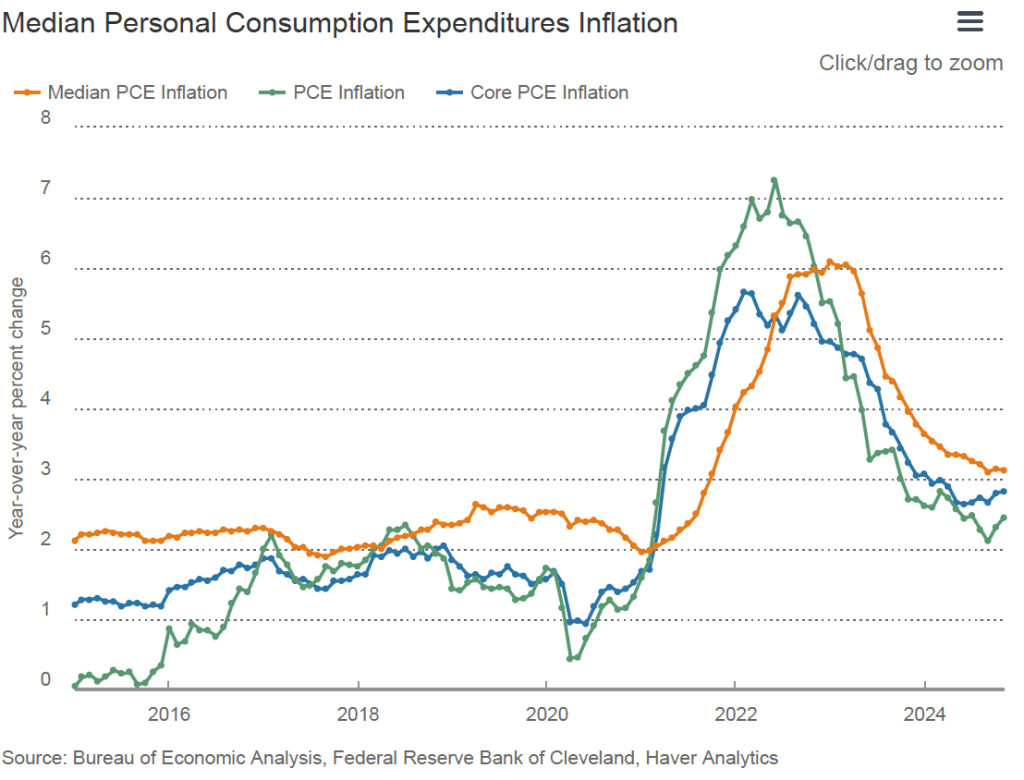
Median inflation is calculated by economists at the Federal Reserve Bank of Cleveland and Ohio State University as another way of measuring the underlying trend in inflation. If we listed the inflation rate for each individual good or service included in the PCE, median inflation is the inflation rate of the good or service that is in the middle of the list—that is, the inflation rate in the price of the good or service that has an equal number of higher and lower inflation rates. The following figure from the Federal Reserve Bank of Cleveland includes, along with PCE inflation (the green line) and core PCE inflation (the blue line), median PCE inflation (the orange line). All three inflation rates are measured over 12 months. Median PCE inflation in November was 3.1 percent, unchanged from October.
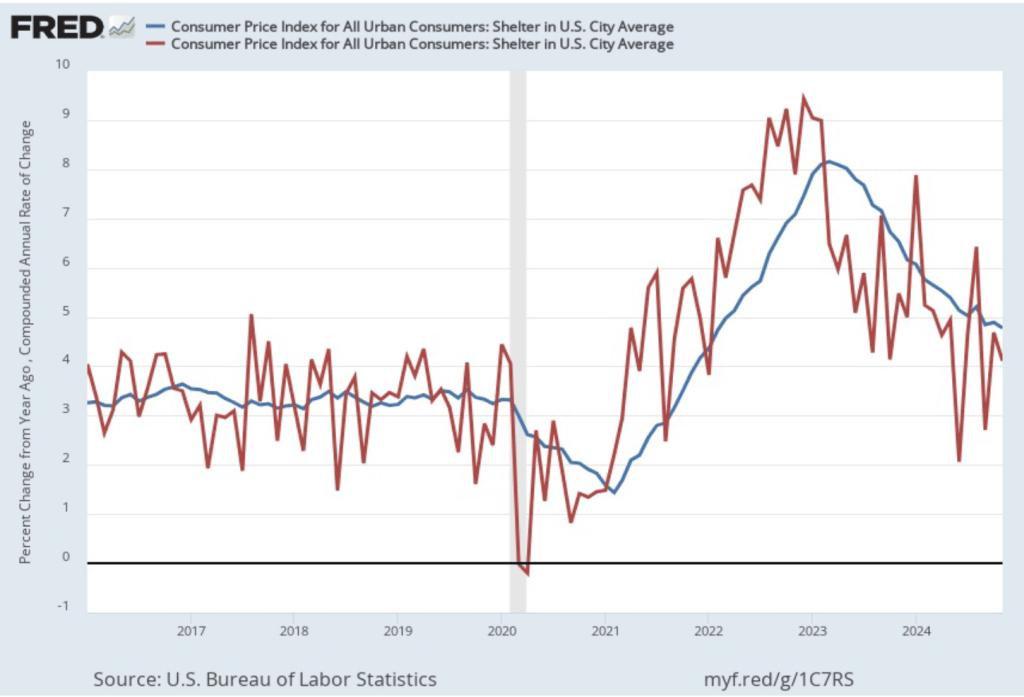
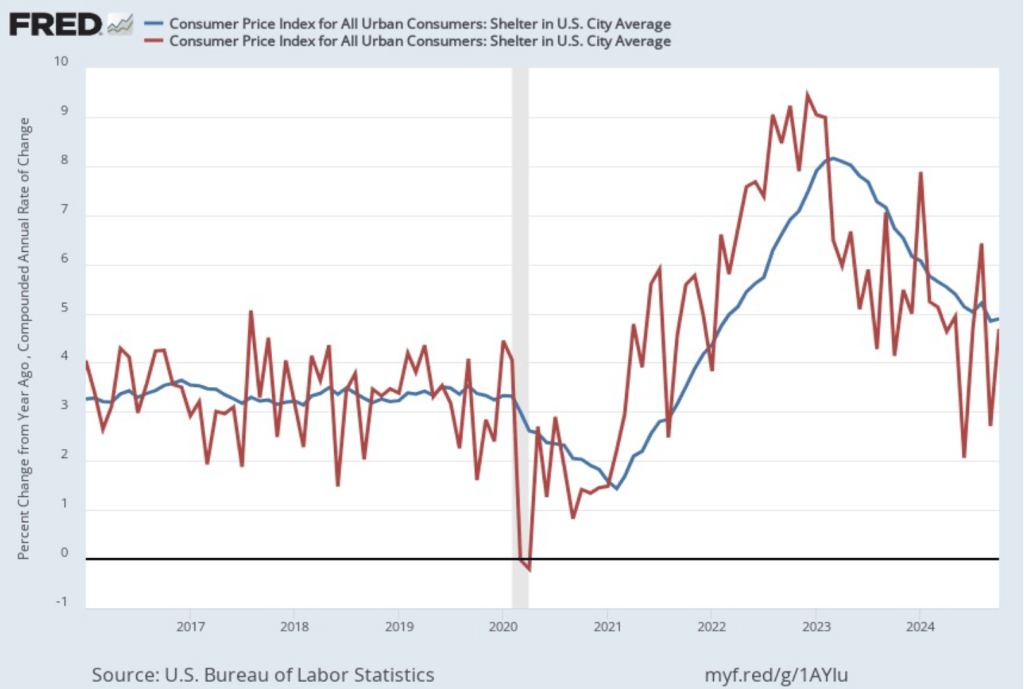
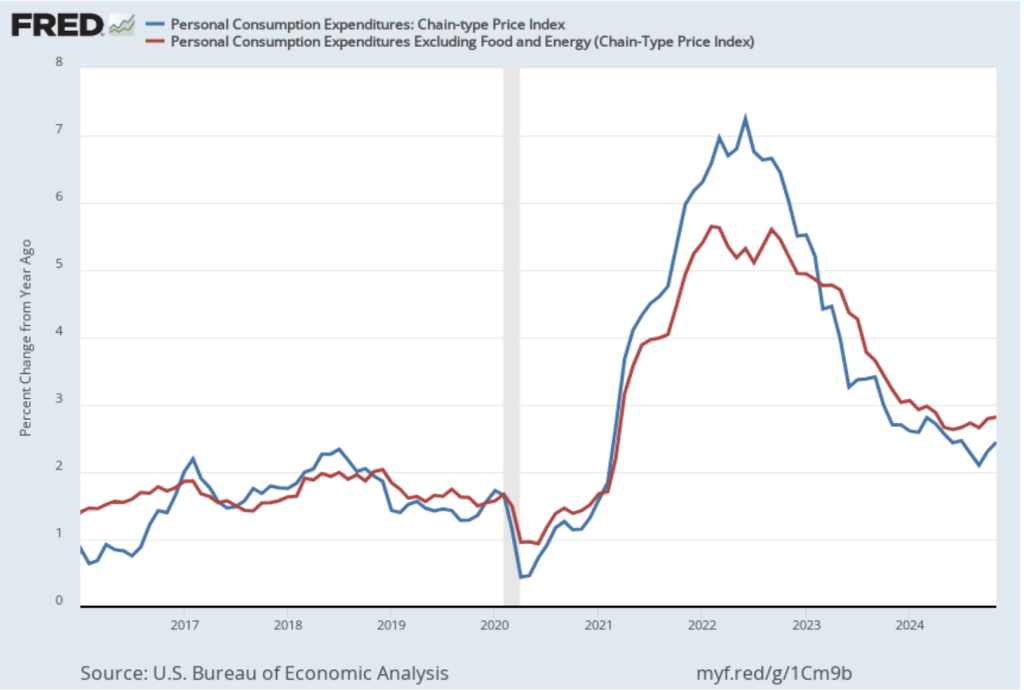
In his press conference earlier this week, Fed Chair Jerome Powell noted that: “we’ve had recent high readings from non-market services.” Non-market services are services whose prices the BEA imputes rather than measures directly. For instance, the BEA assumes that prices of financial services—such as brokerage fees—vary with the prices of financial assets. So that if stock prices rise, the prices of financial services included in the PCE price index also rise. Powell argued that these imputed prices “don’t really tell us much about … tightness in the economy. They don’t really reflect that.” The following figure shows 12-month inflation (the blue line) and 1-month inflation (the red line) for market-based PCE, excluding the prices of food and energy. (The BEA explains the market-based PCE measure here.)
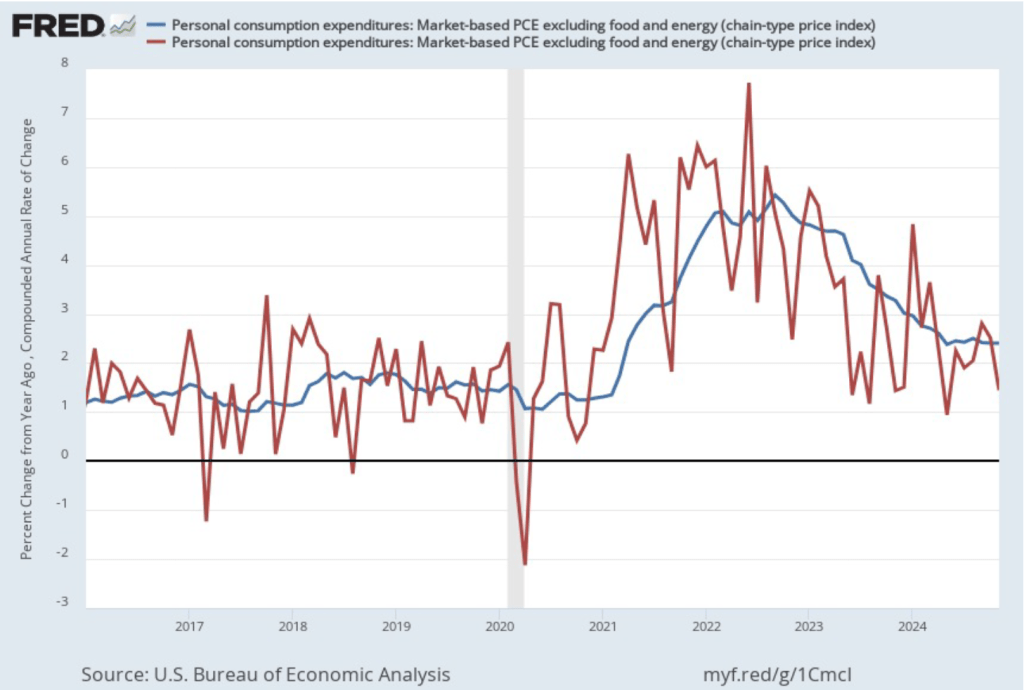
These measures of inflation tell a similar story to the measures considered earlier: 12-month inflation continues to run above the Fed’s 2 percent inflation target, while 1-month inflation slowed significantly in November and is below the 2 percent target. By this measure 12-month inflation was unchanged in November at 2.4 percent, while 1-month inflation declined from 2.5 percent in October to 1.4 percent in November.
To summarize, the less volatile 12-month measures of inflation show it to be persistently above the Fed’s target, while the more volatile 1-month measures show inflation to have fallen below target. If the FOMC were to emphasize the 1-month measures, we might expect them to continue cutting the target for the federal funds rate at the committee’s next meeting on January 28-29. The more likely outcome is that, unless other macroeconomic data that are released between now and that meeting indicate a significant strengthening or weakening of the economy, the committee will leave its target for the federal funds rate unchanged. (The BEA’s next release of monthly PCE data won’t occur until January 31, which is after the FOMC meeting.)
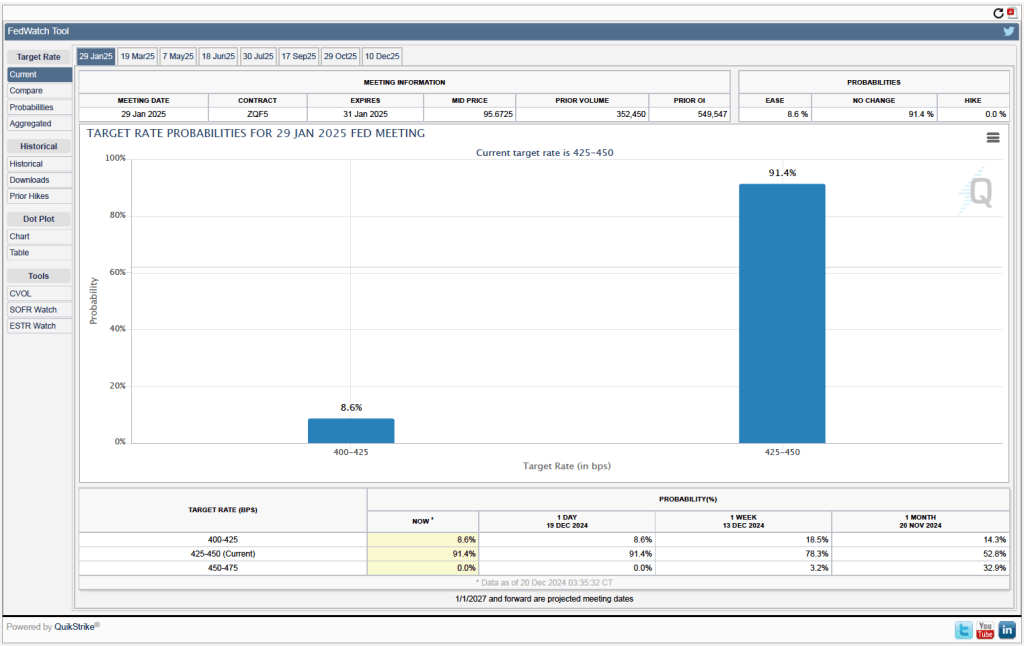
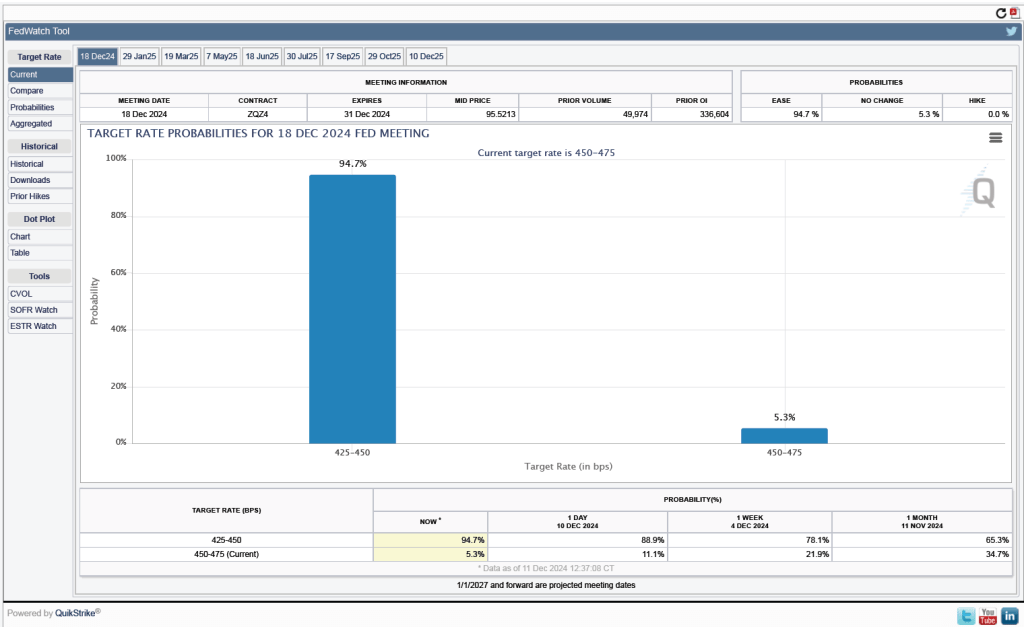
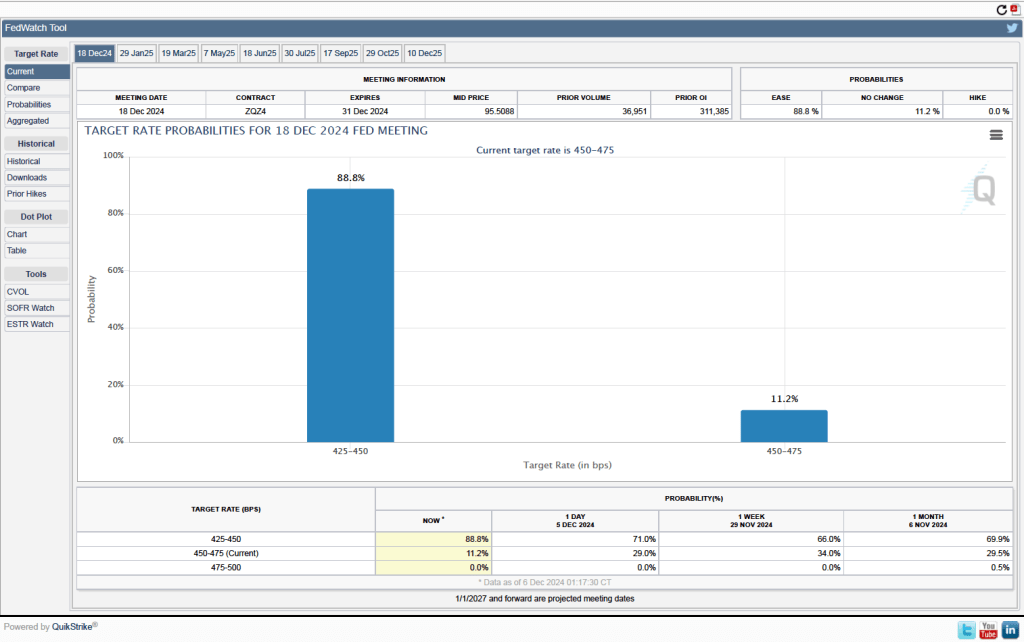
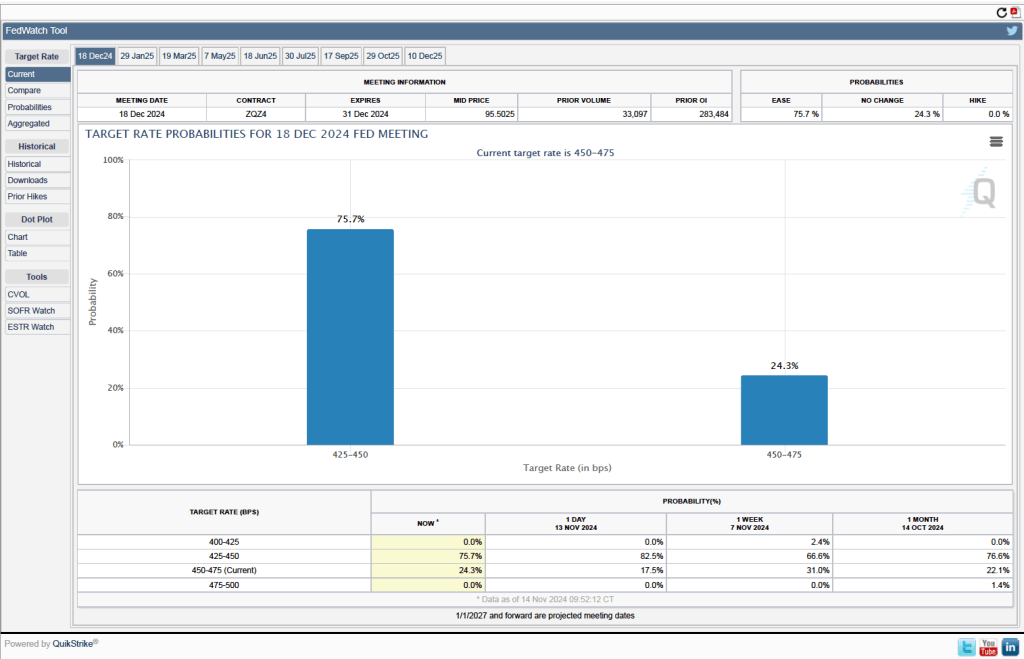
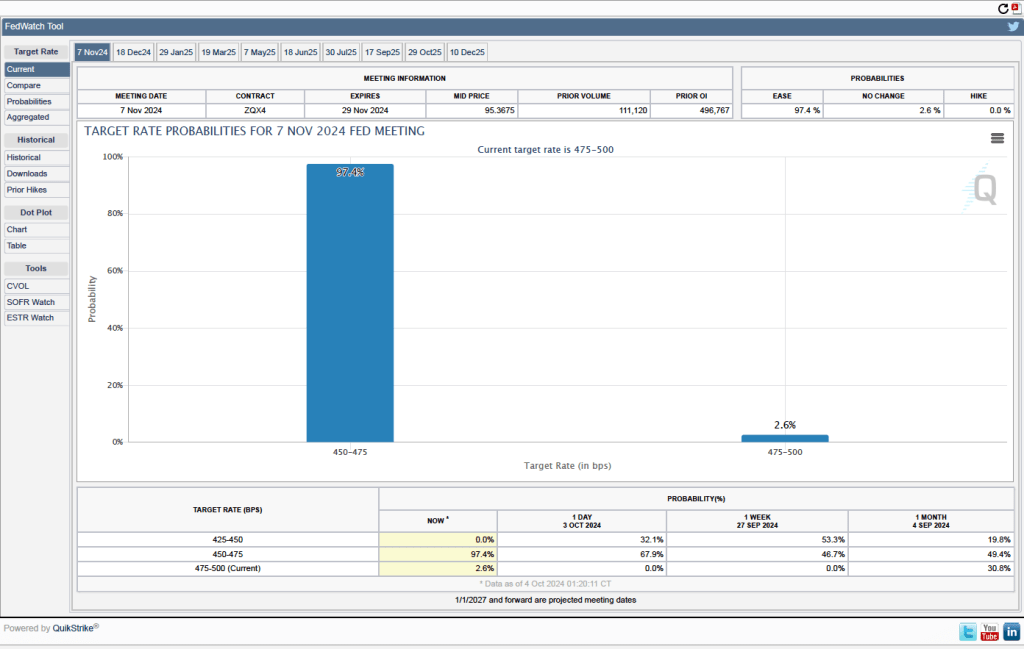
Investors who buy and sell federal funds futures contracts expect that the FOMC will leave its federal funds rate target unchanged at its next meeting. (We discuss the futures market for federal funds in this blog post.) As shown in the following figure, investors assign a probability of 91.4 percent to the FOMC leaving its target for the federal funds rate at the current range of 4.25 percent to 4.50. Investors assign a probability of only 8.6 percent to the FOMC cutting its target by 0.25 percentage point.