The FOMC Leaves Its Target for the Federal Funds Rate Unchanged, while Noting an Increase in Economic Uncertainty

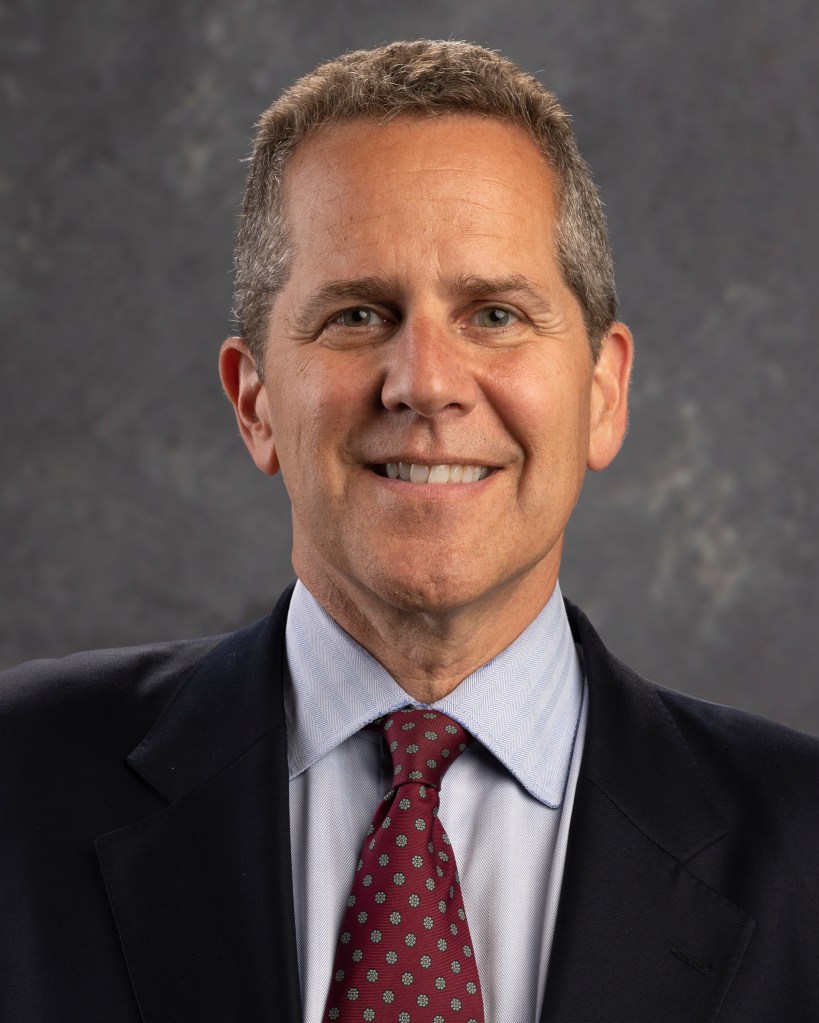
Fed Chair Jerome Powell speaking at a press conference following a meeting of the FOMC (photo from federalreserve.gov)

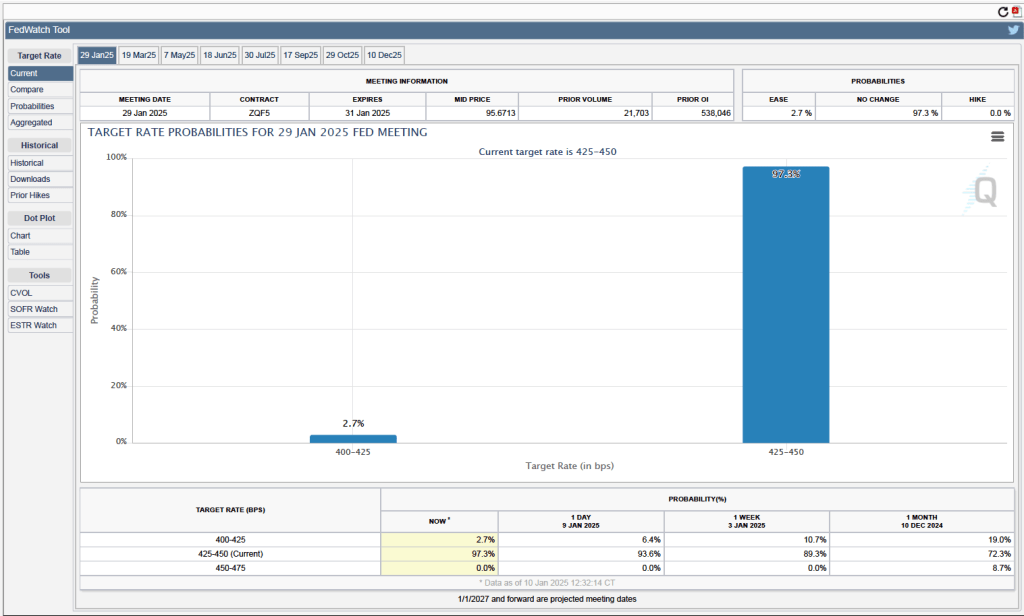
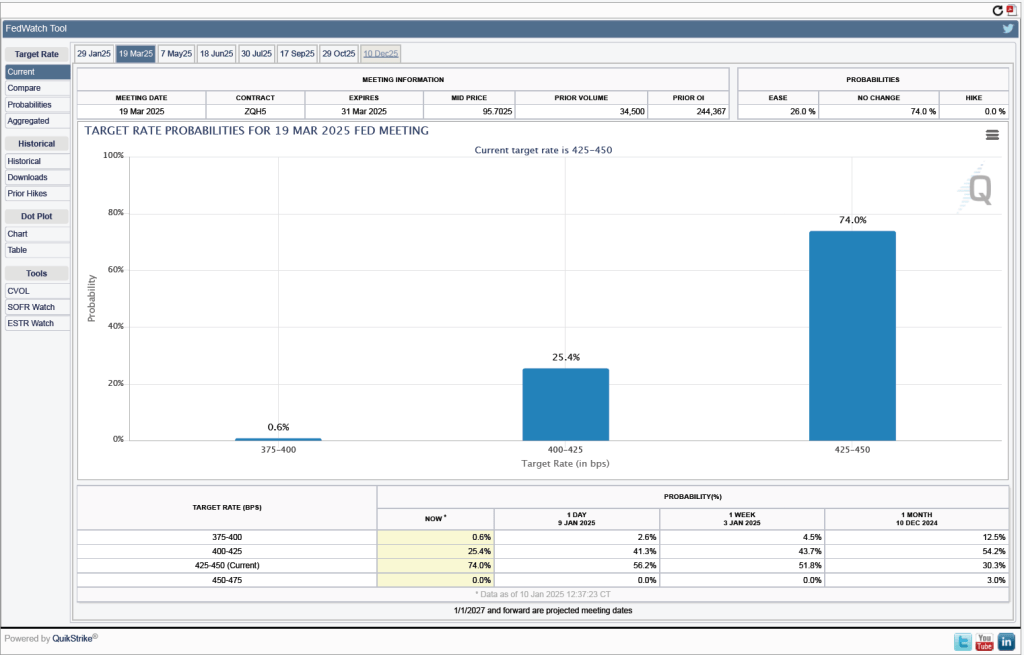
As they had before their previous meeting, members of the Fed’s Federal Open Market Committee (FOMC) had signaled that the committee was likely to leave its target range for the federal funds rate unchanged at 4.25 percent to 4.50 percent at its meeting today (March 19). In a press conference following the meeting, Fed Chair Jerome Powell noted that the FOMC was facing significant policy uncertainty:

“Looking ahead, the new Administration is in the process of implementing significant policy changes in four distinct areas: trade, immigration, fiscal policy, and regulation…. While there have been recent developments in some of these areas, especially trade policy, uncertainty around the changes and their effects on the economic outlook is high…. We do not need to be in a hurry to adjust our policy stance, and we are well positioned to wait for greater clarity.”

The next scheduled meeting of the FOMC is May 6–7. It seems likely that the committee will also keep its target rate constant at that meeting. Although at his press conference, Powell noted that “Policy is not on a preset course. As the economy evolves, we will adjust our policy stance in a manner that best promotes our maximum employment and price stability goals.” The statement the committee released after the meeting showed that the decision to leave the target rate unchanged was unanimous.

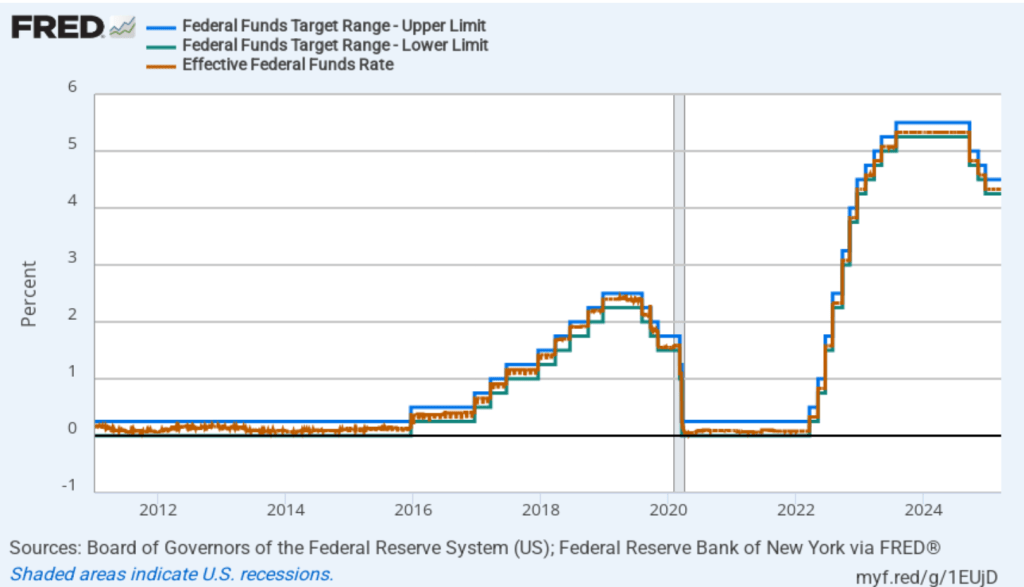
The following figure shows, for the period since January 2010, the upper bound (the blue line) and lower bound (the green line) for the FOMC’s target range for the federal funds rate and the actual values of the federal funds rate (the red line) during that time. Note that the Fed is successful in keeping the value of the federal funds rate in its target range. (We discuss the monetary policy tools the FOMC uses to maintain the federal funds rate in its target range in Macroeconomics, Chapter 15, Section 15.2 (Economics, Chapter 25, Section 25.2).)

After the meeting, the committee also released a “Summary of Economic Projections” (SEP)—as it typically does after its March, June, September, and December meetings. The SEP presents median values of the 18 committee members’ forecasts of key economic variables. The values are summarized in the following table, reproduced from the release.

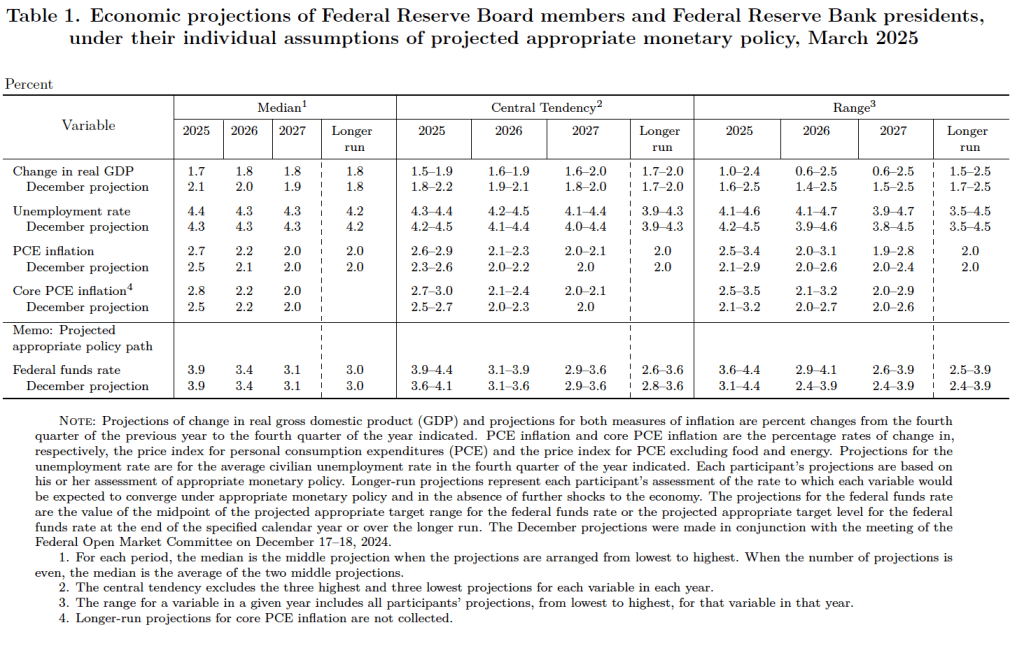
There are several aspects of these forecasts worth noting:

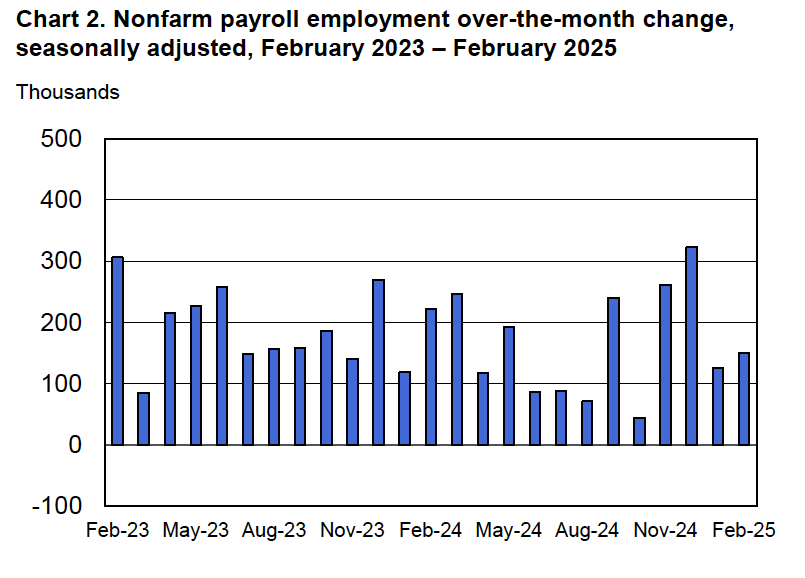
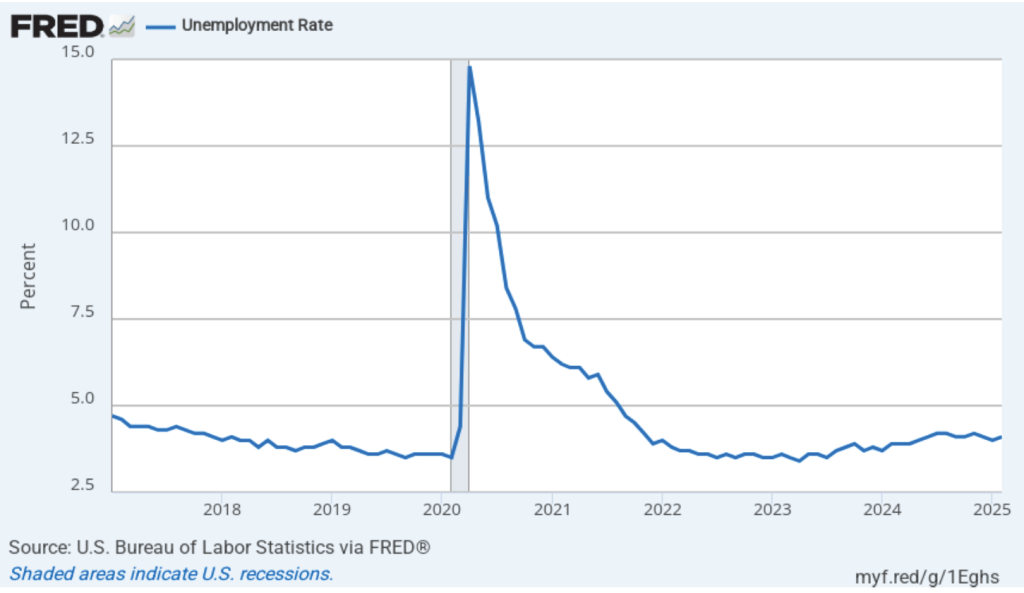
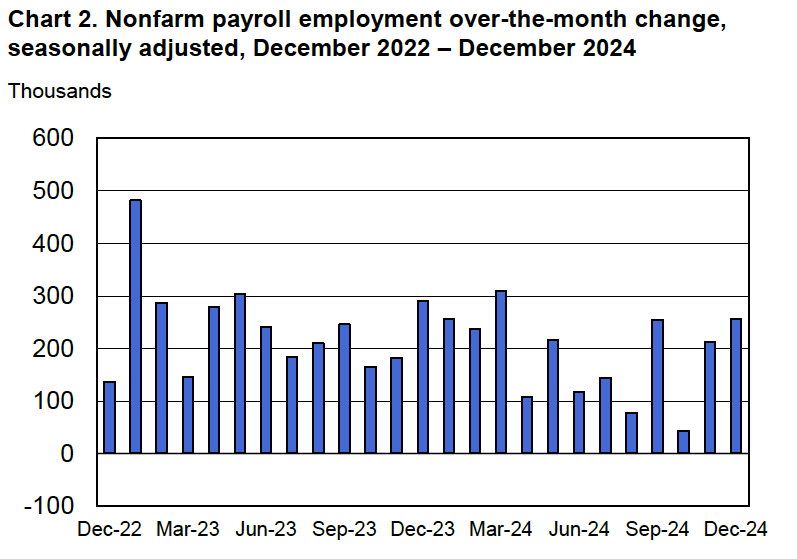
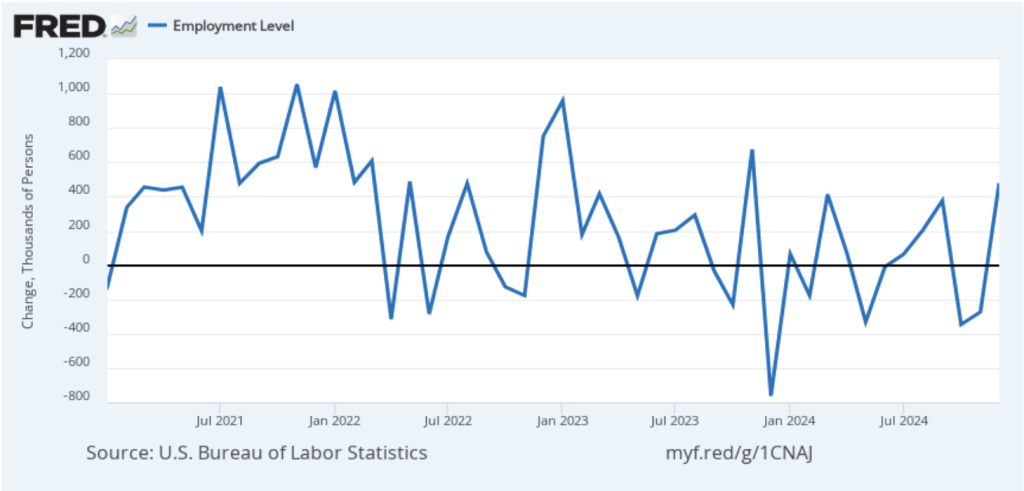
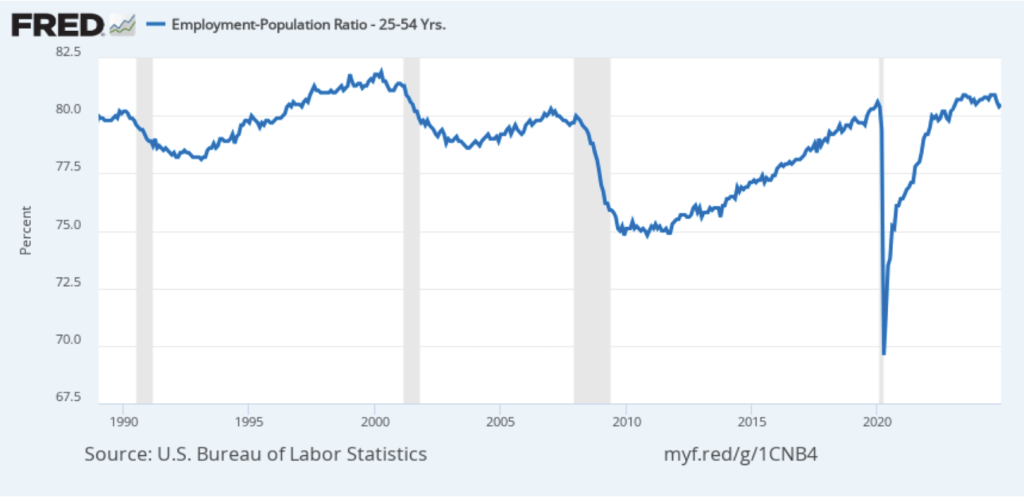
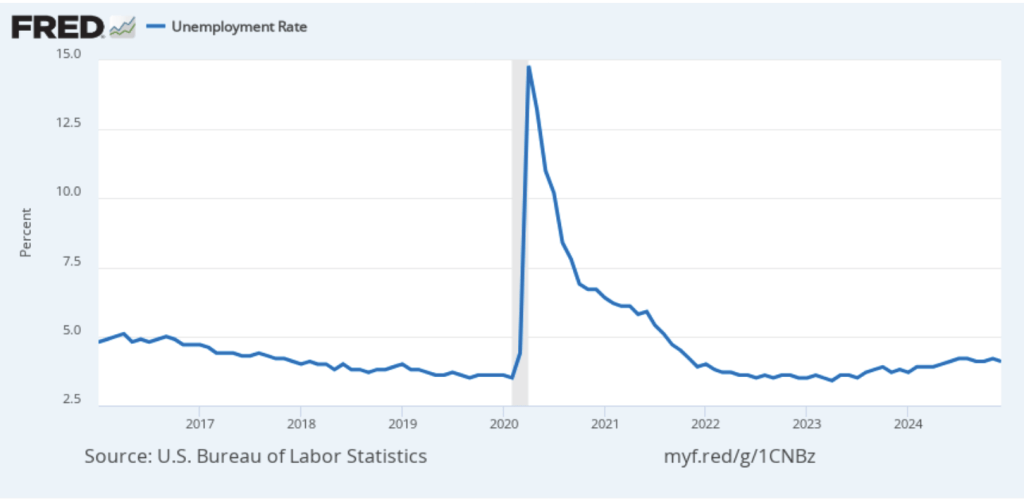
  1. Committee members reduced their forecast of real GDP growth for 2025 from 2.1 percent in December to 1.7 percent today. Committee members also slightly increased their forecast of the unemployment rate at the end of 2025 from 4.3 percent to 4.4 percent. (The unemployment rate in February was 4.1 percent.)
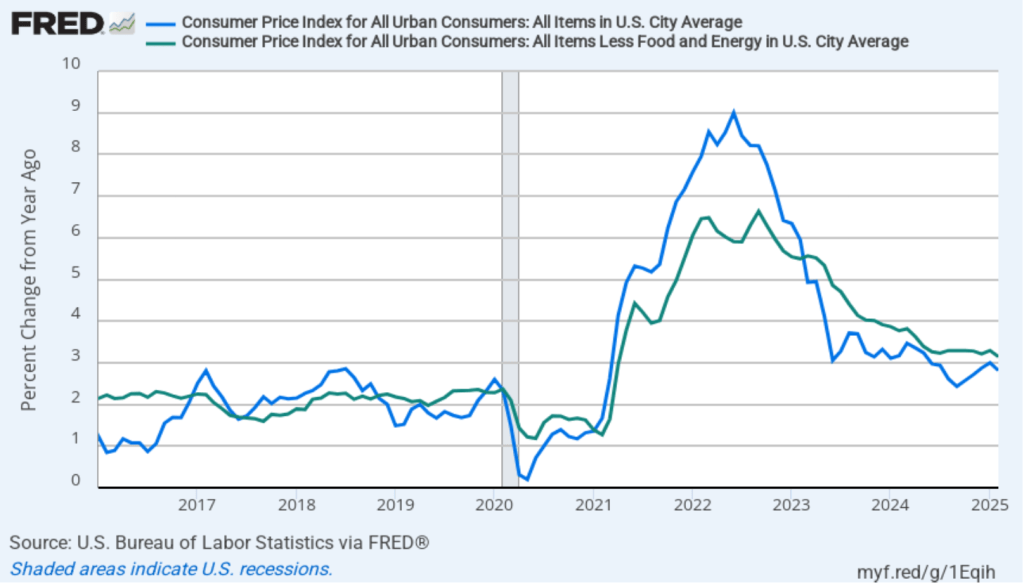
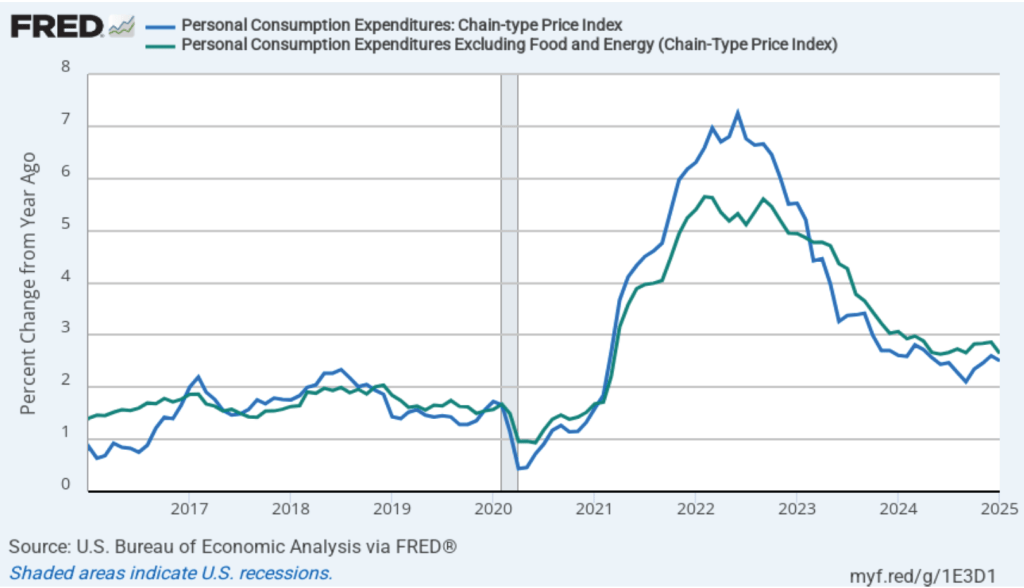
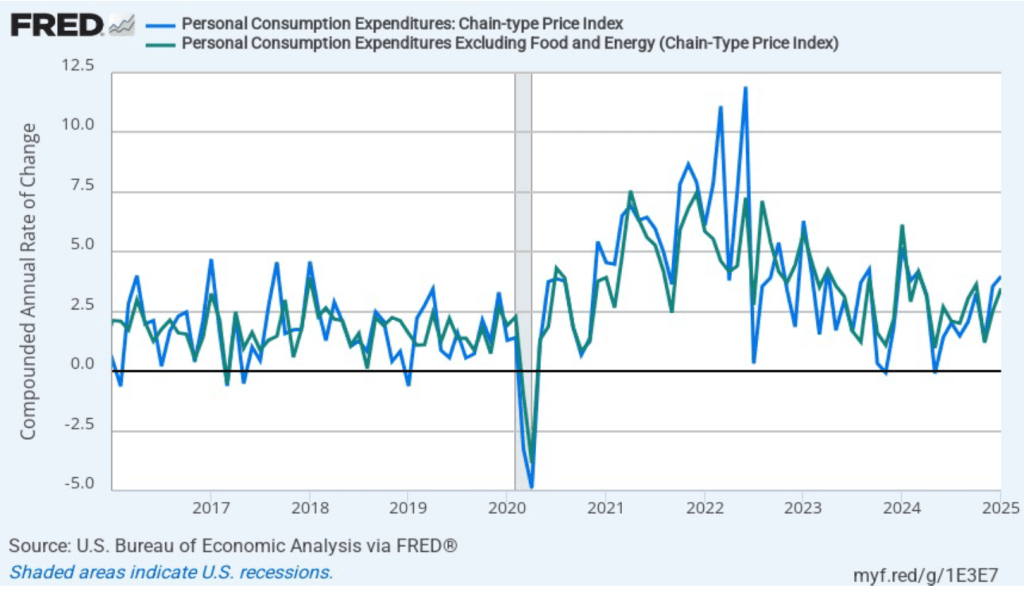
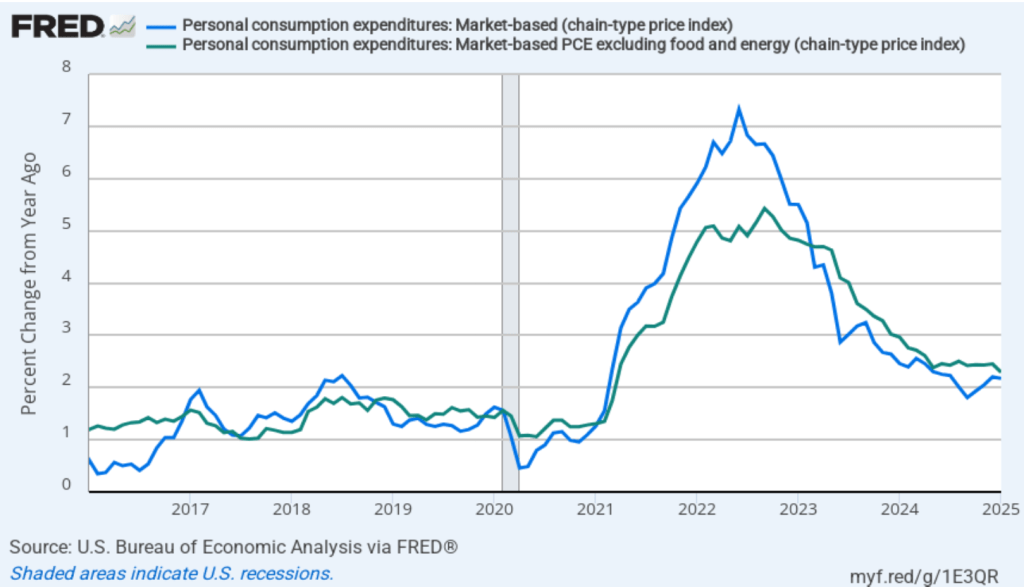
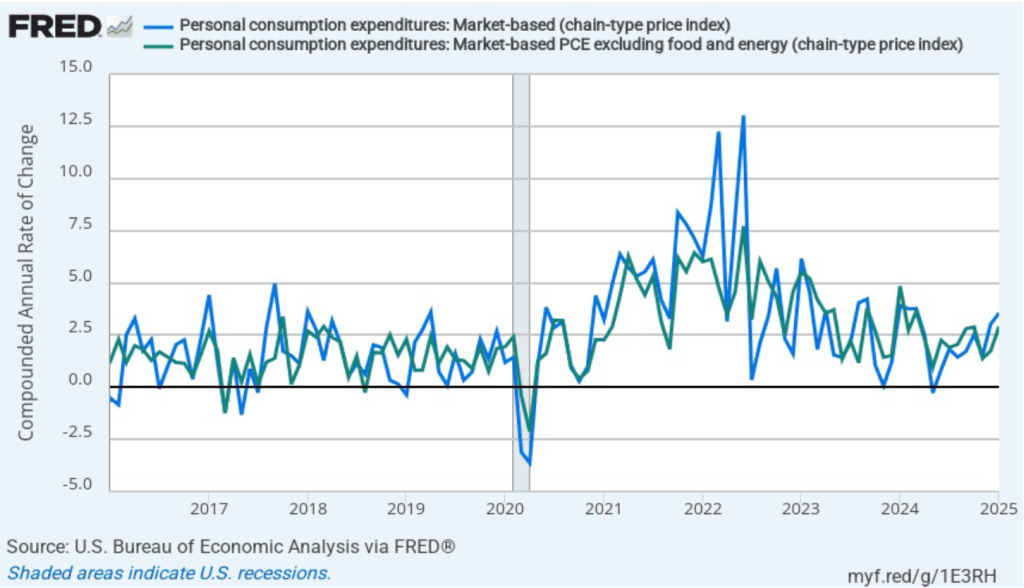
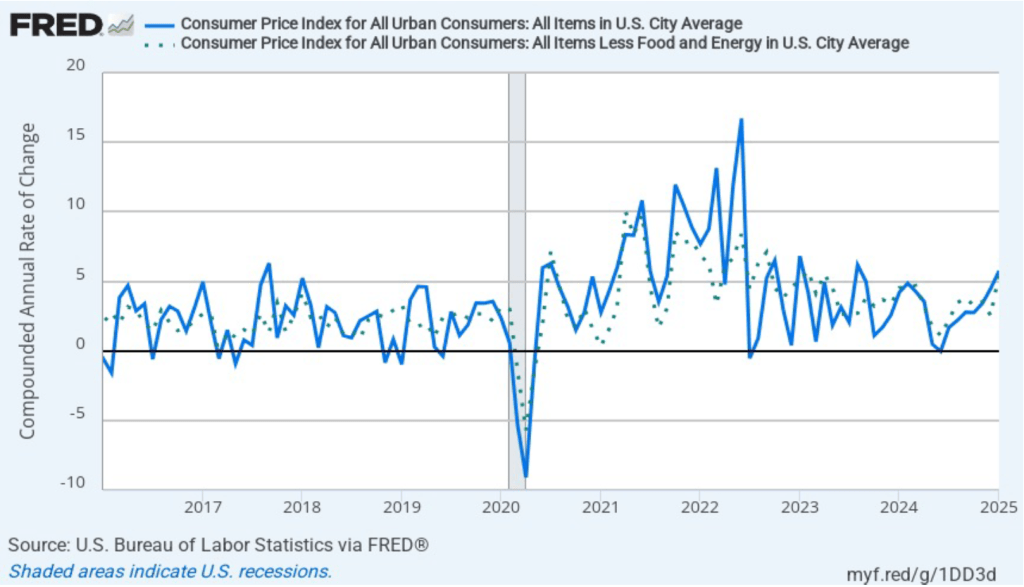
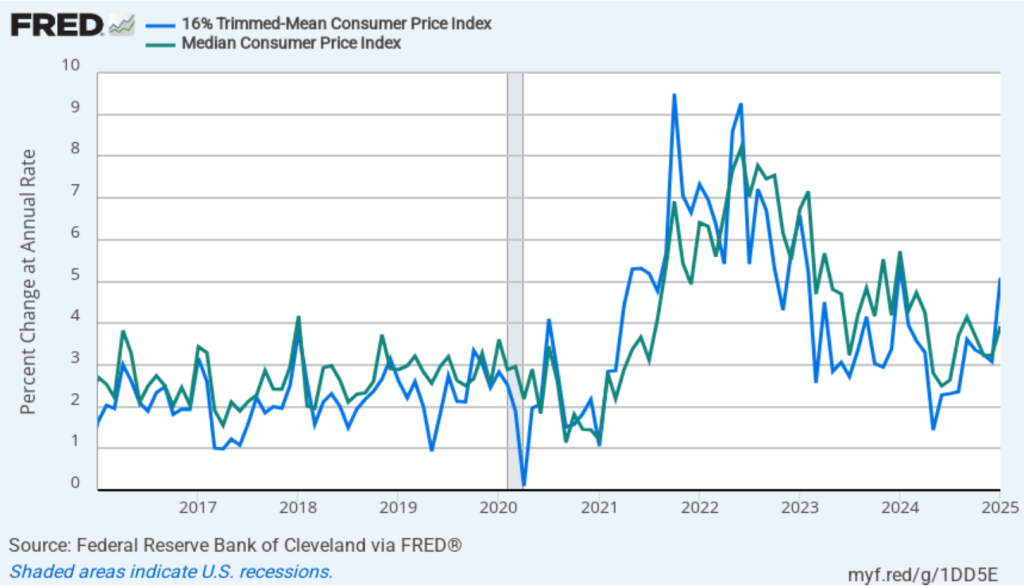
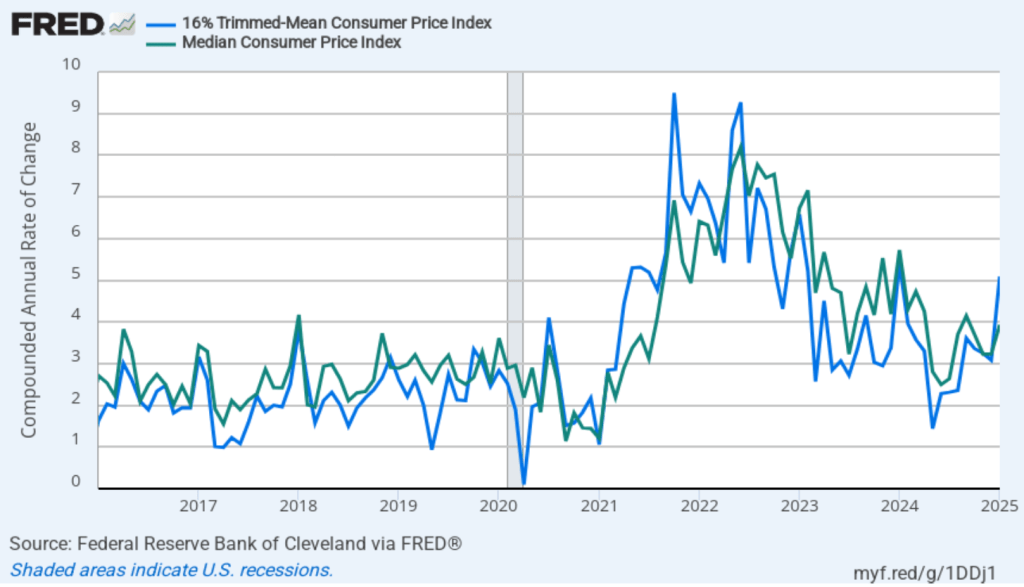
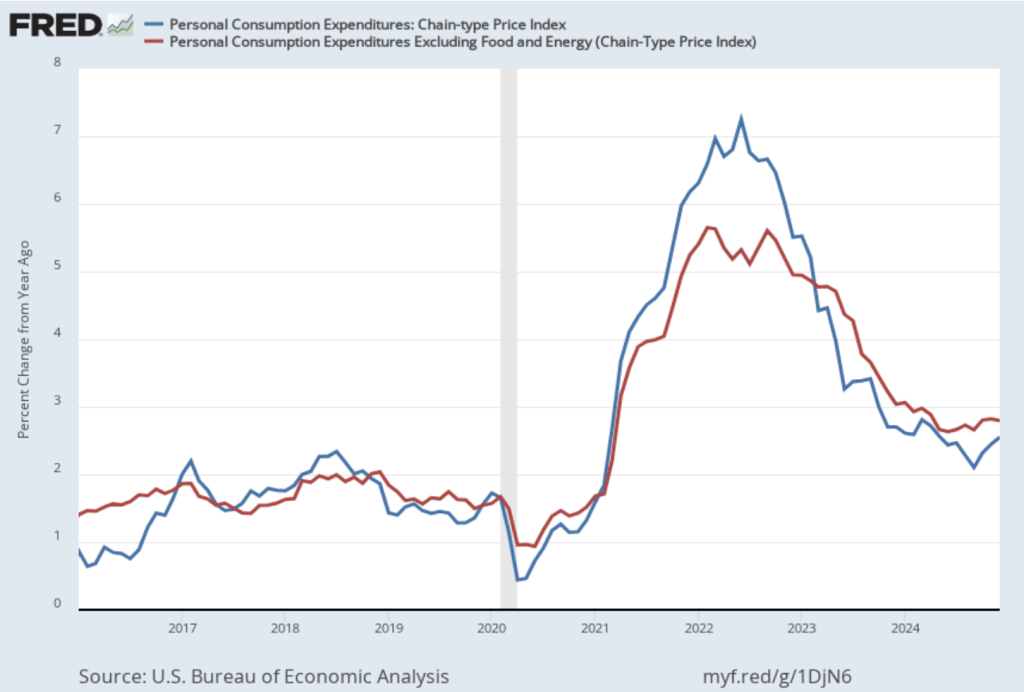
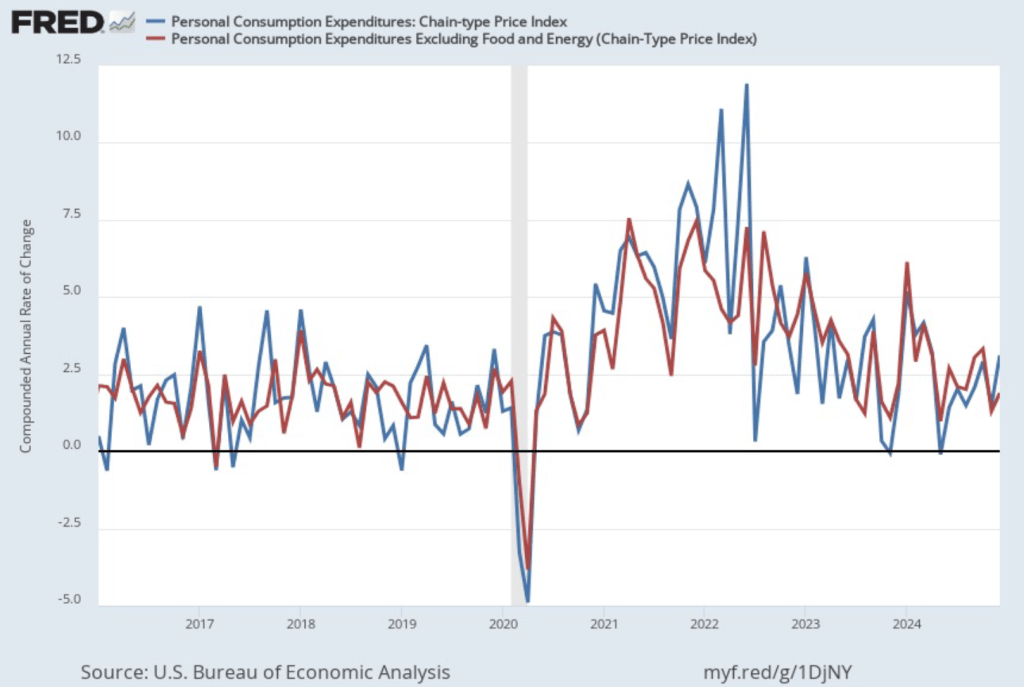
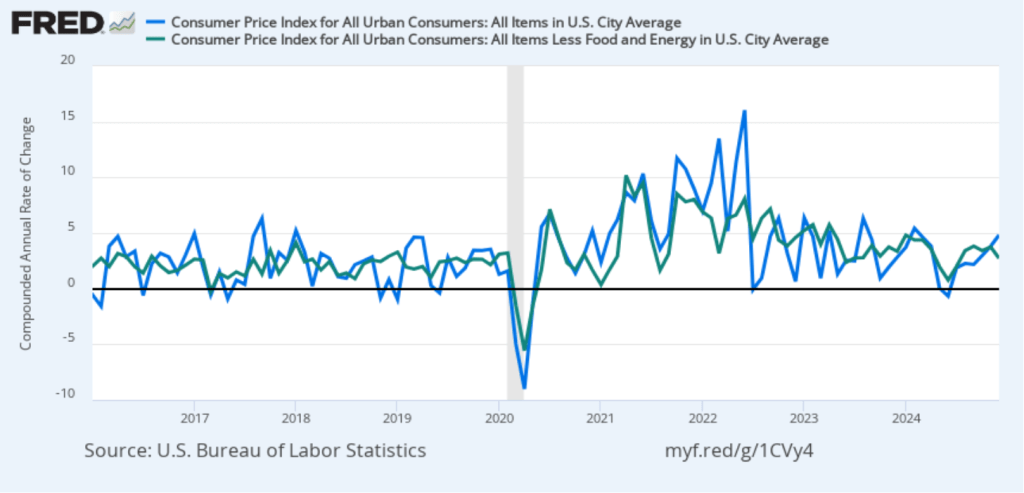
  2. Committee members now forecast that personal consumption expenditures (PCE) price inflation will be 2.7 percent at the end of 2025. In December, they had forecast that it would 2.5 percent. Similarly, their forecast of core PCE inflation increased from 2.5 percent to 2.8 percent. The committee does not expect that PCE inflation will decline to the Fed’s 2 percent annual target until 2027.
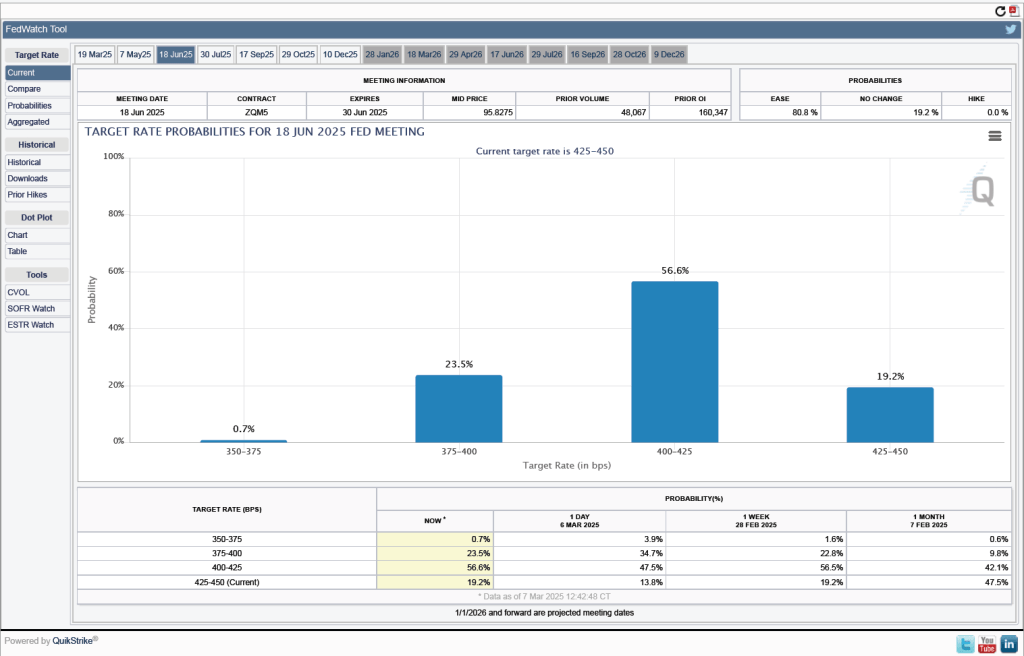
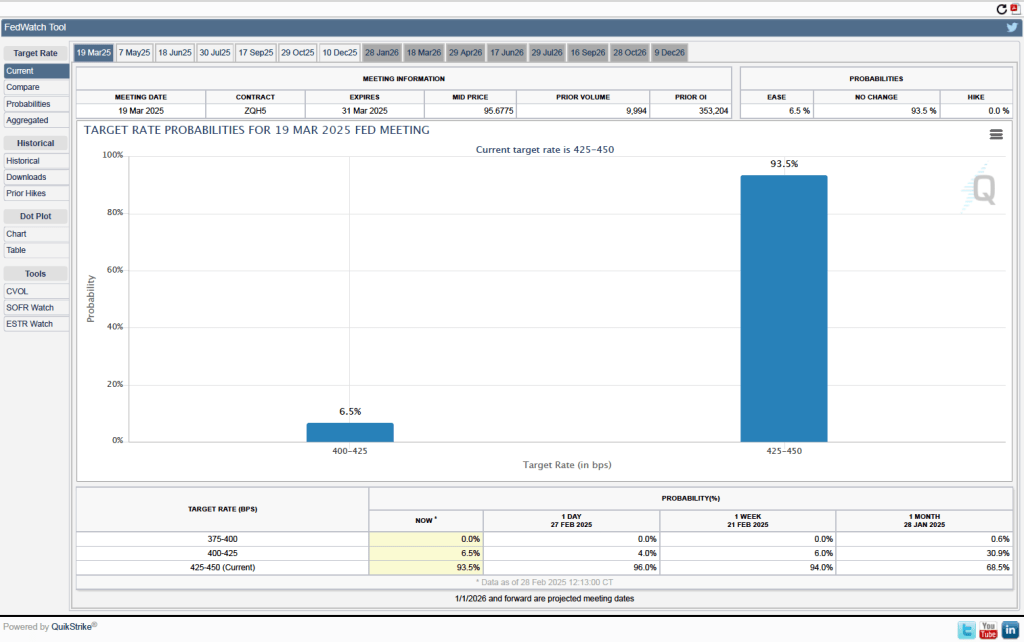
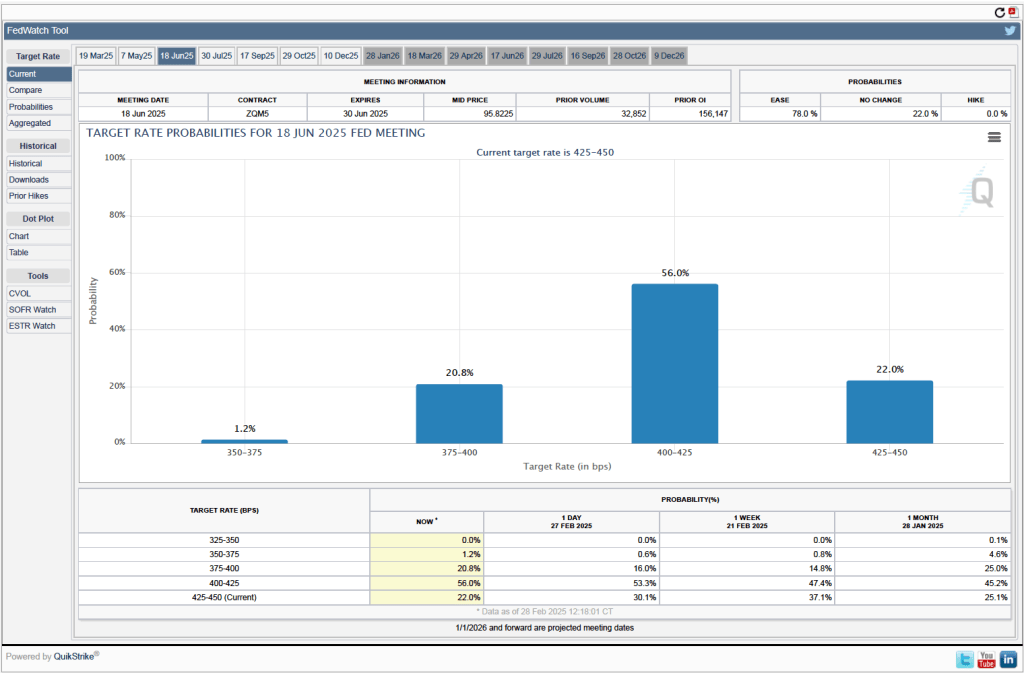
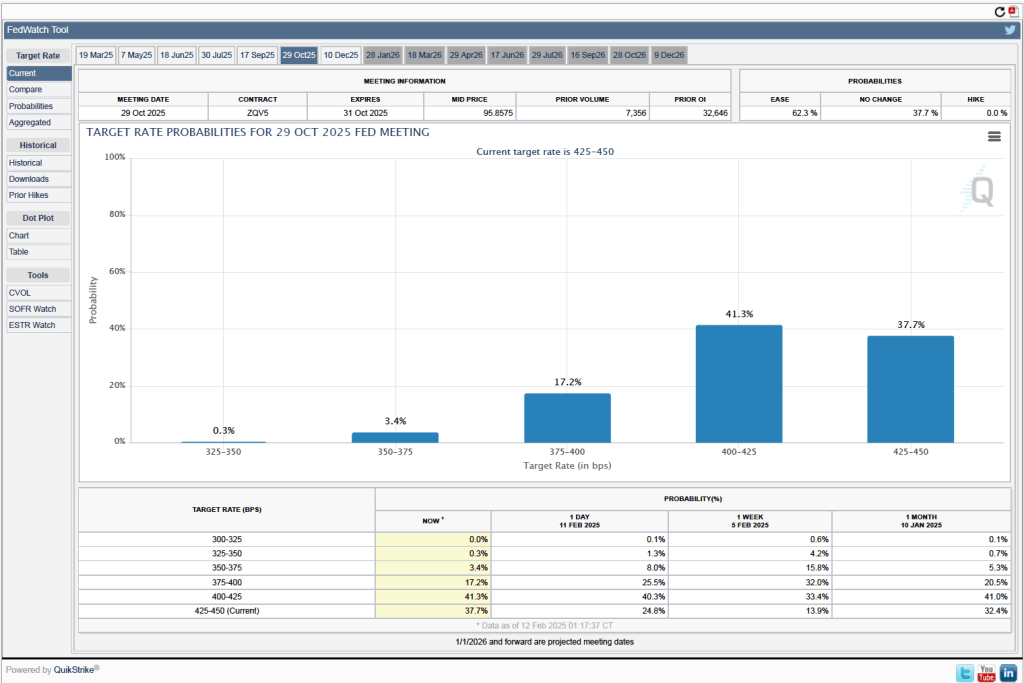
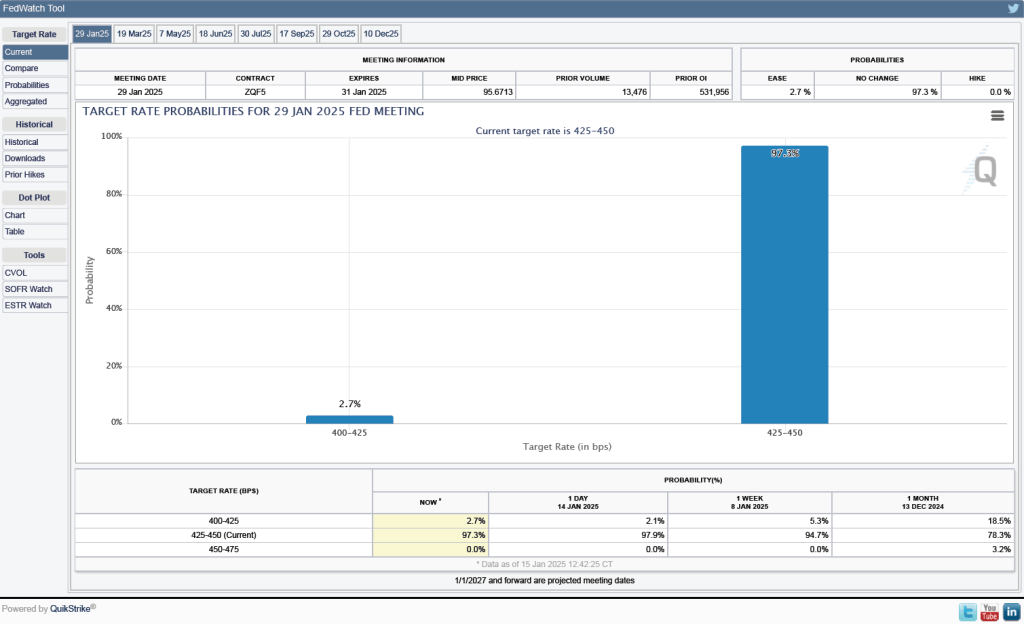
  3. The committee’s forecast of the federal funds rate at the end of 2025 was unchanged at 3.9 percent. The federal funds rate today is 4.33 percent, which indicates that committee members expect to make two 0.25 percentage point (25 basis points) cuts in their target for the federal funds rate this year. Investors are similarly forecasting two 25 basis point cuts.

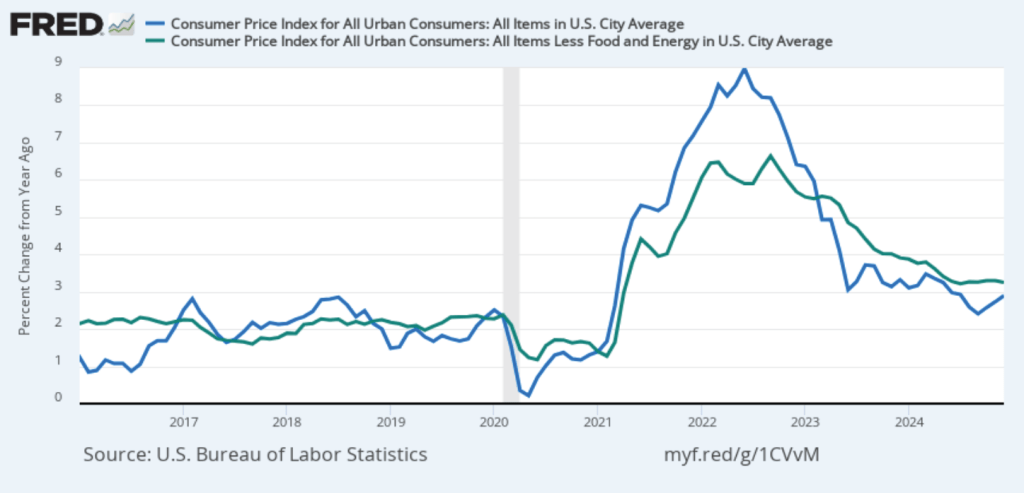
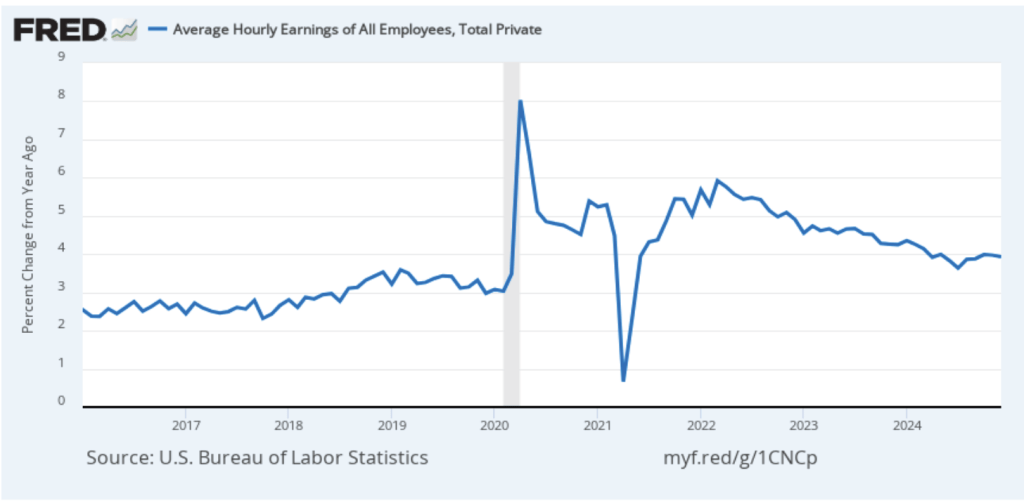
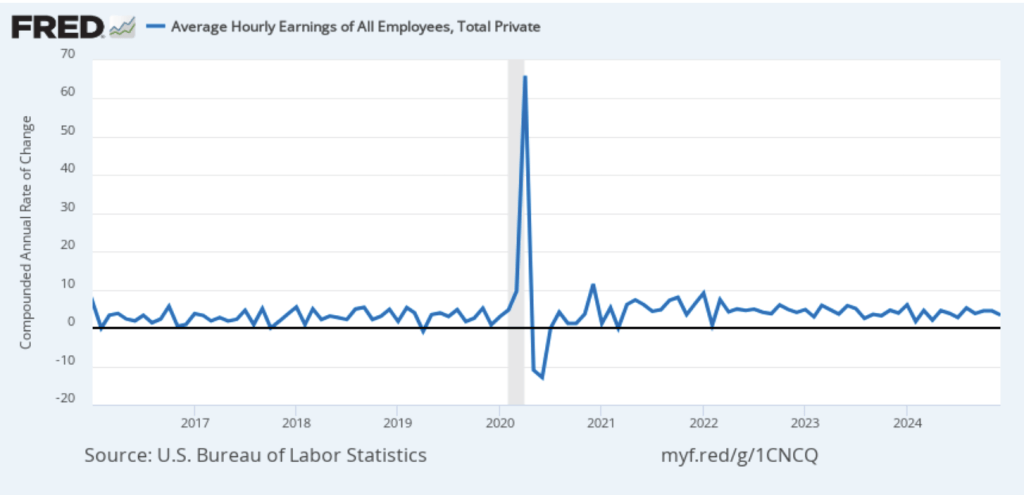
During his press conference, Powell indicated that a significant part of the increase in goods inflation during the first two months of the year was likely due to tariffs, although the Fed’s staff was unable to make a precise estimate of how much. Economists generally believe that tariffs cause one-time increases in the price level, rather than persistent inflation. Powell was asked during the press conference whether the FOMC was likely to “look through”—that is, not respond—to the tariffs. Powell replied that it was too early to make that decision, but that: “If there’s an inflation that’s going to go away on its own, it’s not the correct response to tighten policy.”

Powell noted that although surveys show that businesses and consumers expect an increase in inflation, over the long run, expectations are that the inflation rate will return to the Fed’s 2 percent annual target. In that sense, Powell said that expectations of inflation remain “well anchored.”

Barring a sharp slowdown in the growth of real GDP, a significant rise in the unemployment rate, or a significant rise in the inflation rate, the FOMC seems likely to leave its target for the federal funds rate unchanged over the next few months.

CPI Inflation Is Lower than Expected, but Still above Target

Photo courtesy of Lena Buonanno.

Today (March 12), the Bureau of Labor Statistics (BLS) released its monthly report on the consumer price index (CPI). The following figure compares headline inflation (the blue line) and core inflation (the green line).

  • The headline inflation rate, which is measured by the percentage change in the CPI from the same month in the previous year, was 2.8 percent in February—down from 3.0 percent in January. 
  • The core inflation rate, which excludes the prices of food and energy, was 3.1 percent in February—down from 3.3 percent in January. 

Both headline inflation and core inflation were slightly below what economists surveyed had expected.

In the following figure, we look at the 1-month inflation rate for headline and core inflation—that is the annual inflation rate calculated by compounding the current month’s rate over an entire year. Calculated as the 1-month inflation rate, headline inflation (the blue line) fell sharply from 5.7 percent in February to 2.6 percent in January. Core inflation (the green line) decreased from 5.5 percent in January to 2.8 percent in January.

Overall, considering 1-month and 12-month inflation together, the most favorable news is the sharp decline in both the headline and the core 1-month inflation rats. But inflation is still running ahead of the Fed’s 2 percent annual inflation target.

Of course, it’s important not to overinterpret the data from a single month. The figure shows that 1-month inflation is particularly volatile. Also note that the Fed uses the personal consumption expenditures (PCE) price index, rather than the CPI, to evaluate whether it is hitting its 2 percent annual inflation target.

There’s been considerable discussion in the media about continuing inflation in grocery prices. In the following figure the blue line shows inflation in the CPI category “food at home,” which is primarily grocery prices. Inflation in grocery prices was 1.8 percent in February and has been below 2 percent every month since November 2023. Although on average grocery price inflation has been low, there have been substantial increases in the prices of some food items. For instance, egg prices—shown by the green line—increased by 96.8 percent in February. But, as the figure shows, egg prices are usually quite volatile month-to-month, even when the country is not dealing with an epidemic of bird flu.

To better estimate the underlying trend in inflation, some economists look at median inflation and trimmed mean inflation.

  • Median inflation is calculated by economists at the Federal Reserve Bank of Cleveland and Ohio State University. If we listed the inflation rate in each individual good or service in the CPI, median inflation is the inflation rate of the good or service that is in the middle of the list—that is, the inflation rate in the price of the good or service that has an equal number of higher and lower inflation rates. 
  • Trimmed-mean inflation drops the 8 percent of goods and services with the highest inflation rates and the 8 percent of goods and services with the lowest inflation rates. 

The following figure shows that 12-month trimmed-mean inflation (the blue line) was 3.1 percent in February, unchanged from January. Twelve-month median inflation (the green line) declined slightly from 3.6 percent in January to 3.5 percent in February.

The following figure shows 1-month trimmed-mean and median inflation. One-month trimmed-mean inflation fell from 5.1 percent in January to 3.3. percent in February. One-month median inflation from 3.9 percent in January to 3.5 percent in February. These data provide confirmation that (1) CPI inflation at this point is likely running higher than a rate that would be consistent with the Fed achieving its inflation target, and (2) inflation slowed somewhat from January to February.

What are the implications of this CPI report for the actions the FOMC may take at its next several meetings? The major stock market indexes rose sharply at the beginning of trading this morning, but then swung back and forth between losses and gains. Inflation being lower than expected may have increased the probability that the FOMC will cut its target for the federal funds rate sooner rather than later. Lower inflation and lower interest rates would be good news for stock prices. But investors still appear to be worried about the extent to which a trade war might both slow economic growth and increase the price level.

Investors who buy and sell federal funds futures contracts still do not expect that the FOMC will cut its target for the federal funds rate at its next two meetings. (We discuss the futures market for federal funds in this blog post.) Today, investors assigned only a 1 percent probability that the Fed’s policymaking Federal Open Market Committee (FOMC) will cut its target from the current 4.25 percent to 4.50 percent range at its meeting next week. Investors assigned a probability of 33.3 percent that the FOMC would cut its target after its meeting on May 6–7. Investors today assigned a probability of 78.6 percent that the committee will cut its target after its meeting on June 17–18. That probability has fallen slightly over the past week.

At his press conference after next Wednesday’s FOMC meeting, Fed Chair Jerome Powell will give his thoughts on the current economic situation.

Strong Jobs Report with No Sign of Recession

Image generated by GTP-4o

In a post earlier this week, we noted that according to the usually reliable GDPNow forecast from the Federal Reserve Bank of Atlanta, real GDP in the first quarter will decline by 2.8 percent. (The forecast was updated yesterday on the basis of additional data releases to a slightly less pessimistic –2.4 percent decline.) This morning (March 7), the Bureau of Labor Statistics (BLS) released its “Employment Situation” report (often called the “jobs report”) for February. The data in the report show no sign that the U.S. economy is in a recession. We should add the caveat, however, that at the beginning of a recession the data in the jobs report can be subject to large revisions.

The jobs report has two estimates of the change in employment during the month: one estimate from the establishment survey, often referred to as the payroll survey, and one from the household survey. As we discuss in Macroeconomics, Chapter 9, Section 9.1 (Economics, Chapter 19, Section 19.1), many economists and Federal Reserve policymakers believe that employment data from the establishment survey provide a more accurate indicator of the state of the labor market than do either the employment data or the unemployment data from the household survey. (The groups included in the employment estimates from the two surveys are somewhat different, as we discuss in this post.)

According to the establishment survey, there was a net increase of 151,000 jobs during February. This increase was below the increase of 160,000 that economists had forecast. The previously reported increase for December was revised upward, while the previously reported increase for January was revised downward. The net change in jobs, taking the revisions for those two months together, was 2,000 lower than originally estimated. (The BLS notes that: “Monthly revisions result from additional reports received from businesses and government agencies since the last published estimates and from the recalculation of seasonal factors.”) The following figure from the jobs report shows the net change in payroll employment for each month in the last two years.

The unemployment rate rose slightly to 4.1 percent in February from 4.0 percent in January. As the following figure shows, the unemployment rate has been remarkably stable in recent months, staying between 4.0 percent and 4.2 percent in each month since May 2024. Last December, the members of the Federal Open Market Committee (FOMC) forecast that the unemployment rate for 2025 would average 4.3 percent.

As the following figure shows, the net change in jobs from the household survey moves much more erratically than does the net change in jobs from the establishment survey. The net change in jobs as measured by the household survey for February showed a sharp decrease of 588,000 jobs following a very large increase of 2,234,000 jobs in January. In any particular month, the story told by the two surveys can be inconsistent with employment increasing in one survey while falling in the other. The difference was particularly dramatic this month. (In this blog post, we discuss the differences between the employment estimates in the two surveys.)

Another concerning sign in the household survey is the fall in the employment-population ratio for prime age workers—those aged 25 to 54. The ratio declined from 80.7 percent in January to 80.5 percent in February. Although the employment-population is still high relative to the average level since 2001, it’s now well below the high of 80.9 percent in mid-2024. Continuing declines in this ratio would indicate a significant softening in the labor market.

It’s unclear how many federal workers have been laid off since the Trump Administration took office. The household survey shows a decline in total federal government employment of 10,000 in February. The household survey was conducted in the week that included February 12, so, it’s possible that next month’s jobs report may find a more significant decline.

The establishment survey also includes data on average hourly earnings (AHE). As we noted in this post, many economists and policymakers believe the employment cost index (ECI) is a better measure of wage pressures in the economy than is the AHE. The AHE does have the important advantage of being available monthly, whereas the ECI is only available quarterly. The following figure shows the percentage change in the AHE from the same month in the previous year. The AHE increased 4.0 percent in February, up slightly from 3.9 percent in January.

The following figure shows wage inflation calculated by compounding the current month’s rate over an entire year. (The figure above shows what is sometimes called 12-month wage inflation, whereas this figure shows 1-month wage inflation.) One-month wage inflation is much more volatile than 12-month wage inflation—note the very large swings in 1-month wage inflation in April and May 2020 during the business closures caused by the Covid pandemic. The February 1-month rate of wage inflation was 3.4 percent, a decline from the surprisingly high 5.2 percent rate in December. Whether measured as a 12-month increase or as a 1-month increase, AHE is still increasing somewhat more rapidly than is consistent with the Fed achieving its 2 percent target rate of price inflation.

Today’s jobs report leaves the situation facing the Federal Reserve’s policy-making Federal Open Market Committee (FOMC) largely unchanged. There are some indications that the economy may be weakening, as shown by some of the data in the jobs report and by some of the data incorporated by the Atlanta Fed in its pessimistic nowcast of first quarter real GDP. But the Fed hasn’t yet brought inflation down to its 2 percent annual target. In addition, it’s unclear how the Trump Administration’s policies—particularly with respect to tariff increases—might affect the economy. Speaking today at an event at the University of Chicago, Fed Chair Jerome Powell observed the following:

“Looking ahead, the new Administration is in the process of implementing significant policy changes in four distinct areas: trade, immigration, fiscal policy, and regulation. It is the net effect of these policy changes that will matter for the economy and for the path of monetary policy. While there have been recent developments in some of these areas, especially trade policy, uncertainty around the changes and their likely effects remains high. As we parse the incoming information, we are focused on separating the signal from the noise as the outlook evolves. We do not need to be in a hurry, and are well positioned to wait for greater clarity.”

The likeliest outcome is that the FOMC will keep its target for the federal funds rate unchanged, perhaps for several meetings, unless additional data are released that clearly show the economy to be weakening.

One indication of expectations of future cuts in the target for the federal funds rate comes from investors who buy and sell federal funds futures contracts. (We discuss the futures market for federal funds in this blog post.) The data from the futures market indicates that investors don’t expect that the FOMC will cut its target for the federal funds rate at either its March 18–19 or May 6–7 meetings. As shown in the following figure, only at the FOMC’s June 17–18 meeting do investors assign a greater than 50 percent probability to the committee cutting its target. As of this afternoon, investors assign a probability of only 19.2 percent to the FOMC keeping its target unchanged at 4.25 percent to 4.50 percent at that meeting. They assign a probability of 80.8 percent to the committee cutting its target rate by at least 0.25 percentage point (25 basis points) at that meeting.

As Expected, PCE Inflation Slows but Remains above Fed’s Target

Image generated by GTP-4o of people shopping.

Today (February 28), the BEA released monthly data on the personal consumption expenditures (PCE) price index as part of its “Personal Income and Outlays” report.  The Fed relies on annual changes in the PCE price index to evaluate whether it’s meeting its 2 percent annual inflation target.  The following figure shows PCE inflation (blue line) and core PCE inflation (green line)—which excludes energy and food prices—for the period since January 2016 with inflation measured as the percentage change in the PCE from the same month in the previous year. Measured this way, in January PCE inflation was 2.5 percent, down slightly from 2.6 in December. Core PCE inflation in January was 2.6 percent, down from 2.9 percent in December.  Headline and core PCE inflation were both consistent with the forecasts of economists.

The following figure shows PCE inflation and core PCE inflation calculated by compounding the current month’s rate over an entire year. (The figure above shows what is sometimes called 12-month inflation, while this figure shows 1-month inflation.) Measured this way, PCE inflation rose in January to 4.0 percent from 3.6 percent in December. Core PCE inflation rose in January to 3.5 percent from to 2.5 percent in December. So, both 1-month core PCE inflation estimates are running well above the Fed’s 2 percent target. But the usual caution applies that 1-month inflation figures are volatile (as can be seen in the figure), so we shouldn’t attempt to draw wider conclusions from one month’s data.

In recent months, Fed Chair Jerome Powell has noted that inflation in non-market services has been high. Non-market services are services whose prices the BEA imputes rather than measures directly. For instance, the BEA assumes that prices of financial services—such as brokerage fees—vary with the prices of financial assets. So that if stock prices rise, the prices of financial services included in the PCE price index also rise. Powell has argued that these imputed prices “don’t really tell us much about … tightness in the economy. They don’t really reflect that.” The following figure shows 12-month headline inflation (the blue line) and 12-month core inflation (the green line) for market-based PCE. (The BEA explains the market-based PCE measure here.)

Headline market-based PCE inflation was 2.2 percent in January, and core market-based PCE inflation was 2.3 percent. So, both market-based measures show less inflation in January than do the total measures. In the following figure, we look at 1-month inflation using these measures. Again, inflation is running somewhat lower when using these market-based measures of inflation. Note, though, that all four market-based measures are running above the Fed’s 2 percent target.

In summary, today’s data don’t change the general picture with respect to inflation: While inflation has substantially declined from its high in mid-2022, it still is running above the Fed’s target of 2 percent. As a result, it’s likely that the Fed’s policymaking Federal Open Market Committee (FOMC) will leave its target for the federal funds rate unchanged at its next meeting on March 18–19.

Investors who buy and sell federal funds futures contracts expect that the FOMC will leave its federal funds rate target unchanged at its next meeting. (We discuss the futures market for federal funds in this blog post.) As the following figure shows, investors assign a probability of 93.5 percent to the FOMC leaving its target for the federal funds rate unchanged at the current range of 4.25 percent to 4.50. Investors assign a probability of only 6.5 percent to the FOMC cutting its target by 0.25 percentage point (25 basis points).

As shown the following figure shows, investors assign a probability of greater than 50 percent that the FOMC will cut its target range by at least 25 basis points at its meeting nearly four months from now on June 17–18. Investors may be concerned that the economy is showing some signs of weakening. Today’s BEA report indicates that real personal consumption expenditures declined at a very high 5.5 percent compound annual rate in January. (Although measured as the 12-month change, real consumption spending increased by 3.o percent in January.)

We’ll have a better understanding of the FOMC’s evaluation of recent macroeconomic data after Chair Powell’s news conference following the March 18–19 meeting.

CPI Inflation in January Is Higher than Expected

Image generated by GTP-4o illustrating inflation

On February 12, the Bureau of Labor Statistics (BLS) released its monthly report on the consumer price index (CPI). The following figure compares headline inflation (the blue line) and core inflation (the dotted green line).

  • The headline inflation rate, which is measured by the percentage change in the CPI from the same month in the previous month, was 3.0 percent in January—up from 2.9 percent in December. 
  • The core inflation rate, which excludes the prices of food and energy, was 3.3 percent in January—up from 3.2 percent in December. 

Headline inflation and core inflation were both above what economists surveyed had expected.

In the following figure, we look at the 1-month inflation rate for headline and core inflation—that is the annual inflation rate calculated by compounding the current month’s rate over an entire year. Calculated as the 1-month inflation rate, headline inflation (the blue line) jumped from 4.5 percent in December to 5.7 percent in January—following a large jump in inflation from November to December. Core inflation (the dotted green line) more than doubled from 2.5 percent in December to 5.5 percent in January.

Overall, considering 1-month and 12-month inflation together, today’s data are concerning. One-month headline inflation is the highest it’s been since August 2023. One-month core inflation is the highest it’s been since April 2023. This month’s CPI report reinforces the conclusion from other recent inflation reports that progress on lowering inflation appears to have stalled. So, the probability of a “no landing” outcome, with inflation remaining above the Fed’s target for an indefinite period, seems to have increased. 

Of course, it’s important not to overinterpret the data from a single month. The figure shows that 1-month inflation is particularly volatile. Also note that the Fed uses the personal consumption expenditures (PCE) price index, rather than the CPI, to evaluate whether it is hitting its 2 percent annual inflation target.

As we’ve discussed in previous blog posts, Federal Reserve Chair Jerome Powell and his colleagues on the Fed’s policymaking Federal Open Market Committee (FOMC) have been closely following inflation in the price of shelter. The price of “shelter” in the CPI, as explained here, includes both rent paid for an apartment or a house and “owners’ equivalent rent of residences (OER),” which is an estimate of what a house (or apartment) would rent for if the owner were renting it out. OER is included in the CPI to account for the value of the services an owner receives from living in an apartment or house.

As the following figure shows, inflation in the price of shelter has been a significant contributor to headline inflation. The blue line shows 12-month inflation in shelter, and the green line shows 1-month inflation in shelter. Twelve-month inflation in shelter has been declining since the spring of 2023, but in January it was still relatively high at 4.4 percent. One-month inflation in shelter—which is much more volatile than 12-month inflation in shelter—rose sharply from 3.3 percent in December to 4.6 percent in January. Clearly a worrying sign given that many economists were expecting that shelter inflation would continue to slow.

To better estimate of the underlying trend in inflation, some economists look at median inflation and trimmed mean inflation.

  • Median inflation is calculated by economists at the Federal Reserve Bank of Cleveland and at Ohio State University. If we listed the inflation rate in each individual good or service in the CPI, median inflation is the inflation rate of the good or service that is in the middle of the list—that is, the inflation rate in the price of the good or service that has an equal number of higher and lower inflation rates. 
  • Trimmed-mean inflation drops the 8 percent of goods and services with the highest inflation rates and the 8 percent of goods and services with the lowest inflation rates. 

The following figure shows that 12-month trimmed-mean inflation (the blue line) jumped from 3.1 percent in December to 5.2 percent in January. Median inflation (the green line), which had been stable over the past five months, increased from 3.2 percent in December to 3.9 percent in January.

The following figure shows 1-month median and trimmed-mean inflation. One-month trimmed-mean inflation jumped from 3.1 percent in December to 5.1 percent in January. One-month median inflation rose from 3.2 percent in December to 3.9 percent in January. These data provide confirmation that (1) CPI inflation at this point is running higher than a rate that would be consistent with the Fed achieving its inflation target, and (2) that progress toward the target has slowed.

Looking at the futures market for federal funds, investors who buy and sell federal funds futures contracts are not expecting that the Fed’s policymaking Federal Open Market Committee (FOMC) will cut its target for the federal funds until this fall. (We discuss the futures market for federal funds in this blog post.) Investors assign a higher probability to the FOMC leaving its target range for the federal funds rate unchanged at 4.25 percent to 4.50 percent at its January, March, June, July, and September meetings. It’s not until the FOMC’s meeting on October 28-29 that, as shown below, investors assign a higher probability to a rate cut than to the committee leaving the rate unchanged.

New Data on Inflation and Wage Growth Indicate that Inflation Is Still Running above Target

Photo courtesy of Lena Buonanno

Today (January 31), the BEA released monthly data on the PCE as part of its Personal Income and Outlays report.  In addition, the Bureau of Labor Statistics (BLS) released quarterly data on the Employment Cost Index (ECI).

The Fed relies on annual changes in the PCE price index to evaluate whether it’s meeting its 2 percent annual inflation target.  The following figure shows PCE inflation (blue line) and core PCE inflation (red line)—which excludes energy and food prices—for the period since January 2016 with inflation measured as the percentage change in the PCE from the same month in the previous year. Measured this way, in December PCE inflation (the blue line) was 2.8 percent, unchanged from November. Core PCE inflation (the red line) in December was also 2.8 percent, unchanged from November. 

The following figure shows PCE inflation and core PCE inflation calculated by compounding the current month’s rate over an entire year. (The figure above shows what is sometimes called 12-month inflation, while this figure shows 1-month inflation.) Measured this way, PCE inflation rose in December to 3.1 percent from 1.5 percent in November. Core PCE inflation rose in December to 1.9 percent from to 1.3 percent in November.  Core inflation is generally a better measure of the underlying trend in inflation. So, 1-month core PCE inflation running below the Fed’s 2 percent target is an encouraging sign. But the usual caution applies that 1-month inflation figures are volatile (as can be seen in the figure), so data from one month shouldn’t be overly relied on.

Turning to wages, as we’ve noted in earlier posts, the Fed’s policymaking Federal Open Market Committee (FOMC) prefers the employment cost index (ECI) to average hourly earnings (AHE) as a measure of the increase in labor costs.

The AHE is calculated by adding all of the wages and salaries workers are paid—including overtime and bonus pay—and dividing by the total number of hours worked. As a measure of how wages are increasing or decreasing during a particular period, AHE can suffer from composition effects because AHE data aren’t adjusted for changes in the mix of occupations workers are employed in. For example, during a period in which there is a decline in the number of people working in occupations with higher-than-average wages, perhaps because of a downturn in some technology industries, AHE may show wages falling even though the wages of workers who are still employed have risen. In contrast, the ECI holds constant the mix of occupations in which people are employed. The ECI does have this drawback: It is only available quarterly whereas the AHE is available monthly.

The data released this morning indicate that labor costs continue to increase at a rate that is higher than the rate that is likely needed for the Fed to hit its 2 percent price inflation target. The following figure shows the percentage change in the ECI from the same quarter in the previous year. The blue line shows only wages and salaries of private industry workers, while the red line shows total compensation, including non-wage benefits like employer contributions to health insurance, for all civilian workers. The two measures of wage inflation follow similar paths. The rate of increase in the wage and salary measure decreased slightly from 3.9 percent in the third quarter of 2024 to 3.8 percent in the fourth quarter. The movement in the rate of increase in compensation was very similar, also decreasing from 3.9 percent in the third quarter of 2024 to 3.8 percent in the fourth quarter.

If we look at the compound annual growth rate of the ECI—the annual rate of increase assuming that the rate of growth in the quarter continued for an entire year—we find that the rate of increase in wages and salaries increased from 3.1 percent in the third quarter of 2024 to 3.6 percent in the fourth quarter. Similarly, the rate of increase in compensation increased from 3.2 percent in the fourth quarter of 2024 to 3.6 percent in the fourth quarter. So, this measure indicates that there has been some increase in the rate of wage inflation in the fourth quarter, although, again, we have to use caution in interpreting data from only one quarter.

Taken together, the PCE and ECI data released today indicate that the Fed still has a way to go before bringing about a soft landing—returning inflation to its 2 percent target without pushing the economy into a recession. 

1/17/25 Podcast – Authors Glenn Hubbard & Tony O’Brien discuss the pros/cons of tariffs and the impact of AI on the economy.

Welcome to the first podcast for the Spring 2025 semester from the Hubbard/O’Brien Economics author team. Check back for Blog updates & future podcasts which will happen every few weeks throughout the semester.

Join authors Glenn Hubbard & Tony O’Brien as they offer thoughts on tariffs in advance of the beginning of the new administration. They discuss the positive and negative impacts of tariffs -and some of the intended consequences. They also look at the AI landscape and how its reshaping the US economy. Is AI responsible for recent increased productivity – or maybe just the impact of other factors. It should be looked at closely as AI becomes more ingrained in our economy.

https://on.soundcloud.com/8ePL8SkHeSZGwEbm8

Headline CPI Inflation Is Higher in December but Core Inflation Is Lower than Expected

Image generated by GTP-4o illustrating inflation

On January 15, the Bureau of Labor Statistics (BLS) released its monthly report  on the consumer price index (CPI). The following figure compares headline inflation (the blue line) and core inflation (the green line).

  • The headline inflation rate, which is measured by the percentage change in the CPI from the same month in the previous month, was 2.9 percent in December—up from 2.7 percent in November. 
  • The core inflation rate, which excludes the prices of food and energy, was 3.2 percent in December—down from 3.3 percent in November. 

Headline inflation was slightly above and core inflation was slightly below what economists surveyed had expected.

In the following figure, we look at the 1-month inflation rate for headline and core inflation—that is the annual inflation rate calculated by compounding the current month’s rate over an entire year. Calculated as the 1-month inflation rate, headline inflation (the blue line) jumped from 3.8 percent in November to 4.8 percent in December. Core inflation (the green line) decreased from 3.8 percent in November to 2.7 percent in December.

Overall, considering 1-month and 12-month inflation together, the most favorable news is the low value of the 1-month core inflation rate. The most concerning news is a sharp increase in 1-month headline inflation, which brought that measure to its highest reading since February 2024. On balance, this month’s CPI report doesn’t do much to challenge the conclusion of other recent inflation reports that progress on lowering inflation has slowed or, possibly, stalled. So, the probability of a “no landing” outcome, with inflation remaining above the Fed’s target for an indefinite period, seems to have at least slightly increased. 

Of course, it’s important not to overinterpret the data from a single month. The figure shows that 1-month inflation is particularly volatile. Also note that the Fed uses the personal consumption expenditures (PCE) price index, rather than the CPI, to evaluate whether it is hitting its 2 percent annual inflation target.

As we’ve discussed in previous blog posts, Federal Reserve Chair Jerome Powell and his colleagues on the Fed’s policymaking Federal Open Market Committee (FOMC) have been closely following inflation in the price of shelter. The price of “shelter” in the CPI, as explained here, includes both rent paid for an apartment or a house and “owners’ equivalent rent of residences (OER),” which is an estimate of what a house (or apartment) would rent for if the owner were renting it out. OER is included in the CPI to account for the value of the services an owner receives from living in an apartment or house.

As the following figure shows, inflation in the price of shelter has been a significant contributor to headline inflation. The blue line shows 12-month inflation in shelter, and the red line shows 1-month inflation in shelter. Twelve-month inflation in shelter has been declining since the spring of 2023, but in December it was still high at 4.6 percent. One-month inflation in shelter—which is much more volatile than 12-month inflation in shelter—fell from 4.1 percent in November to 3.1 percent in December.

To better estimate of the underlying trend in inflation, some economists look at median inflation and trimmed mean inflation.

  • Median inflation is calculated by economists at the Federal Reserve Bank of Cleveland and Ohio State University. If we listed the inflation rate in each individual good or service in the CPI, median inflation is the inflation rate of the good or service that is in the middle of the list—that is, the inflation rate in the price of the good or service that has an equal number of higher and lower inflation rates. 
  • Trimmed mean inflation drops the 8 percent of goods and services with the highest inflation rates and the 8 percent of goods and services with the lowest inflation rates. 

The following figure shows that 12-month median inflation (the red line) declined slightly from 3.9 percent in November to 3.8 percent in December. Twelve-month trimmed mean inflation (the blue line) was unchanged at 3.2 percent for the fifth month in a row.

The following figure shows 1-month median and trimmed mean inflation. One-month median inflation rose from 2.8 percent in November to 3.6 percent in December. One-month trimmed mean inflation fell slightly from 3.3 percent in November to 3.2 percent in December. These data provide confirmation that (1) CPI inflation at this point is likely running higher than a rate that would be consistent with the Fed achieving its inflation target, and (2) that progress toward the target has slowed.

What are the implications of this CPI report for the actions the FOMC may take at its next meeting on January 28-29? The stock market rendered a quick verdict, as the following figure from the Wall Street Journal shows. As soon as the market opened on Wednesday morning, all three of the most widely followed stock market indexes jumped—as indicated by the vertical segments in the figure. Investors seem to be focusing on core CPI inflation being lower than expected, which should increase the probability that the FOMC will cut its target for the federal funds rate at either its March or May meeting. Lower inflation and lower interest rates would be good news for stock prices.

Investors who buy and sell federal funds futures contracts still do not expect that the FOMC will cut its target for the federal funds rate at its next meeting, as indicated by the following figure. (We discuss the futures market for federal funds in this blog post.) Today, investors assign a probability of 93.7 percent to the FOMC leaving its target range for the federal funds rate unchanged at 4.25 percent to 4.50 percent at its January 28-29 meeting, and a probability of only 2.7 percent to the committee cutting its target range by 0.25 percentage point (25 basis points).

Unexpectedly Strong Jobs Report

Last September the Federal Reserve’s policymaking Federal Open Market Committee (FOMC) cut its target for the federal funds rate by 0.50 percentage point (50 basis points. Many economists and policymakers expected the FOMC to continue cutting its federal funds rate target at meetings through 2025. (We discussed the September target cut in this blog post.) The FOMC cut its target by 25 basis points at both its November and December 2024 meetings. But by the December meeting, it had become clear that the inflation rate was not falling as quickly to the Fed’s 2 percent target as the committee members had hoped. As FOMC’s staff economists put it, there had been “upward surprises” in inflation data. According to the minutes of the December meeting, several members of the committee believed that “upside risks to the inflation outlook had increased.” 

As a result, it seemed likely that the FOMC would leave its target for the federal funds rate unchanged at its next meeting on January 28-29. This conclusion was reinforced this morning (January 10) when the Bureau of Labor Statistics (BLS) released its “Employment Situation” report (often called the “jobs report”) for December.  The report indicates that the labor market is stronger than expected.

Economists who had been surveyed by the Wall Street Journal had forecast that payroll employment, as reported in the establishment survey, would increase by 155,000. The BLS reported that payroll employment in December had increased by 256,000, well above expectations. The unemployment rate—which is calculated from data in the household survey—was 4.1 percent, down slightly from 4.2 percent in November. The following figure, taken from the BLS report, shows the net changes in employment for each month during the past two years.

As the following figure shows, the net change in jobs from the household survey moves much more erratically than does the net change in jobs from the establishment survey. The net change in jobs as measured by the household survey for December also showed a strong increase of 478,000 jobs following a decline of 273,000 jobs in November. In any particular month, the story told by the two surveys can be inconsistent with employment increasing in one survey while falling in the other. But in December the two surveys were sending the same signal of rapid employment growth. (In this blog post, we discuss the differences between the employment estimates in the household survey and the employment estimates in the establishment survey.)

The employment-population ratio for prime age workers—those aged 25 to 54—also increased, as shown in the following figure, to 80.5 percent in December from 80.4 percent in November. Although the employment-population is below its recent high of 80.9 percent, it remains high relative to levels seen since 2001.

As the following figure shows, the unemployment rate, which is also reported in the household survey, decreased slightly to 4.1 percent in December from 4.2 percent in November. The unemployment rate has been remarkably stable over the past two years, varying only 0.2 percentage point above or below 4.0 percent.

The establishment survey also includes data on average hourly earnings (AHE). As we noted in this post, many economists and policymakers believe the employment cost index (ECI) is a better measure of wage pressures in the economy than is the AHE. The AHE does have the important advantage that it is available monthly, whereas the ECI is only available quarterly. The following figure shows the percentage change in the AHE from the same month in the previous year. The AHE increased 3.9 percent in December, down slightly from 4.0 percent in November.

The following figure shows wage inflation calculated by compounding the current month’s rate over an entire year. (The figure above shows what is sometimes called 12-month wage inflation, whereas this figure shows 1-month wage inflation.) One-month wage inflation is much more volatile than 12-month wage inflation—note the very large swings in 1-month wage inflation in April and May 2020 during the business closures caused by the Covid pandemic. The December 1-month rate of wage inflation was 3.4 percent, a decline from the 4.9 percent rate in November. Whether measured as a 12-month increase or as a 1-month increase, AHE is still increasing somewhat more rapidly than is consistent with the Fed achieving its 2 percent target rate of price inflation.

Given these data from the jobs report, it seems unlikely that the FOMC will reduce its target range for the federal funds rate at its next meeting. One indication of expectations of future rate cuts comes from investors who buy and sell federal funds futures contracts. (We discuss the futures market for federal funds in this blog post.) As shown in the following figure, today these investors assign a probability of 97.3 percent to the FOMC keeping its target range for the federal funds rate unchanged at the current range of 4.25 percent to 4.50 percent, at its next meeting. Investors assign a probability of only 2.7 percent of the committee cutting its target range by 25 basis points at that meeting.

As the following figure shows, investors also expect the FOMC to keep its target range unchanged at its meeting on March 18-19, although there is greater uncertainty. Investors assign:

  • A 74.0 percent probability that the FOMC keeps its target range for the federal funds rate unchanged
  • A 25.4 percent probability that the committee cuts its target range by 25 basis points
  • A 0.6 percent probability that the committee cuts its target range by 50 basis points

Yesterday at the Fed Something Happened That Was Unusual … or Was It?

Photo of Michael Barr from federalreserve.gov

President-elect Donald Trump has stated that he believes that presidents should have more say in monetary policy. There had been some speculation that once in office Trump would try to replace Federal Reserve Chair Jerome Powell, although Trump later indicated that he would not attempt to replace Powell until Powell’s term as chair ends in May 2026. Can the president remove the Fed Chair or another member of the Board of Governors? The relevant section of the Federal Reserve Act States that: “each member [of the Board of Governors] shall hold office for a term of fourteen years from the expiration of the term of his predecessor, unless sooner removed for cause by the President.”

“Removed for cause” has generally been interpreted by lawyers inside and outside of the Fed as not authorizing the president to remove a member of the Board of Governors because of a disagreement over monetary policy. The following flat statement appears on a page of the web site of the Federal Reserve Bank of St. Louis: “Federal Reserve officials cannot be fired simply because the president or a member of Congress disagrees with Federal Reserve decisions about interest rates.”

At his press conference following the November 7 meeting of the Federal Open Market Committee (FOMC), Powell was asked by a reporter: “do you believe the President has the power to fire or demote you, and has the Fed determined the legality of a President demoting at will any of the other Governors with leadership positions?” Powell replied: “Not permitted under the law.” Despite Powell’s definitive statement, because no president has attempted to remove a member of the Board of Governors, the federal courts have never been asked to decide what the “removed for cause” language in the Federal Reserve Act means.

The president is free to remove the members of most agencies of the federal government, so why shouldn’t he or she be able to remove the Fed Chair? When Congress passed the Federal Reserve Act in 1913, it intended the central bank to be able set policy independently of the president and Congress. The president and members of Congress may take a short-term view of policy, focusing on conditions at the time that they run for reelection. Expansionary monetary policies can temporarily boost employment and output in the short run, but cause inflation to increase in the long run.

As we discuss in Macroeconomics, Chapter 17, Section 17.4 (Economics, Chapter 27, Section 27.4), in a classic study, Alberto Alesina and Lawrence Summers compared the degree of central bank independence and the inflation rate for 16 high-income countries during the years from 1955 to 1988. As the following figure shows, countries with highly independent central banks, such as the United States, Switzerland, and Germany, had lower inflation rates than countries whose central banks had little independence, such as New Zealand, Italy, and Spain.

Yesterday, something unusual happened that might seem to undermine Fed independence. Michael Barr, a member of the Board of Governors and the Board’s Vice Chair for Supervision, said that on February 28 he will step down from his position as Vice Chair, but will remain on the Board. His term as Vice Chair was scheduled to end in July 2026. His term on the Board is scheduled to end in January 2032.

Barr has been an advocate for stricter regulation of banks, including higher capital requirements for large banks. These positions have come in for criticism from banks, from some policymakers, and from advisers to Trump. Barr stated that he was stepping down because: “The risk of a dispute over the position could be a distraction from our mission. In the current environment, I’ve determined that I would be more effective in serving the American people from my role as governor.” Trump will nominate someone to assume the position of vice chair, but because there are no openings on the Board of Governors he will have to choose from among the current members.

Does this episode indicate that Fed independence is eroding? Not necessarily because the Fed’s regulatory role is distinct from its monetary policy role. As financial journalist Neil Irwin points out, “top [Fed] bank supervision officials view their role as more explicitly carrying out the regulatory agenda of the president who appointed them—and that a new president is entitled, in reasonable time, to their own choices.” In the past, other members of the Board who have held positions similar to the one Barr holds have resigned following the election of a new president.

So, it’s unclear at this point whether Barr’s resignation as vice chair indicates that the incoming Trump Administration will be taking steps to influence the Fed’s monetary policy actions or how the Fed’s leadership will react if it does.