Photo courtesy of Lena Buonanno
This morning (February 7), the Bureau of Labor Statistics (BLS) released its “Employment Situation” report (often called the “jobs report”) for January. This report was particularly interesting because it includes data reflecting the annual benchmark revision to the establishment, or payroll, survey and the annual revision of the household survey data to match new population estimates from the Census Bureau.
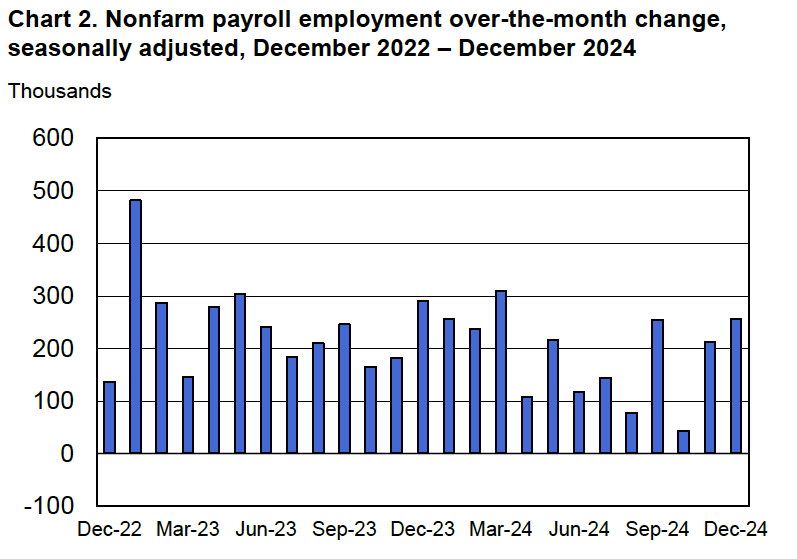
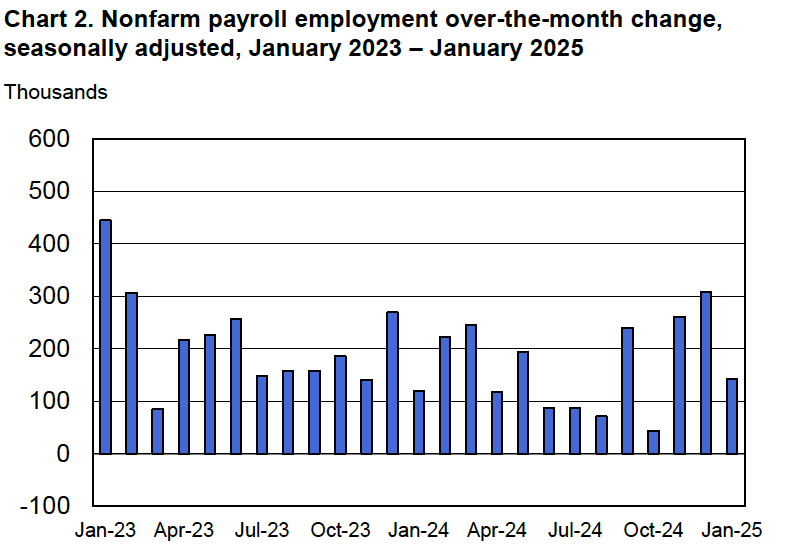
According to the establishment survey, there was a net increase of 143,000 jobs during January. This increase was below the increase of 169,000 to 175,000 that economists had forecast in surveys by the Wall Street Journal and bloomberg.com. The somewhat weak increase in jobs during January was offset by upward revisions to the initial estimates for November and December. The previously reported increases in employment for those months were revised upward by a total of 100,000 jobs. (The BLS notes that: “Monthly revisions result from additional reports received from businesses and government agencies since the last published estimates and from the recalculation of seasonal factors.”)
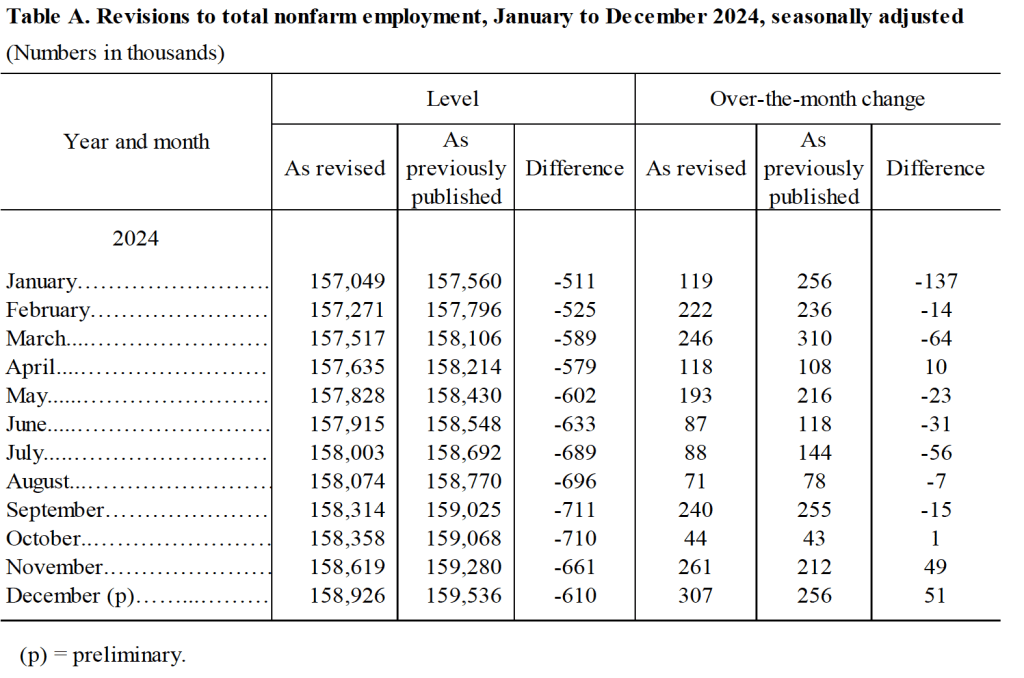
The BLS also announced the results of its annual revision of the payroll employment data benchmarked to March 2024. The revisions are mainly based on data from the Quarterly Census of Employment and Wages (QCEW). The data in payroll survey are derived from a sample of 300,000 establishments, whereas the QCEW is based on a much more comprehensive count of workers covered by state unemployment insurance programs. The revisions indicated that growth in payroll employment between March 2023 and March 2024 had been overstated by 598,000 jobs. Although large in absolute scale, the revisions equal only 0.4 percent of total employment. In addition, as we discussed in this blog post last August, initially the BLS had estimated that the overstatement in employment gains during this period was an even larger 818,000 jobs. (The BLS provides a comprehensive discuss of its revisions to the establishment employment data here.)
The following table shows the revised estimates for each month of 2024, based on the new benchmarking.
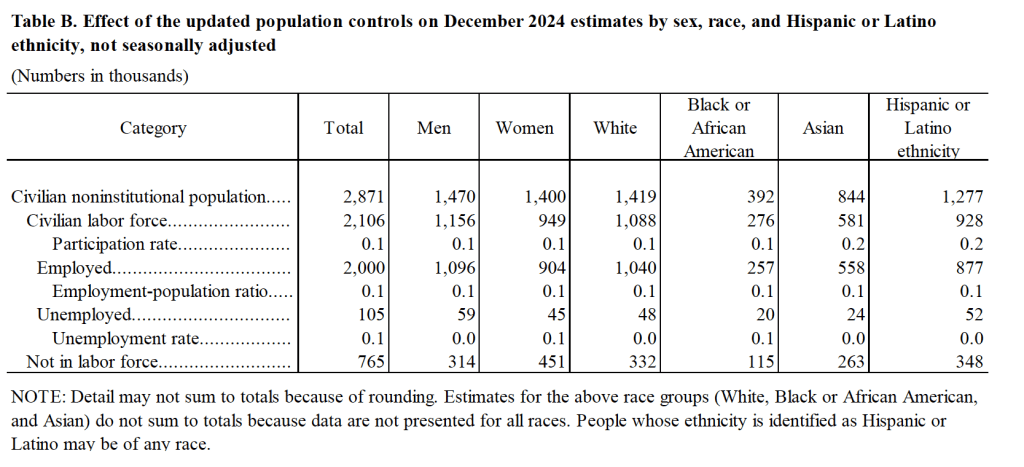
The BLS also revised the household survey data to reflect the latest population estimates from the census bureau. Unlike with the establishment data, the BLS doesn’t adjust the historical household data in light of the population benchmarking. However, the BLS did include two tables in this month’s jobs report illustrating the effect of the new population benchmark. The following table from the report shows the effect of the benchmarking on some labor market data for December 2024. The revision increases the estimate of the civilian noninstitutional population by nearly 3 million, most of which is attributable to an increase in the estimated immigrant population. The increase in the estimate of the number of employed workers was also large at 2 million. (The BLS provides a discussion of the effects of its population benchmarking here.)
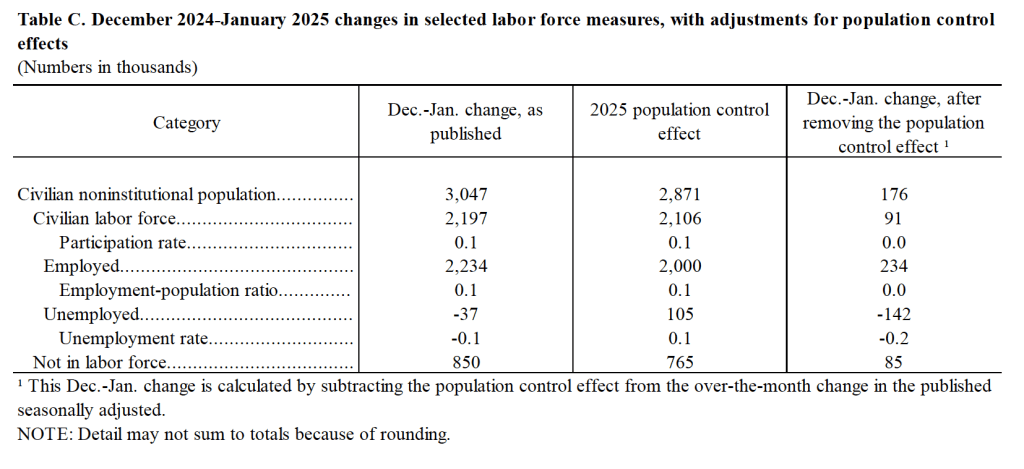
The following table shows how the population benchmarking affects changes in estimates of labor market variables between December 2024 and January 2025. The population benchmarking increases the net number of jobs created in January by 234,000 and reduces the increase in the number of persons unemployed by 142,000.
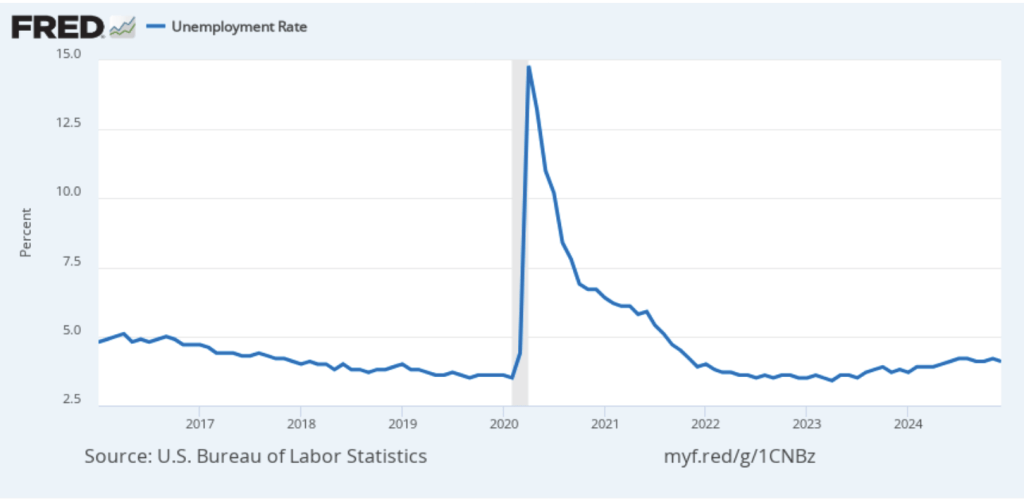
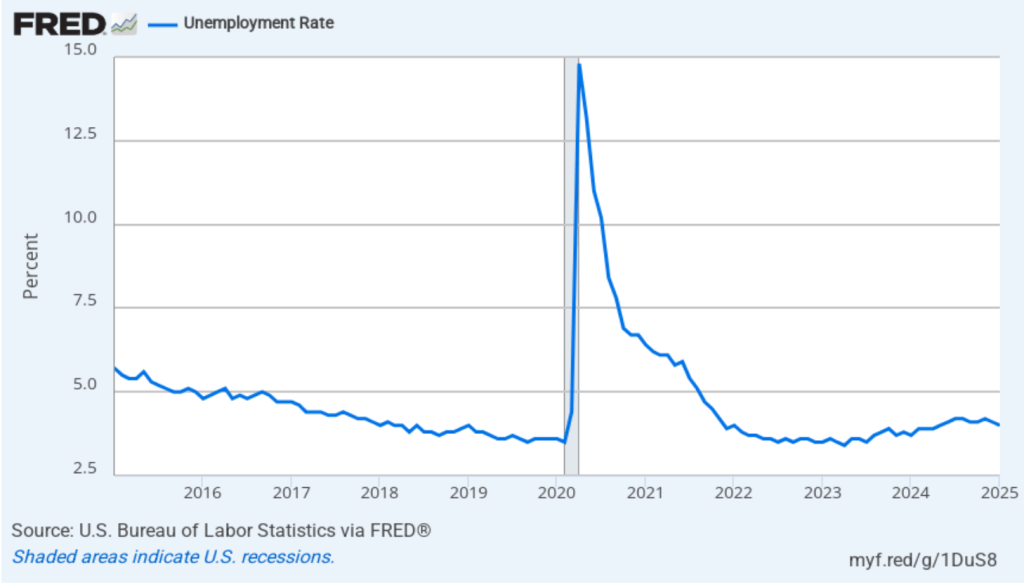
As the following figure shows, the unemployment rate, as reported in the household survey, decreased from 4.1 percent in December to 4.0 percent in January. The figure shows that the unemployment rate has fluctuated in a fairly narrow range over the past year.
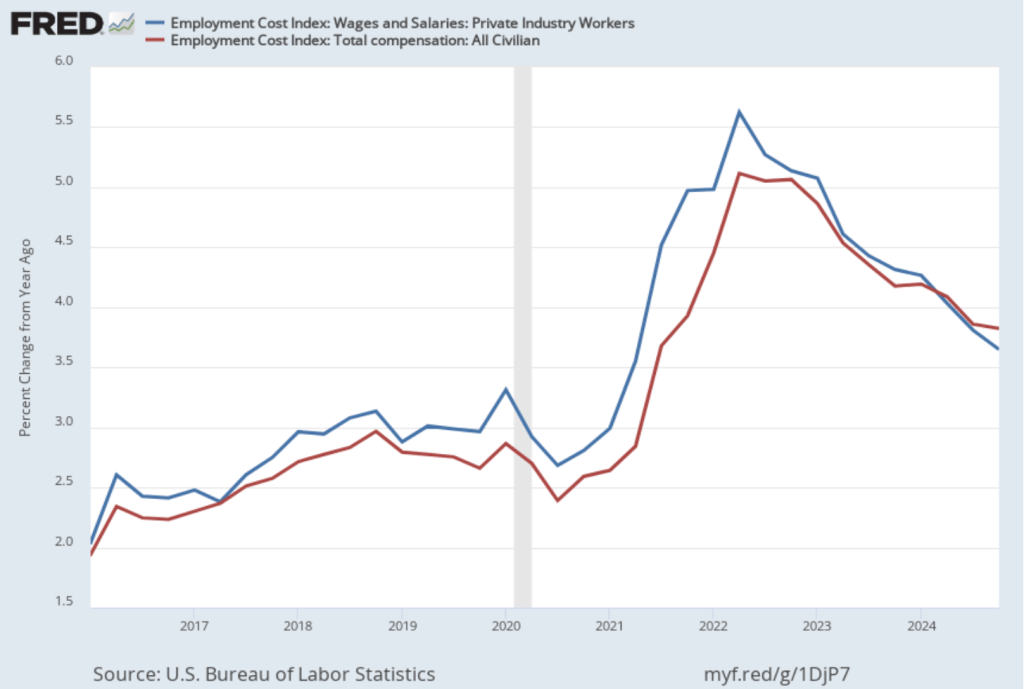
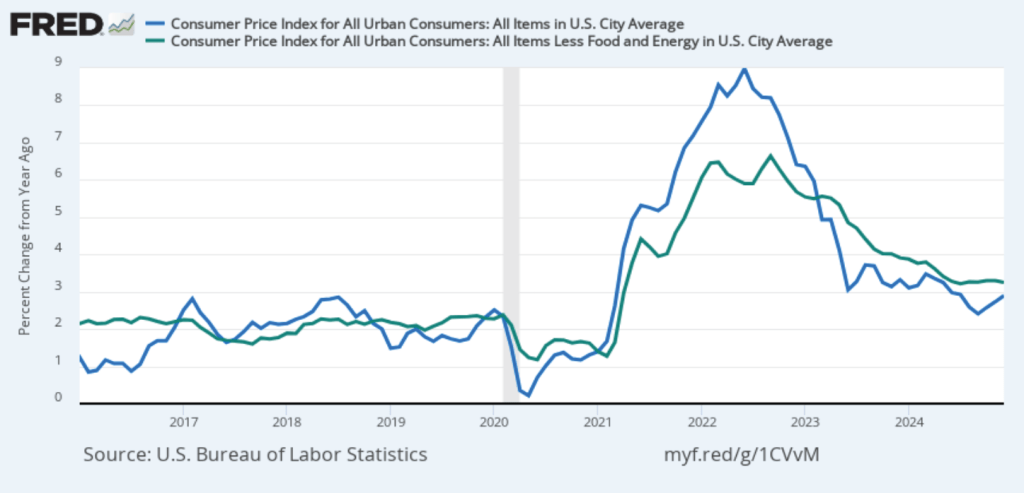
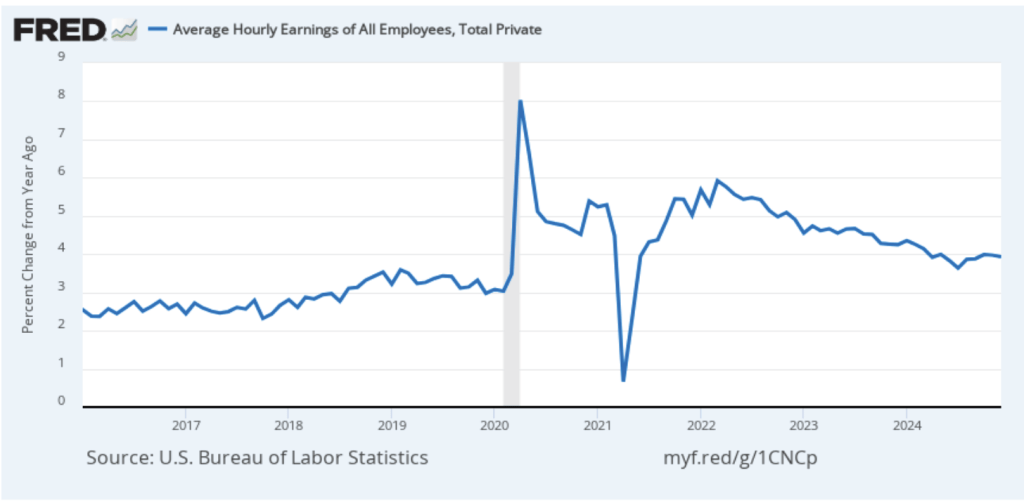
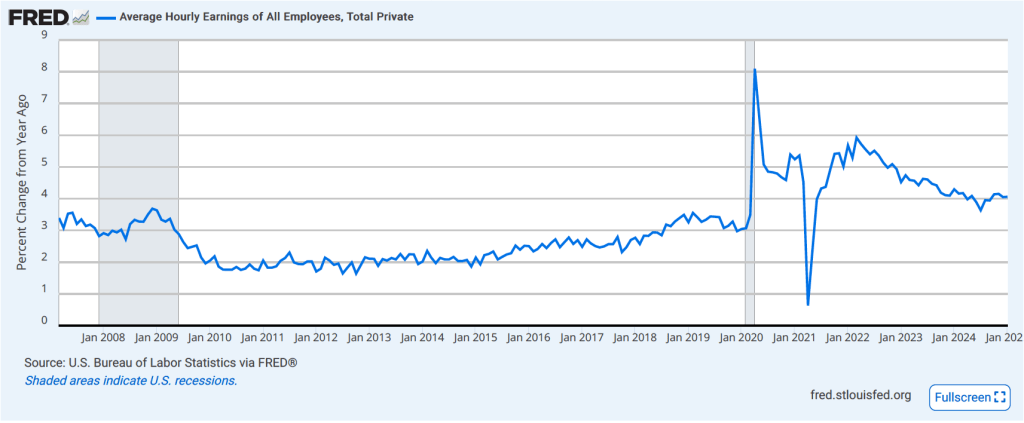
The establishment survey also includes data on average hourly earnings (AHE). As we’ve noted in previous posts, many economists and policymakers believe the employment cost index (ECI) is a better measure of wage pressures in the economy than is the AHE. The AHE does have the important advantage of being available monthly, whereas the ECI is only available quarterly. The following figure shows the percentage change in the AHE from the same month in the previous year. AHE increased 4.1 percent in January, which was unchanged from the December increase. By this measure, wage growth is still somewhat higher than is consistent with annual price inflation running at the Fed’s target of 2 percent.
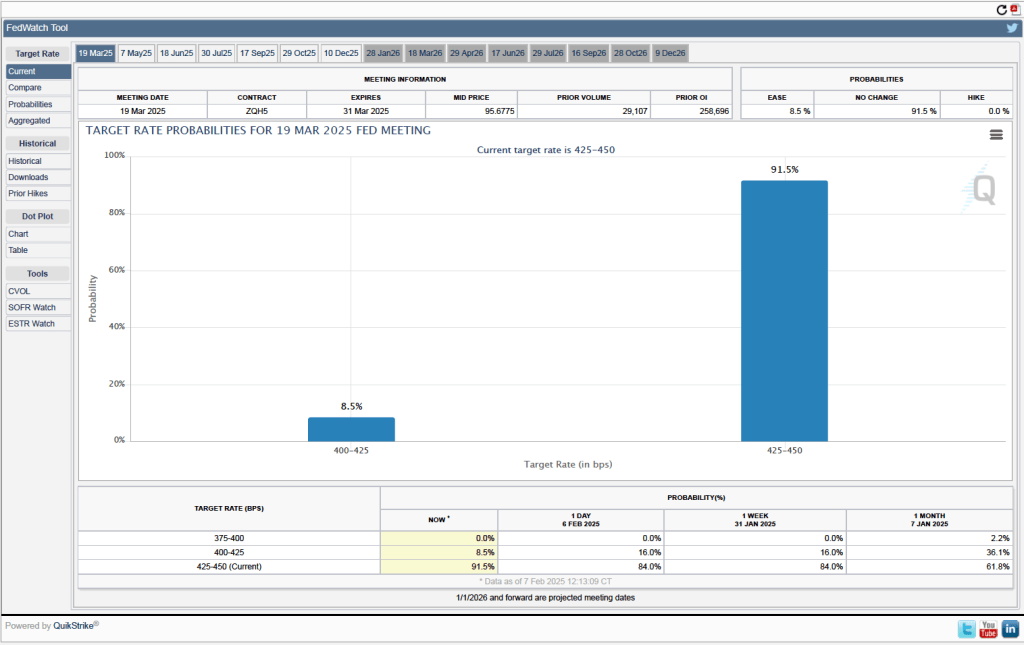
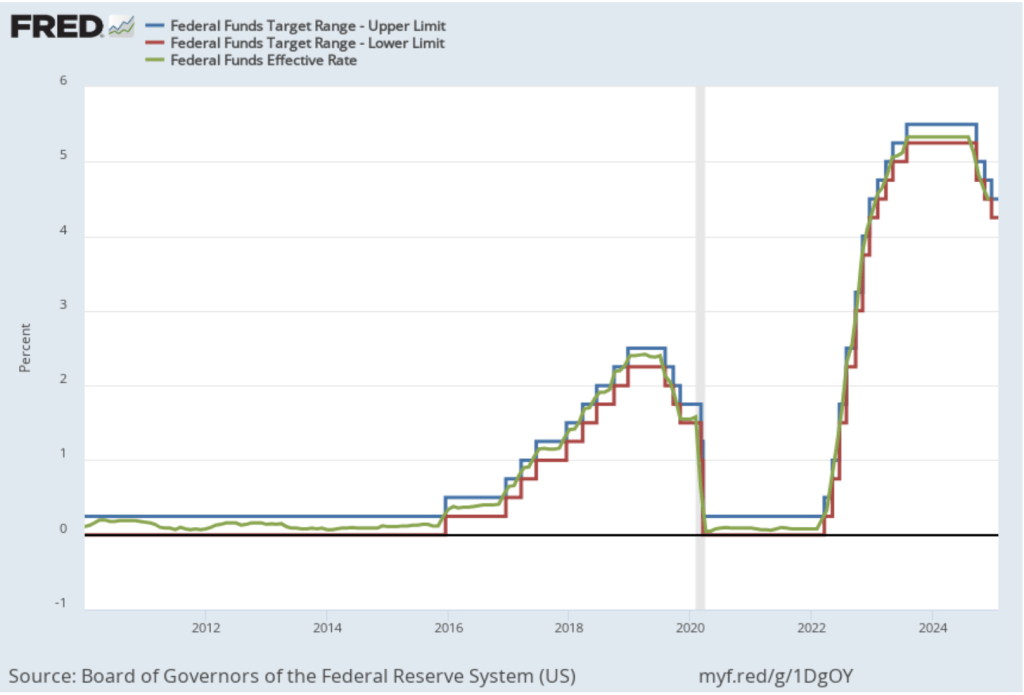
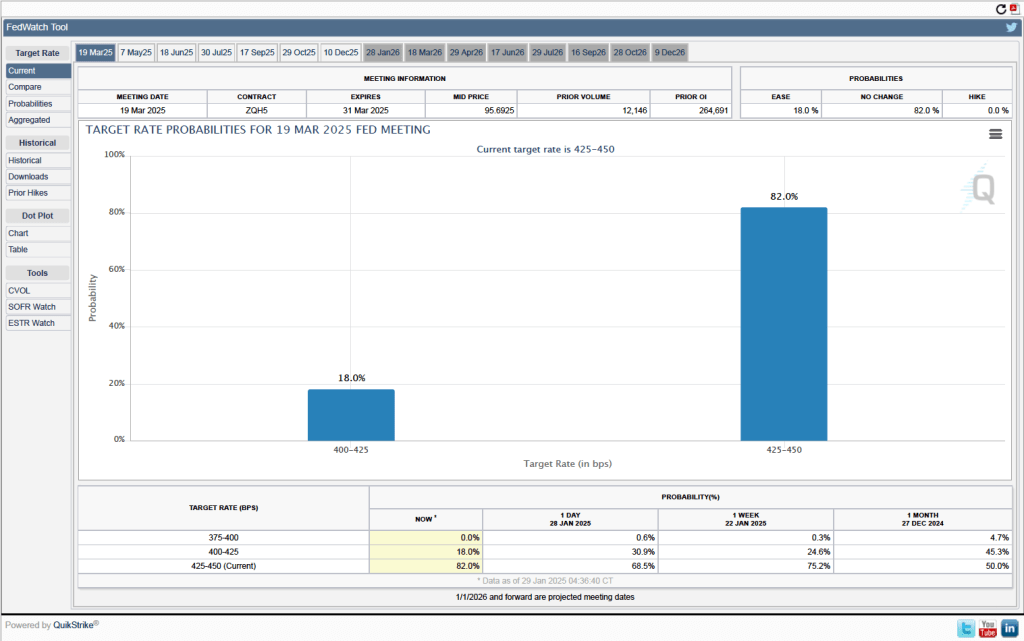
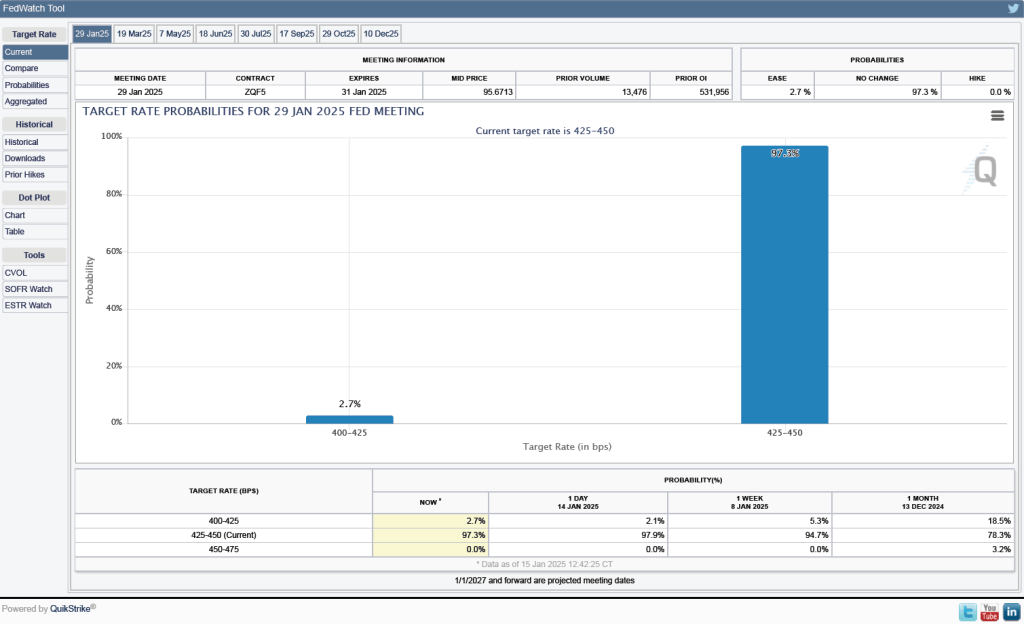
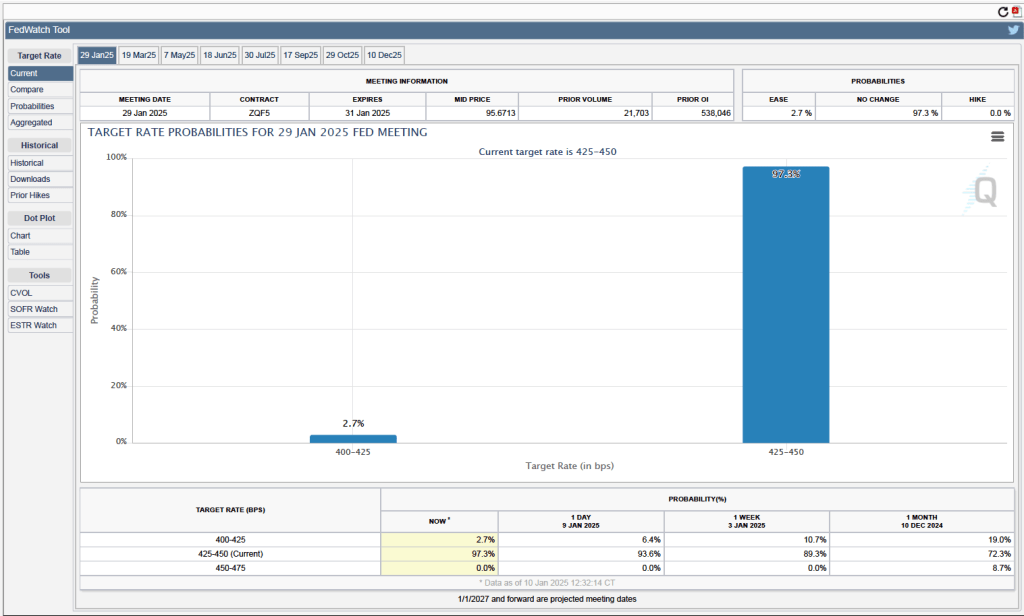
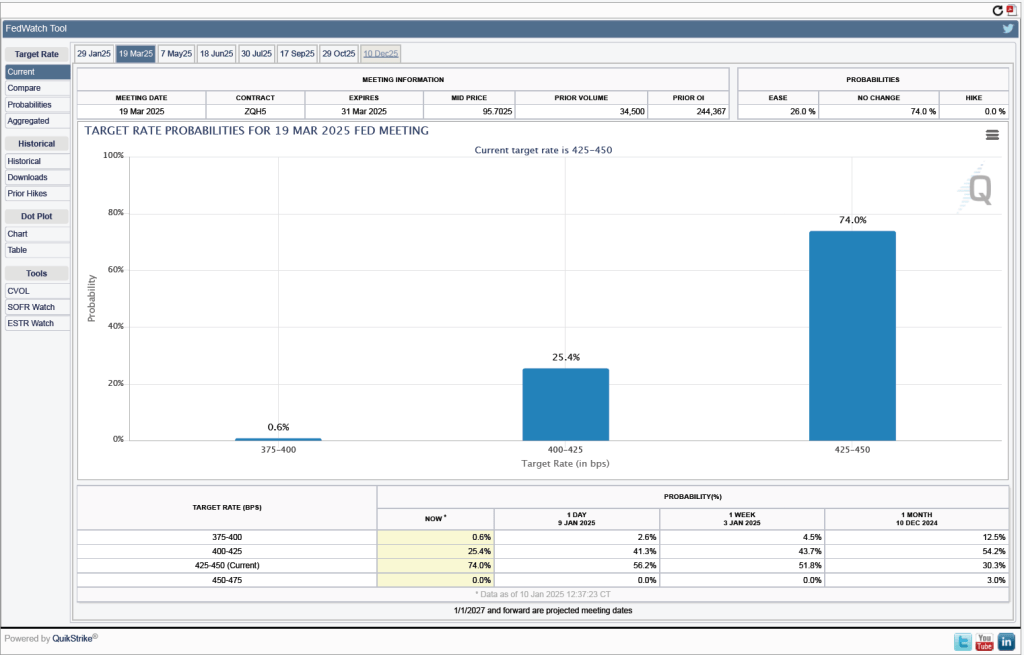
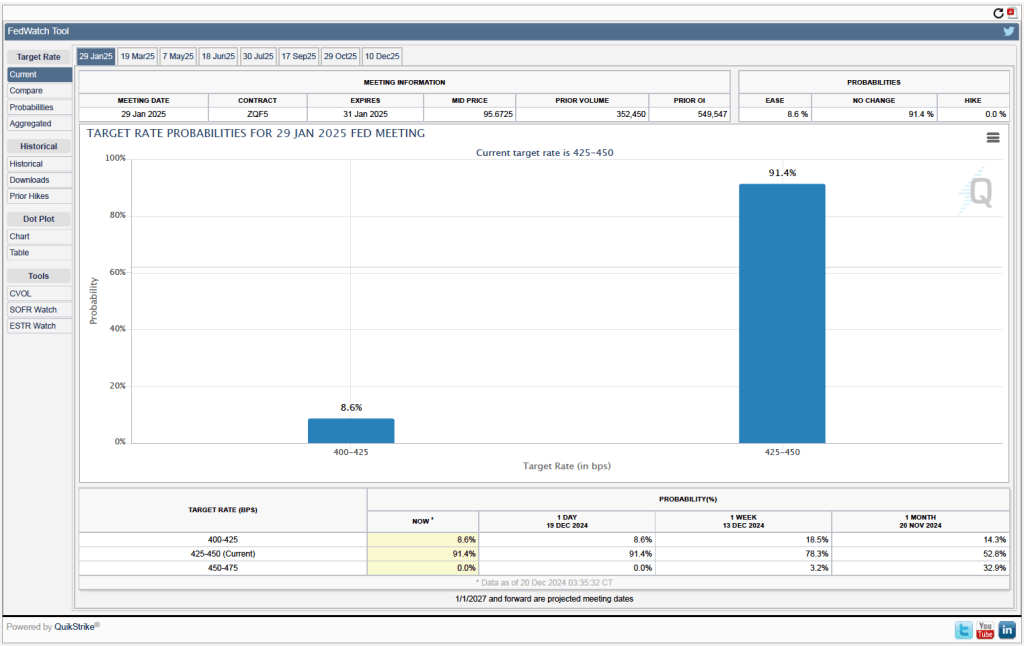
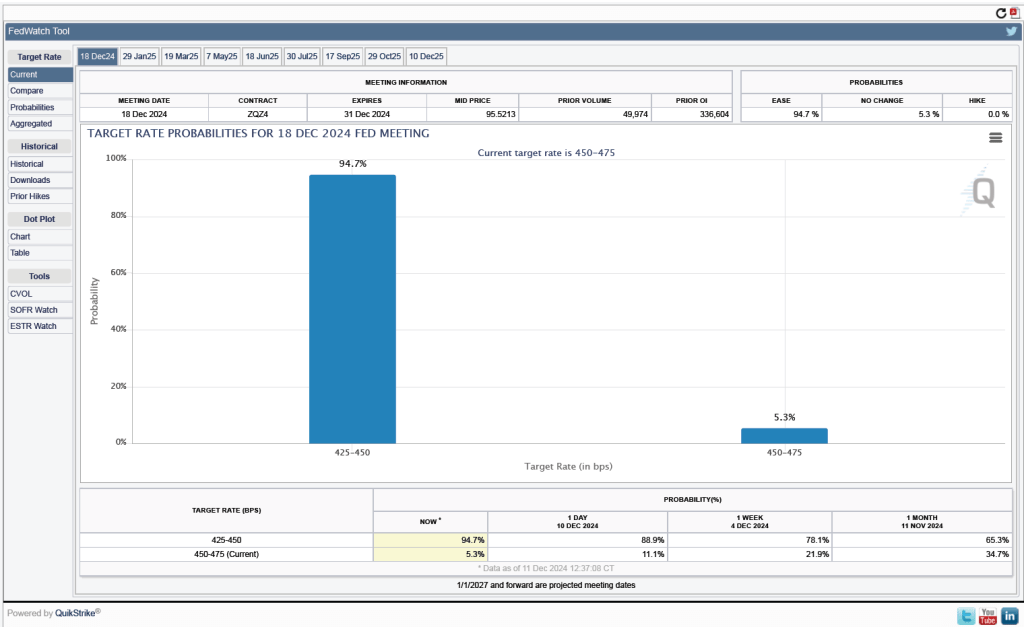
There isn’t much in today’s jobs report to change the consensus view that the Fed’s policymaking Federal Open Market Committee (FOMC) will leave its target for the federal funds rate unchanged at its next meeting on March 18-19. One indication of expectations of future rate cuts comes from investors who buy and sell federal funds futures contracts. (We discuss the futures market for federal funds in this blog post.) As shown in the following figure, today these investors assign a probability of 91.5 percent to the FOMC keeping its target range for the federal funds rate unchanged at the current range of 4.25 percent to 4.50 percent at the March meeting. Investors assign a probability of only 8.5 percent to the FOMC cutting its target range by 25 basis points at that meeting.