Image created by ChatGPT
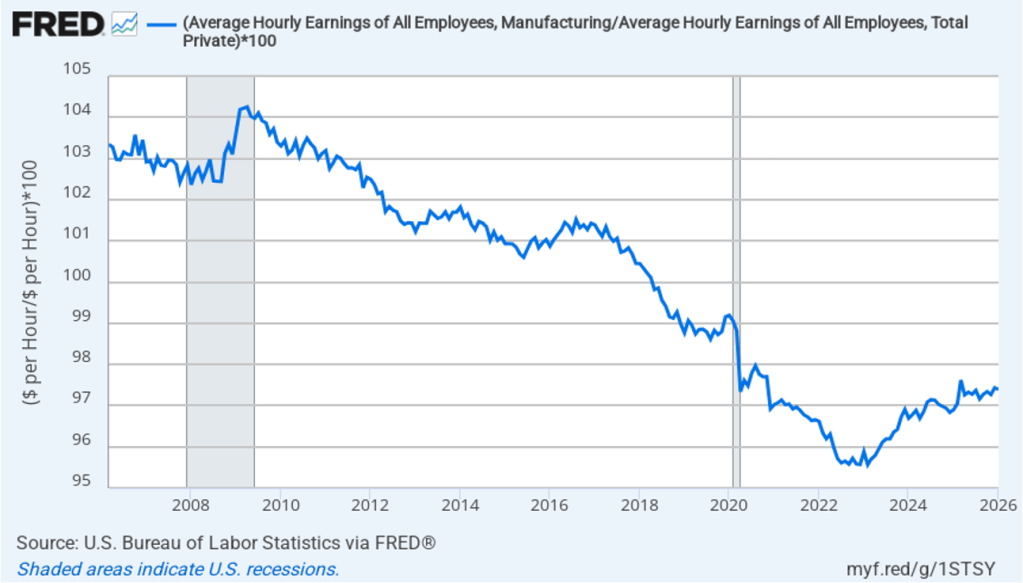
Every president dating back to at least Ronald Reagan, who took office in January 1981, has promised to increase manufacturing employment. Manufacturing jobs are often seen as making it possible for workers without a college degree to earn a middle-class income. As the following figure shows, though, since 2018, average hourly earnings of workers in manufacturing have actually been less than average hourly earnings of all workers.
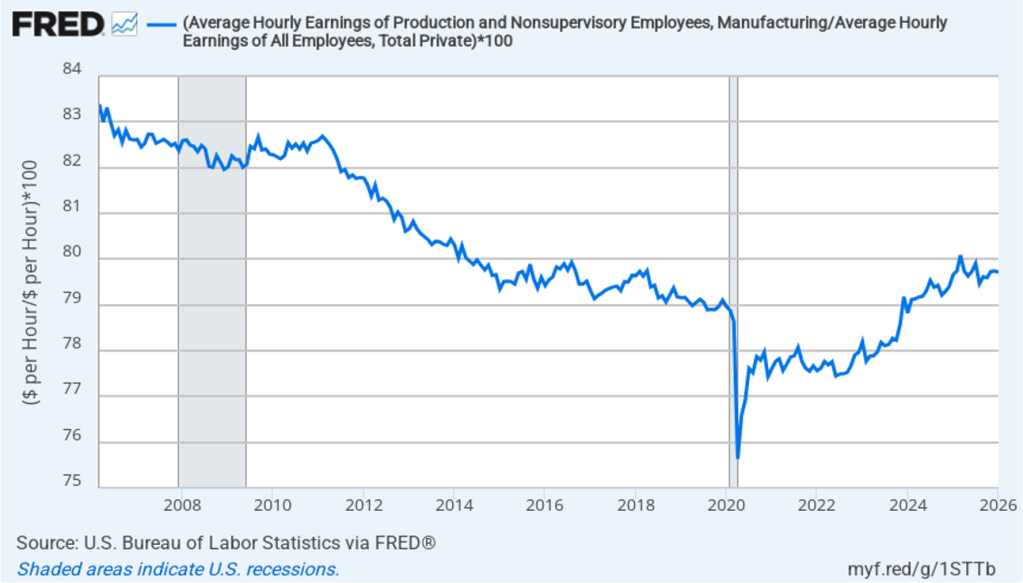
If we look at just the wages of production and nonsupervisory workers in manufacturing—like the workers shown in the image above—during the past 20 years, the average hourly earnings of production workers in manufacturing have generally been about 20 percent less than the average hourly earnings of all workers.
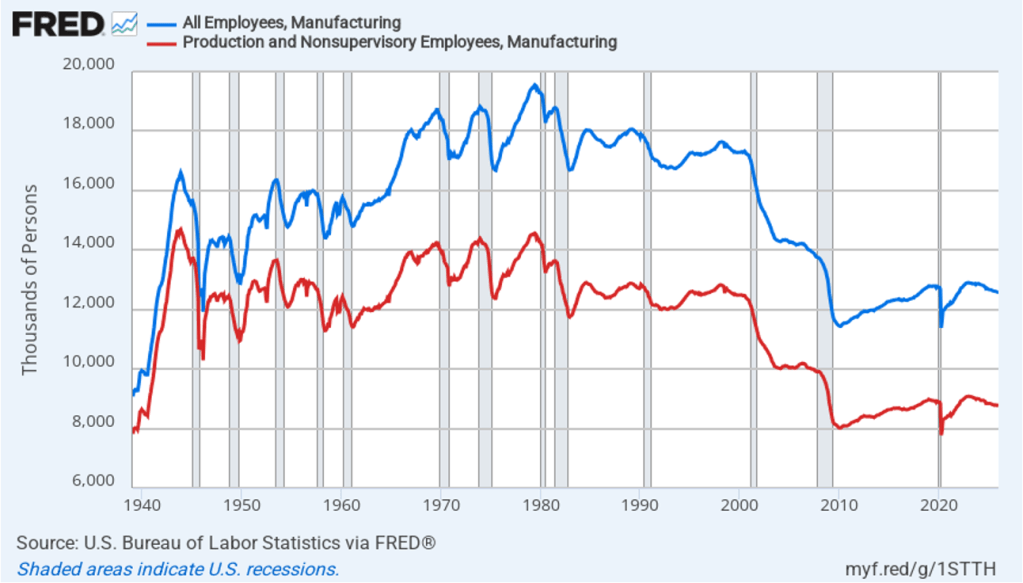
The following figure shows the absolute number of all employees in manufacturing (the blue line) and production and nonsupervisory employees in manufacturing monthly since 1939. Employment of production workers peaked in 1943, during World War II. Employment of all employees in manufacturing peaked in 1979. (All employees in manufacturing include, in addition to production workers, managers and other employees with administrative duties, accountants, lawyers, salespeople, and all other employees not directly concerned with production.) The trend in manufacturing employment has generally been downward since 1979 and has been below 13 million every month since December 2008. In January 2026, there were 12.6 million total employees in manufacturing of whom 8.8 million were production workers.
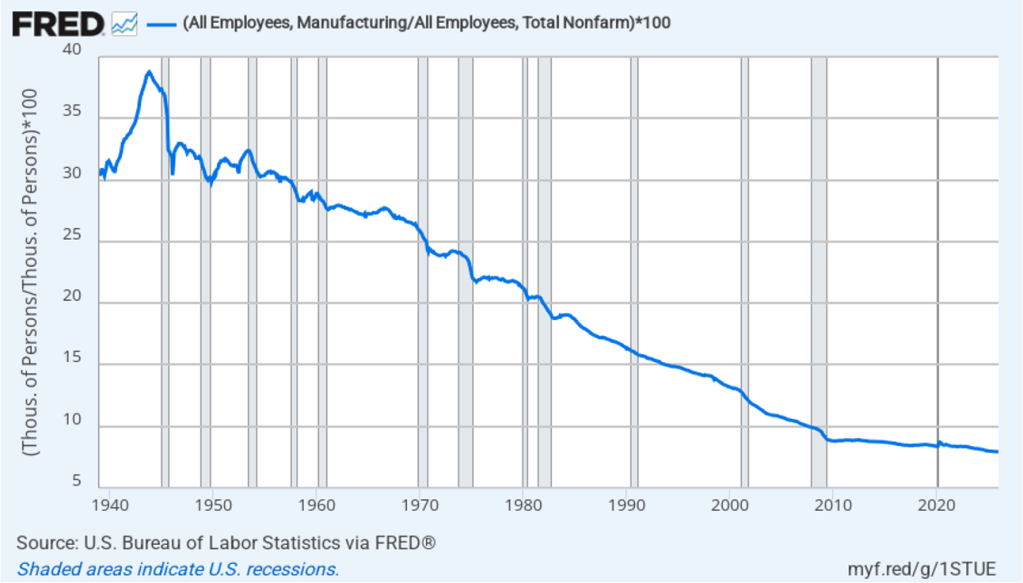
The following figure shows manufacturing employment as a percentage of total employment for each month since 1939. Manufacturing employment peaked as percentage of total employment at 38.7 percent in 1943. It has slowly trended down since that time, being below 10 percent every month since September 2007. In January 2026, manufacturing employment was 7.9 percent of total employment.
All of the data in the figurs shown so far are from the establishment survey (formally, the Current Employment Statistics (CES)). Recently, Adam Ozimek, Benjamin Glasner, and Jiaxin He of the Economic Innovation Group have examined the discrepancy between the number of manufacturing workers as reported in establishment survey and the larger number of manufacturing workers reported in the household survey (formally, the Current Population Survey (CPS).) Each month when the Bureau of Labor Statistics (BLS) releases its “Employment Situation” report, usually referred to as the “jobs report,” attention focuses on two numbers: The change in total employment as calculated from the establishment survey and the unemployment rate as calculated from the household survey.
In addition to the unemployment rate, the BLS releases monthly data on total employment and on employment by industry from the household survey. Most economists, policymakers, and investment analysts pay little attention to the data on employment by industry from the household survey because the employment by industry data from the establishment survey is considered more reliable. In fact, the employment by industry data from the household survey isn’t included among the many macro series available on the FRED site. The following figure reproduces the two establishment survey (CES) data (the blue and red lines) shown in the third figure above along with the household survey (CPS) data (the green line) from the BLS site. (Note that the household survey data is choppier than the data in the other two series because it is not seasonally adjusted.)
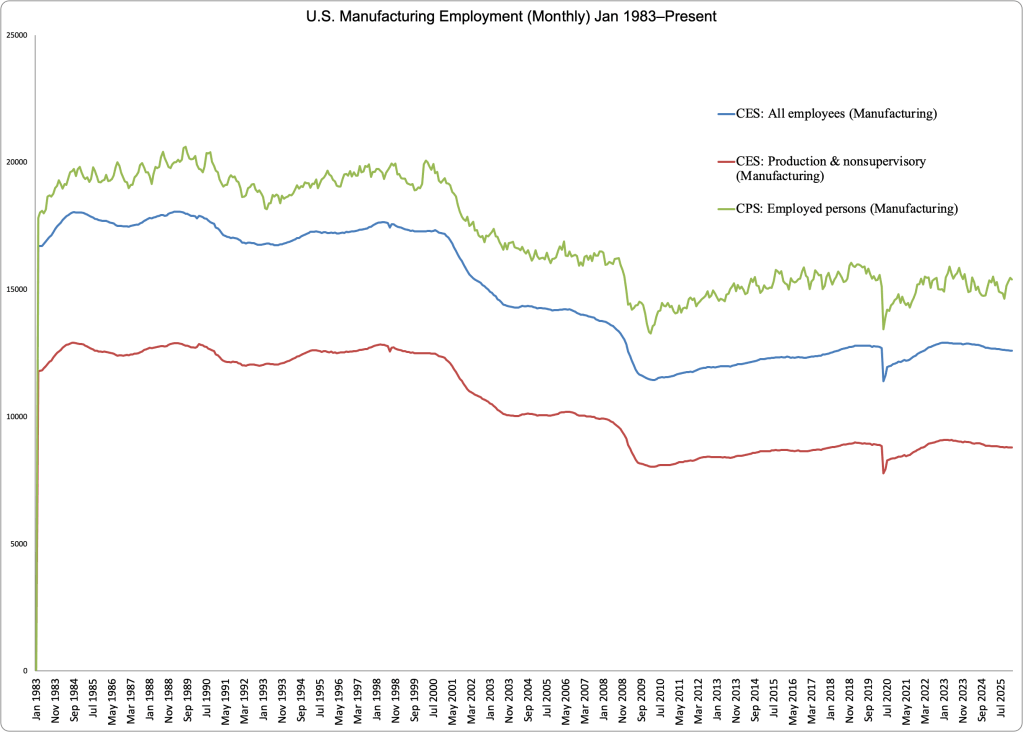
Manufacturing employment is consistently larger in the household survey data than in the establishment survey data. For example, in January 2026, total manufacturing employment according to the establishment survey was 12.6 million, whereas total manufacturing employment according to the household survey was 15.4 million—a difference of 2.7 million. Put another way, if the household survey is accurate, manufacturing employment is actually 20 percent higher than it appears from the widely-used establishment survey data.
The establishment survey data is collected by surveying firms, whereas the household survey data is collected from surveying workers. In other words, in January, 2.7 million more workers considered themselves to be in manufacturing than firms reported were actually working in manufacturing. Typically, economists and policymakers consider results from the establishment survey to be more reliable because firms are legally obliged to keep accurate accounts of the number of their employees, whereas the answers from workers responding to surveys are accepted without additional checking.
Ozimek, Glasner, and He note that the persistence of a gap between the establishment and household data on manufacturing employment indicates that there are some establishments that the census considers to be engaged in some activity other than manufacturing but whose workers consider themselves to be in manufacturing. The authors present a careful discussion of the issues involved and the entire piece (linked to above) is worth reading carefully by anyone who is concerned about this issue, but we can mention here one particularly interesting point.
The authors link to a paper by Andrew Bernard and Theresa Fort of Dartmouth College discussing “factoryless goods producing firms,” which are “manufacturing-like as they perform many of the tasks and activities found in manufacturing firms” but that don’t actually manufacture goods. Ozimek, Glasner, and He give as one example Apple’s Elk Grove, California site. They note that at one time Apple assembled computers at that site but that currently “there is no assembly at that location, but thousands of Apple employees work there on logistics, distribution, repair, and customer support.” In other words, the site contributes to manufacturing Apple’s products and, if surveyed, many of its employees might respond that they work in manufacturing, but because no products are actually assembled at the site, the site won’t be considered as engaged in manufacturing by the establishment survey. They conclude that: “These sorts of employees—who work adjacent to manufacturing, but not in categorized establishments—make up a big chunk of the 2.2 to 2.8 million missing manufacturing workers.”
Clearly, an important issue in an accurate count of manufacturing workers is a definition of what we mean by manufacturing. Should a particular site—establishment—be considered as engaged in manufacturing only if products are assembled at that site? Or should a site be considered as engaged in manufacturing if its purpose is to support assembly that is done elsewhere?
Because the number of manufacturing workers and the fraction of the labor force engaged in manufacturing have been important political issues for decades, it’s somewhat surprising how little attention has been devoted to ensuring that we’re actually correctly measuring manufacturing employment.