Is the U.S Labor Market Weaker Than It Seems?

The monthly “Employment Situation” report from the Bureau of Labor Statistics (BLS) is closely watched by economists, investment analysts, and Federal Reserve policymakers. Many economists believe that the payroll employment data from the report is the best single indicator of the current state of the economy.

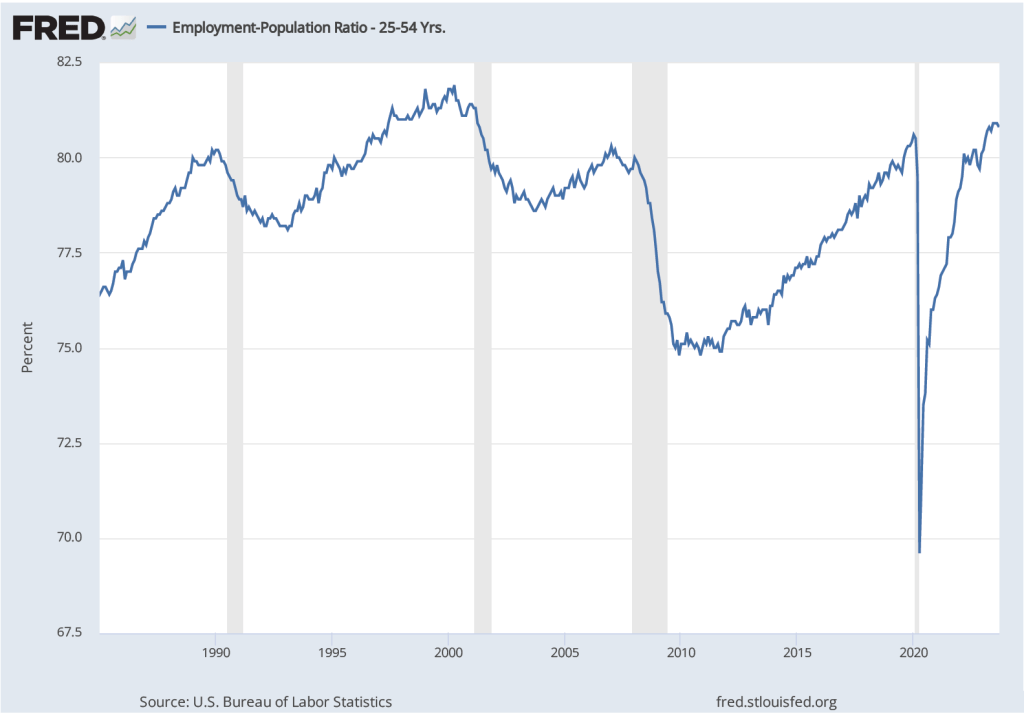
Most economists, inside and outside of the government, accept the dates determined by the Business Cycle Dating Committee of the National Bureau of Economic Research (NBER) for when a recession begins and ends. Although that committee takes into account a variety of macroeconomic data series, the peak of a business cycle as determined by the committee almost always corresponds to the peak in payroll employment and the trough of a business cycle almost always corresponds to the trough in payroll employment.

One drawback to relying too heavily on payroll employment data in gauging the state of the economy is that the data are subject to—sometimes substantial—revisions. As the BLS explains: “Monthly revisions result from additional reports received from businesses and government agencies since the last published estimates and from the recalculation of seasonal factors.” The revisions can be particularly large at the beginning of a recession.

For example, the following figure shows revisions the BLS made to its initial estimates of the change in payroll employment during the months around the 2007–2009  recession. The green bars show months for which the BLS revised its preliminary estimates to show that fewer jobs were lost (or that more jobs were created), and the red bars show months for which the BLS revised its preliminary estimates to show that more jobs were lost (or that fewer jobs were created).

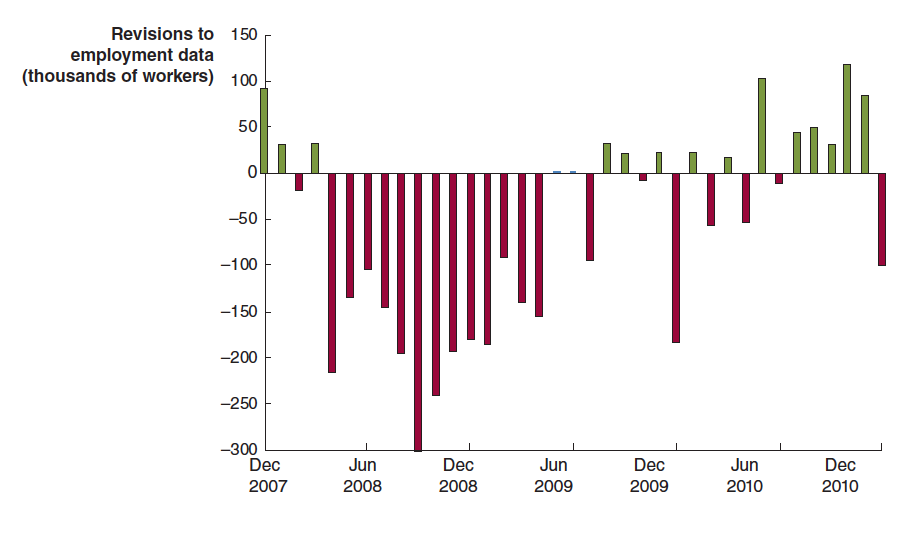
For example, the BLS initially reported that employment declined by 159,000 jobs during September 2008. In fact, after additional data became available, the BLS revised its estimate to show that employment had declined by 460,000 jobs during the month—a difference of 300,000 more jobs lost. As the recession deepened between April 2008 and April 2009, the BLS’s initial reports underestimated the number of jobs lost by 2.3 million. In other words, the recession of 2007–2009 turned out to be much more severe than economists and policymakers realized at the time.

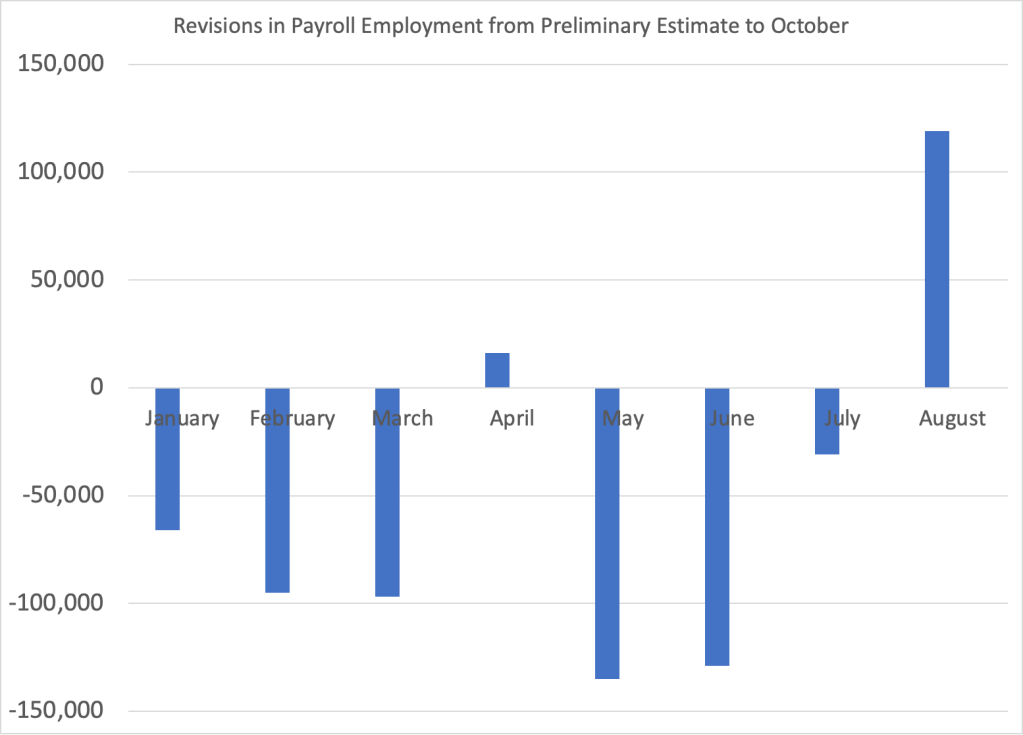
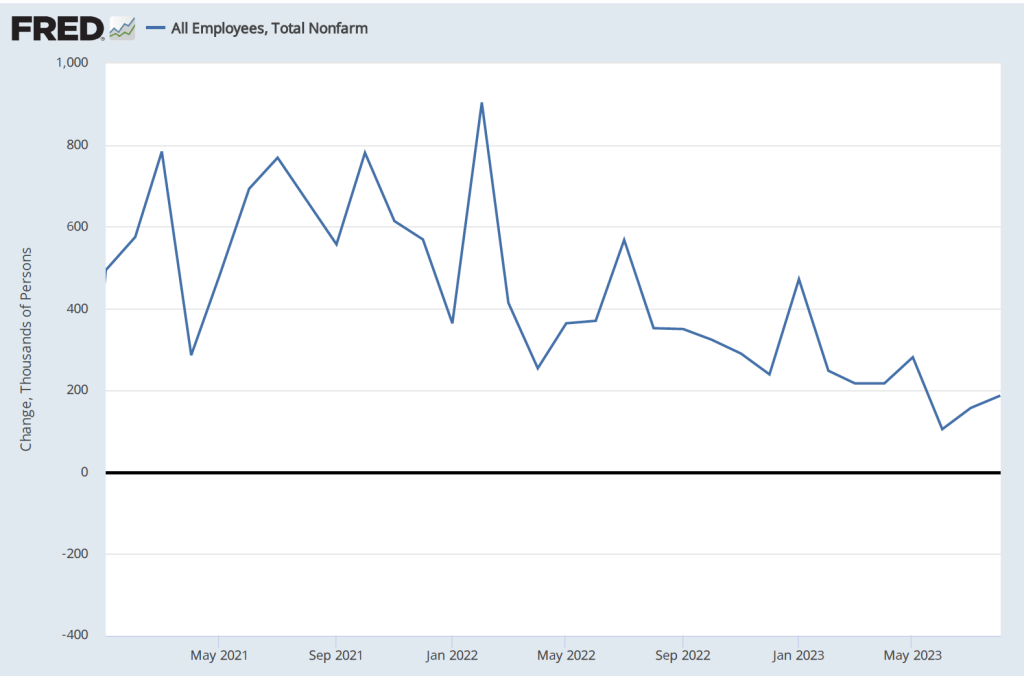
The BLS also made substantial revisions to its initial estimates of payroll employment for 2020 and 2021 during the Covid pandemic, as the following figure shows. (Note that this figure appears in our new 9th edition of Macroeconomics, Chapter 9, Section 9.1 (Economics, Chapter 19, Section 19.1 and Essentials of Economics, Chapter 13, Section 13.1).)

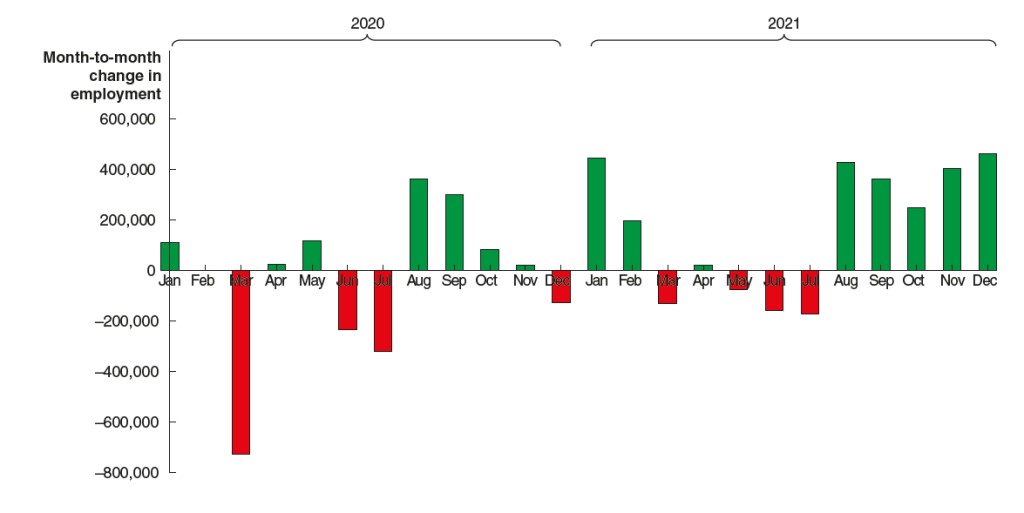
The BLS initially estimated that employment in March 2020 declined by about 700,000. After gathering more data, the BLS revised its estimate to indicate that employment declined by twice as much. Similarly, the BLS’s initial estimates substantially understated the actual growth in employment from August to December 2021. After gathering more data, the BLS revised its estimate to indicate that nearly 2 million more jobs had been created during those months than it had originally estimated.

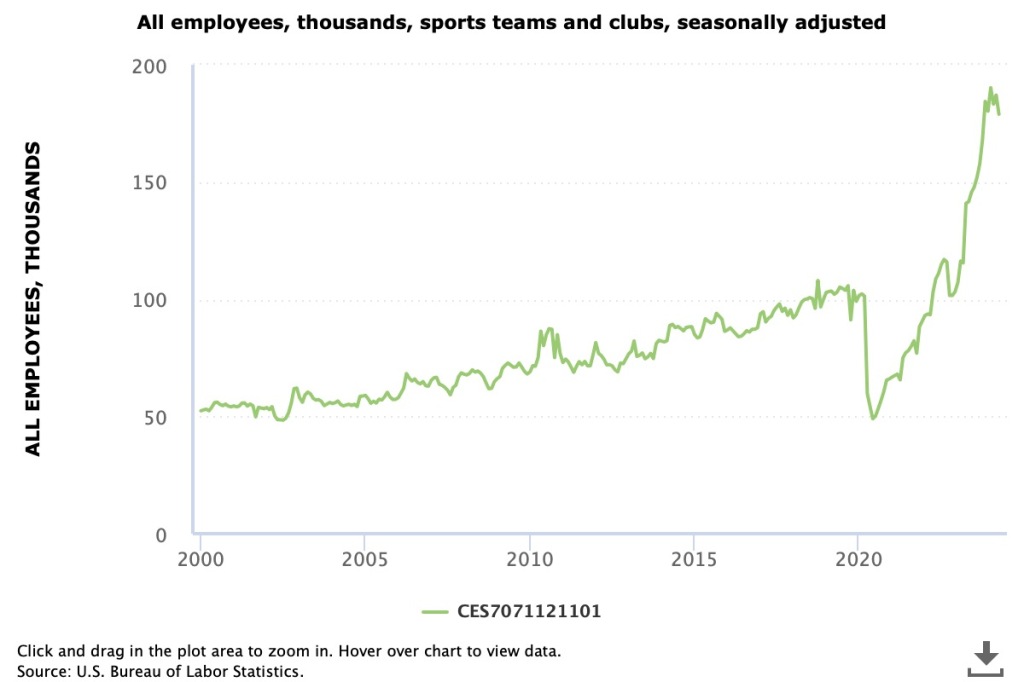
Just as the initial estimates for total payroll employment are often revised by sutbstantial amounts up or down, the same is true of the initial estimates of payroll employment in individual industries. Because the number of establishments surveyed in any particular industry can be small, the initial estimates can be highly inaccurate. For instance, Justin Fox, a columnist for bloomberg.com recently noted what appears to be a surge in employment in the “sports teams and clubs” industry. As the following figure shows, employment in this industry seems to have increased by an improbably large 75 percent. Was there a sudden increase in the United States in the number of new sports teams? Certainly not over just a few months. It’s more likely that most of the increase in employment in this industry will disappear when the initial employment estimates are revised.

One source of data for the BLS revisions to the monthly payroll employment data is the BLS’s “Quarterly Census of Employment and Wages.” The QCEW is based on the reports required of all firms that participate in the state and federal unemployment insurance program. The BLS estimates that 95 percent of all jobs in the United States are included in the QCEW data. As a result, the QCEW surveys about 11.9 million establishments as opposed to the 666,000 establishments included in the establishment survey.

The BLS uses the QCEW to benchmark the payroll employment data, which reconciles the two series. The BLS makes the revisions with a lag. For instance, the payroll employment data for 2023 won’t be revised using the QCEW data until August 2024. Looking at the 2023 employment data from the two series shows a large discrepancy, as seen in the following figure.

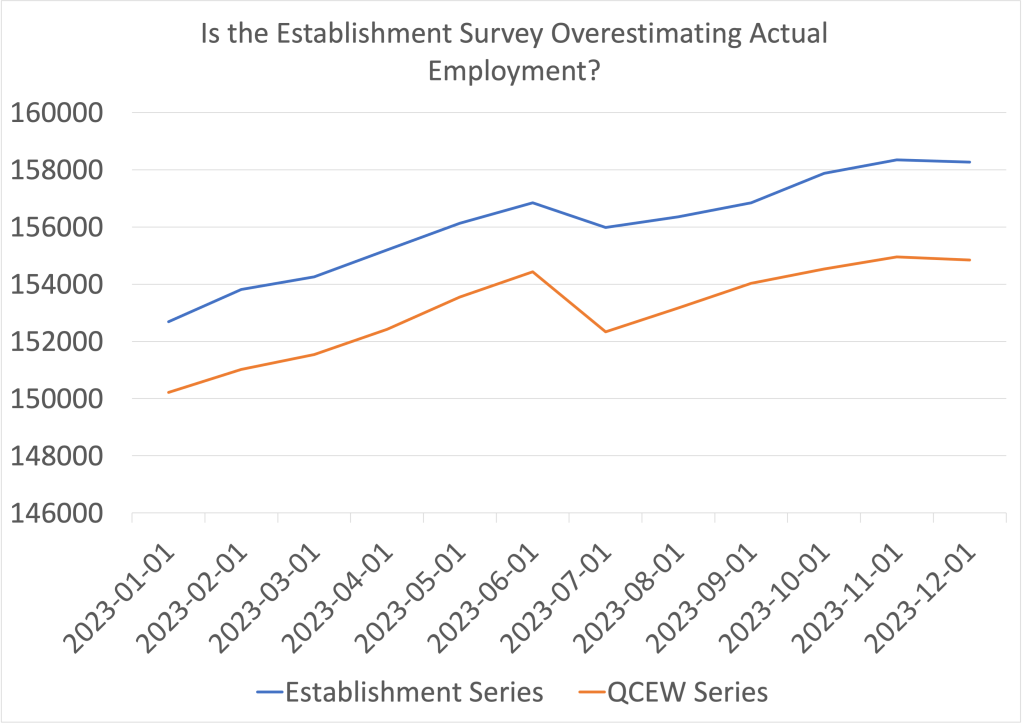
The blue line shows the employment data from the establishment survey and the orange line shows the data from the QCEW survey. (Both series are of nonseasonally adjusted data.) The values on the vertical axis are thousands of workers. In December 2023, the establishment survey indicated that a total of 158,347,000 people were employed in the nonfarm sector in the United States. The QCEW series shows a total of 154,956,133 people were employed in the nonfarm sector—about 3.4 million fewer.

How can we interpret the discrepancy between the employment totals from the two series? The most straightforward interpretation is that the QCEW data, which uses a larger sample, is more accurate and payroll employment has been significantly overstating the level of employment in the U.S. economy. In other words, the labor market was weaker in 2023 than it seemed, which may help to explain why inflation slowed as much as it did, particularly in the second half of the year.

However, this interpretation is not clear cut because the QCEW data are also subject to revision. As Ernie Tedeschi, director of economics at the Budget Lab at Yale and former chief economist for the Council of Economic Advisers, has pointed out, the QCEW data are typically revised upwards, which would close some of the gap between the two series. So, although it seems likely that the closely watched payroll employment data have overstated the strength of the labor market, we won’t get a clearer indication of how large the overstatement is until August when the BLS will use the QCEW data to benchmark the payroll employment data.

Upward Revision of 2023 Fourth Quarter Real GDP Growth May Add to Fed’s Hesitancy to Raise Fed Funds Target

(Photo courtesy of Lena Buonanno)

The Bureau of Economic Analysis (BEA) has issued its third estimate of real GDP for the fourth quarter of 2023. The BEA now estimates that real GDP increased in the fourth quarter of 2023 at an annual rate of 3.4 percent, an increase from the BEA’s second estimate of 3.2 percent. The BEA noted that: “The update primarily reflected upward revisions to consumer spending and nonresidential fixed investment that were partly offset by a downward revision to private inventory investment.”

As the blue line in the following figure shows, despite the upward revision, fourth quarter growth in real GDP decline significantly from the very high growth rate of 4.9 percent in the third quarter. In addition, two widely followed “nowcast” estimates of real GDP growth in the first quarter of 2024 show a futher slowdown. The nowcast from the Federal Reserve Bank of Atlanta estimates that real GDP will have grown at an annualized rate of 2.1 percent in the first quarter and the nowcast from the Federal Reserve Bank of New York estimates a growth rate of 1.9 percent. (The Atlanta Fed describes its nowcast as “a running estimate of real GDP growth based on available economic data for the current measured quarter.” The New York Fed explains: “Our model reads the flow of information from a wide range of macroeconomic data as they become available, evaluating their implications for current economic conditions; the result is a ‘nowcast’ of GDP growth ….”)

Data on growth in real gross domestic income (GDI), on the other hand, show an upward trend, as indicated by the red line in the figure. As we discuss in Macroeconomics, Chapter 8, Section 8.4 (Economics, Chapter 18, Section 18.4), gross domestic product measures the economy’s output from the production side, while gross domestic income does so from the income side. The two measures are designed to be equal, but they can differ because each measure uses different data series and the errors in data on production can differ from the errors in data on income. Economists differ on whether data on growth in real GDP or data on growth in real GDI do a better job of forecasting future changes in the economy. Accordingly, economists and policymakers will differ on how much weight to put on the fact that while the growth in real GDI had been well below growth in real GDP from the fourth quarter of 2022 to the fourth quarter of 2023, during the fourth quarter of 2023, growth in real GDI was 1.5 percentage points higher than growth in real GDP.

On balance, it seems likely that these data will reinforce the views of those members of the Fed’s policy-making Federal Open Market Committee (FOMC) who were cautious about reducing the target for the federal funds rate until the macroeconomic data indicate more clearly that the economy is slowing sufficiently to ensure that inflation is returning to the Fed’s 2 percent target. In a speech on March 27 (before the latest GDP revisions became available), Fed Governor Christopher Waller reviewed the most recent macro data and concluded that:

“Adding this new data to what we saw earlier in the year reinforces my view that there is no rush to cut the [federal funds] rate. Indeed, it tells me that it is prudent to hold this rate at its current restrictive stance perhaps for longer than previously thought to help keep inflation on a sustainable trajectory toward 2 percent.”

Most other members of the FOMC appear to share Waller’s view.

Surprisingly Strong Jobs Report

Photo from Lena Buonanno

When the Bureau of Labor Statistics’ Employment Situation report is released on the first Friday of each month economists and policymakers—notably including the members of the Federal Reserve’s Federal Open Market Committee (FOMC)—focus on the change in total nonfarm payroll employment as recorded in the establishment, or payroll, survey. That number gives what is generally considered to be the best indicator of the current state of the labor market. The most recent report showed a surprisingly strong net increase of 336,000 jobs during September. (The report can be found here.)

According to a survey by the Wall Street Journal, economists had been expecting an net increase in jobs of only 170,000. The larger than expected increase indicated that the economy might be expanding more rapidly than had been thought, raising the possibility that the FOMC might increase its target for the federal funds rate at least once more before the end of the year.

To meet increases in the growth of the U.S. working-age population, the economy needs to increase the total jobs available by approximately 80,000 jobs per month. A net increase of more than four times that amount may be an indication of an overheated job market. As always, one difficulty with drawing that conclusion is determing how many more people might be pulled into the labor market by a strong demand for workers. An increase in labor supply can potentially satisify an increase in labor demand without leading to an acceleration in wage growth and price inflation.

The following figure shows the employment-to-population ratio for workers ages 25 to 54—so-called prime-age workers—for the period since 1985. In September 2023, the ratio was 80.8 perccent, down slightly from 80.9 percent in August, but above the levels reached in early 2020 just before the effects of the Covid–19 pandemic were felt in the United States. The ratio was still below the record high of 81.9 percent reached in April 2000. The population of prime-age workers is about 128 million. So, if the employment-population ratio were to return to its 2000 peak, potentially another 1.3 million prime-age workers might enter the labor market. The likelihood of that happening, however, is difficult to gauge.

A couple of other points about the September employment report. First, it’s worth keeping in mind that the results from the establishment survey are subject to often substantial revisisons. The figure below shows the revisions the BLS has released as of October to their preliminary estimates for each month of 2023. In three of these eight months the revisions so far have been greater than 100,000 jobs. As we discuss in Macroeconomics, Chapter 9, Section 9.1 (Economics, Chapter 19, Section 19.1 and Essentials of Economics, Chapter 13, Section 13.1), the revisions that the BLS makes to its employment estimates are likely to be particularly large when the economy is about to enter a period of significantly lower or higher growth. So, the large revisions to the preliminary employment estimates in most months of 2023 may indicate that the surprisingly large preliminary estimate of a 336,000 increase in net employment will be revised lower in coming months.

Finally, data in the employment report provides some evidence of a slowing in wage growth, despite the sharp increase in employment. The following figure shows wage inflation as measured by the percentage increase in average hourly earnings (AHE) from the same month in the previous year. The increase in September was 4.2 percent, continuing a generally downward trend since March 2022, although still somewhat above wage inflation during the pre-2020 period.

As the following figure shows, September growth in average hourly earnings measured as a compound annual growth rate was 2.5 percent, which—if sustained—would be consistent with a rate of price inflation in the range of the Fed’s 2 percent target.  (The figure shows only the months since January 2021 to avoid obscuring the values for recent months by including the very large monthly increases and decrease during 2020.)

As we note in this blog post, the employment cost index (ECI), published quarterly by the BLS, measures the cost to employers per employee hour worked and can be a better measure than AHE of the labor costs employers face. The first figure shows the percentage change in ECI from the same quarter in the previous year. The second figure shows the compound annual growth rate of the ECI. Both measures show a general downward trend in the growth of labor costs, although the measures are somewhat dated because the most recent values are for the second quarter of 2023.

Ultimately, the key question is one we’ve considered in previous blog posts (most recently here) and podcasts (most recently here): Will the Fed be able to achieve a soft landing by bringing inflation down to its 2 percent target without triggering a recession? The September jobs report can be interpreted as increasing the probability of a soft landing if the slowing in wage growth is emphasized but decreasing the probability if the Fed decides that the strong employment growth is real—that is, the September increase is not likely to be revised sharply lower in coming months—and requires additional increases in the target for the federal funds rate. It’s worth mentioning, of course, that factors over which the Fed has no control, such as a federal government shutdown, rising oil prices, or uncertainty resulting from the attack on Israel by Hamas, will also affect the likelihood of a soft landing.

The Labor Market Continues to Cool  

As we discussed in this post, most recent data are consistent with the labor market having cooled, which should reduce upward pressure on wages and prices. On Friday morning, the Bureau of Labor Statistics (BLS) released its employment report for August 2023. (The report can be found here.) On balance, the data in the report are consistent with the labor market continuing to cool.

Data from the establishment survey showed an increase in payroll employment of 187,000, which is close to the increase of 170,000 economists surveyed by the Wall Street Journal had forecast. The following figure shows monthly changes in payroll employment since January 2021.

Although the month-to-month changes have been particularly volatile during this period as the U.S. economy recovered from the Covid–19 recession, the general trend in job creation has been downward. The following table shows average monthly increases in payroll employment for 2021, 2022, and 2023 through August. In the most recent three-month period, the average monthly increase in employment was 150,000.

PeriodAverage Monthly Increases in Employment
2021606,000
2022399,000
Jan.-Aug. 2023236,000

The BLS revised downward its previous estimates of employment increases in June and July by a combined 110,000. The changes to the estimate of the employment increase for June are particularly notable. As the following graph shows, on July 7, the BLS initially estimated the increase as 209,000. The BLS’s first revision on August 4, lowered the estimate to an increase of 187,000. The BLS’s second revision on September 1, lowered the estimate further to 105,000. In other words, the BLS now estimates that employment increased by only half as much in June as it initially reported. As we discuss in Macroeconomics, Chapter 9, Section 9.1 (Economics, Chapter 19, Section 19.1 and Essentials of Economics, Chapter 13, Section 13.1), the revisions that the BLS makes to its employment estimates are likely to be particularly large when the economy is about to enter a period of significantly lower or higher growth. So, the large revisions to the June employment estimate may indicate that during the summer economic growth slowed and labor market conditions eased.

Data from the household survey showed the unemployment rate increasing from 3.5 percent in July to 3.8 percent in August. The following figure shows that the unemployment rate has fluctuated in a narrow range since March 2022. Employment as estimated from the household survey increased by 222,000. The seeming paradox of the number of people employed and the unemployment rate both increasing is accounted for by the substantial 736,000 increase in the labor force.

Finally, as the first of the following figures shows, measured as the percentage change from the same month in the previous year, the increase in average hourly earnings (AHE) remained in its recent range of between 4.25 and 4.50 percent. That rate is down from its peak in mid-2022 but still above the rate of increase in 2019, before the pandemic. But, as the second figure shows, if we look at the compound rate of increase in AHE—that is the rate at which AHE would increase for the year if the current rate of monthly increase persisted over the following 11 months—we can see a significant cooling in the rate at which wages are increasing.

As a reminder, AHE are the wages and salaries per hour worked that private, nonfarm businesses pay workers. AHE don’t include the value of benefits that firms provide workers, such as contributions to 401(k) retirement accounts or health insurance. As an economy-wide average they suffer from a composition effect during periods in which employment either increases or decreases substantially because the mix of high-wage and low-wage workers may change. AHE are also subject to significant revisions. Therefore, short-range changes in AHE can sometimes be misleading indicators of the state of the labor market.