Image generated by ChatGTP-4o
Yesterday, in this blog post, we discussed the quarterly data on inflation as measured by changes in the personal consumption expenditures (PCE) price index. Today (July 31), the Bureau of Economic Analysis (BEA) released monthly data on the PCE price index as part of its “Personal Income and Outlays” report. The Fed relies on annual changes in the PCE price index to evaluate whether it’s meeting its 2 percent annual inflation target.
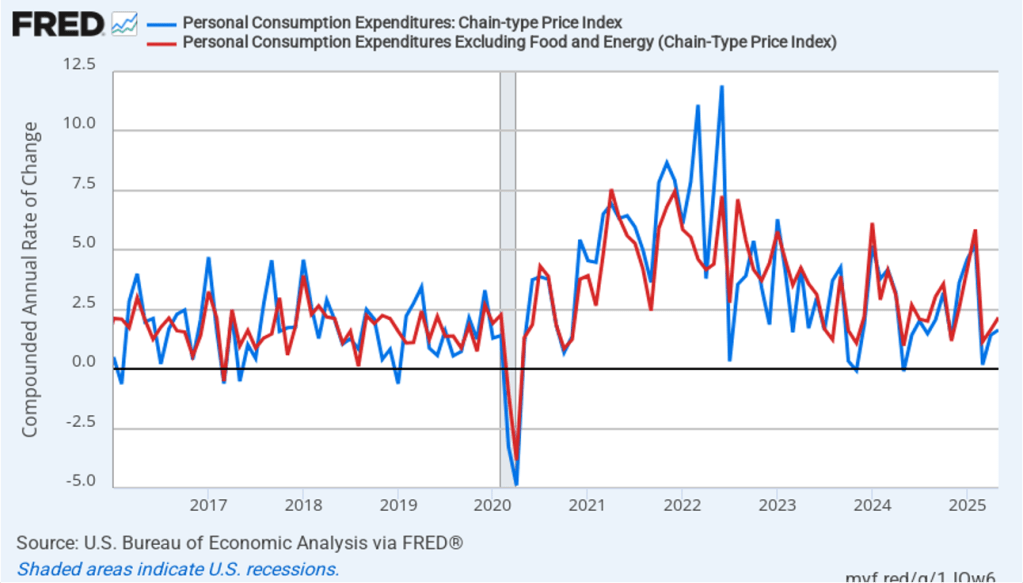
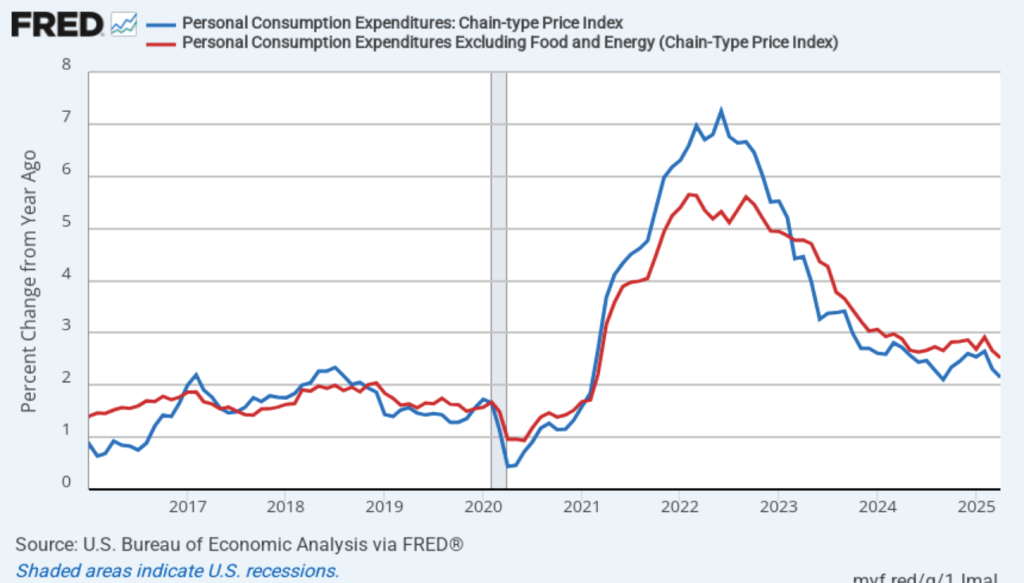
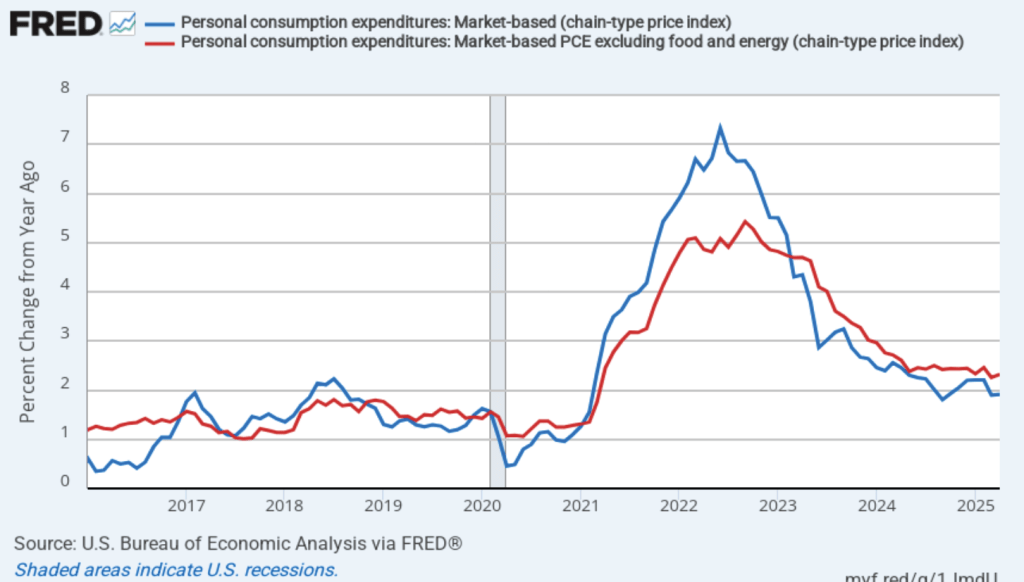
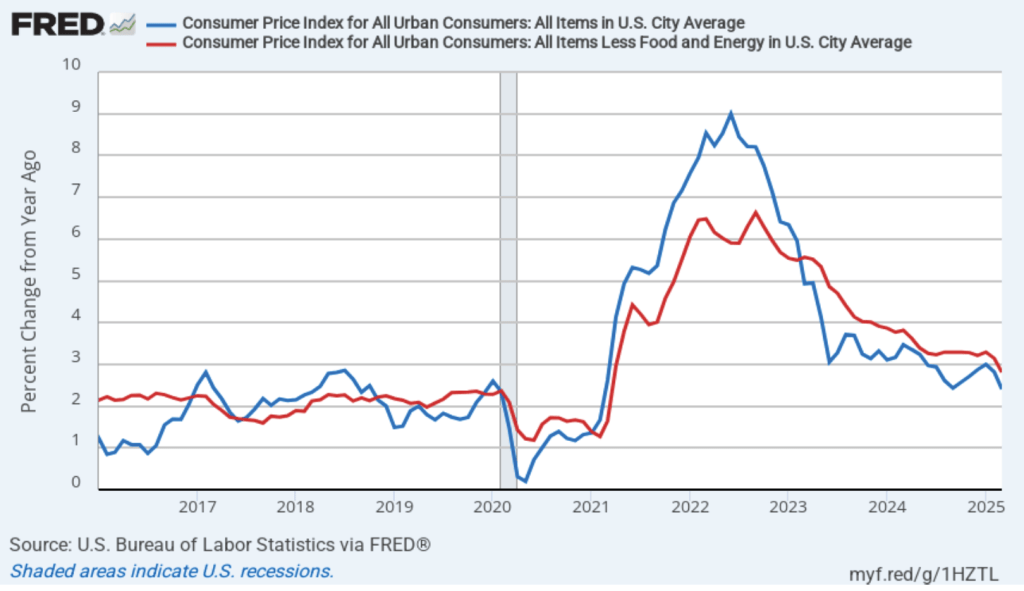
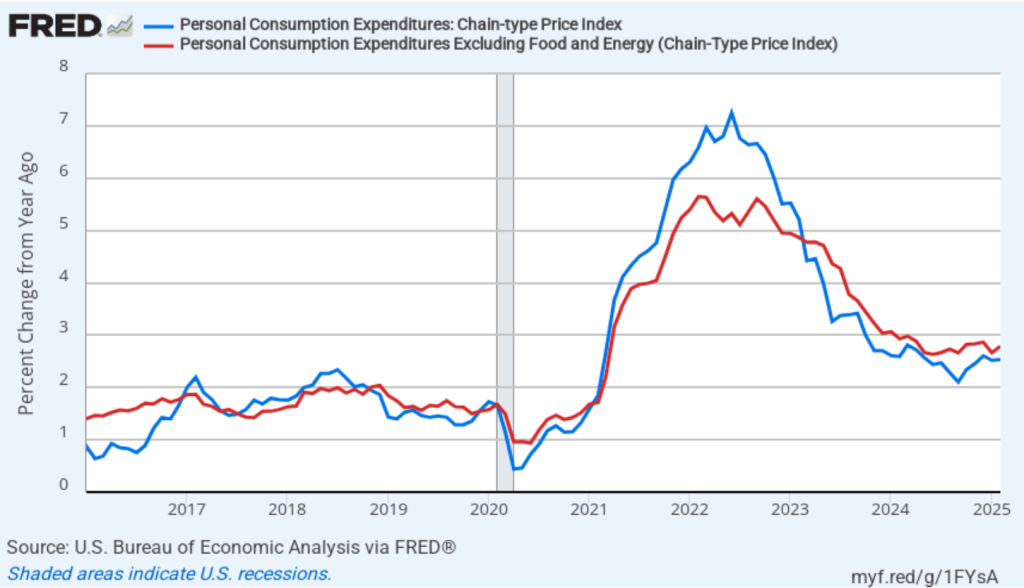
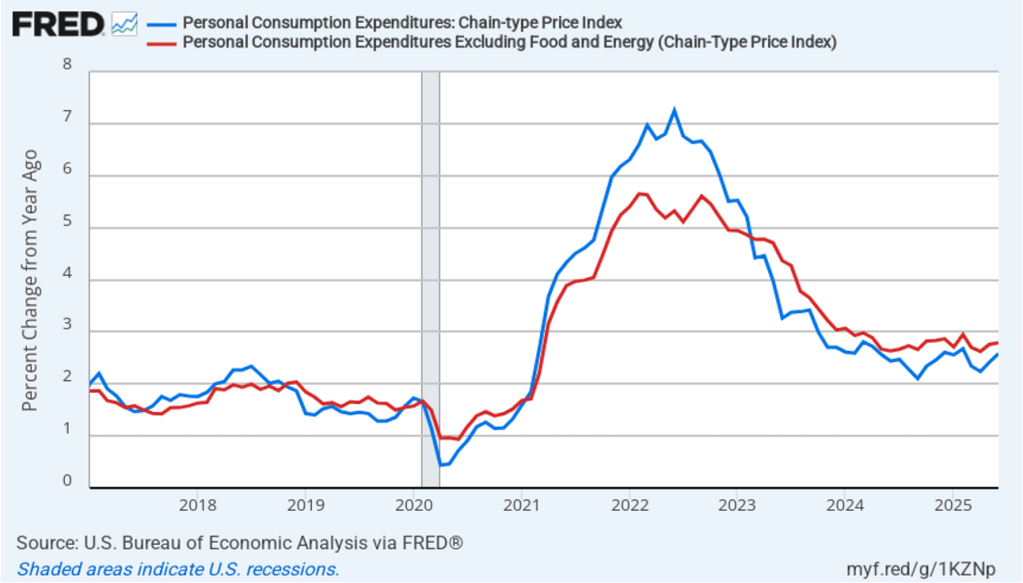
The following figure shows headline PCE inflation (the blue line) and core PCE inflation (the red line)—which excludes energy and food prices—for the period since January 2017, with inflation measured as the percentage change in the PCE from the same month in the previous year. In June, headline PCE inflation was 2.6 percent, up from 2.4 percent in May. Core PCE inflation in June was 2.8 percent, unchanged from May. Headline PCE inflation was higher than the forecast of economists surveyed, while core PCE inflation was the same as forecast.
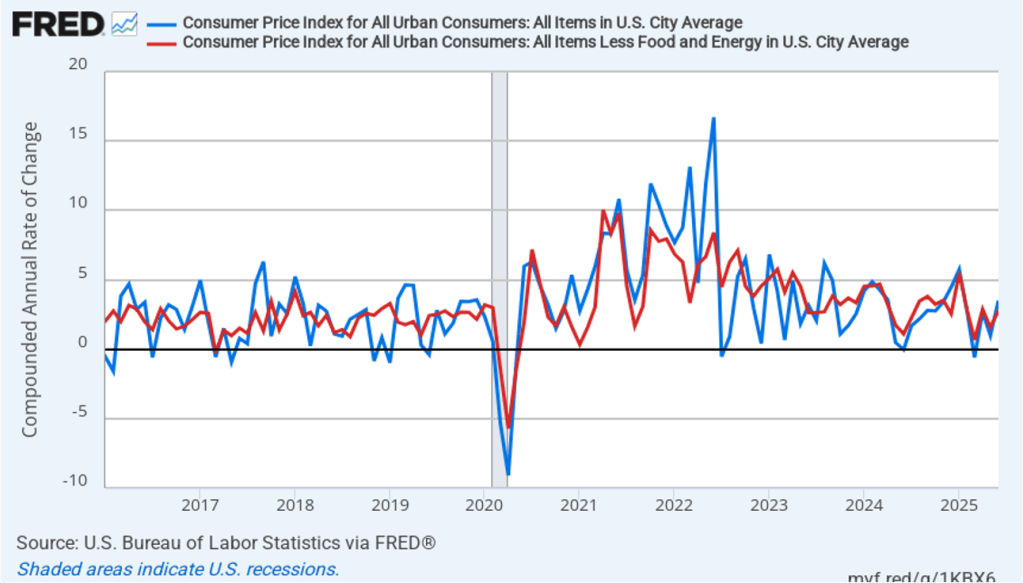
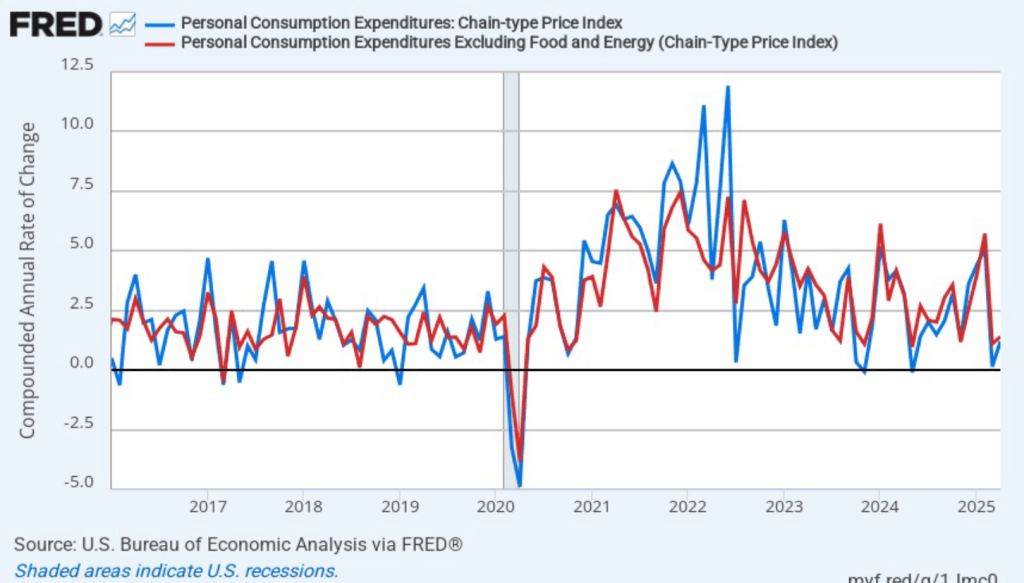
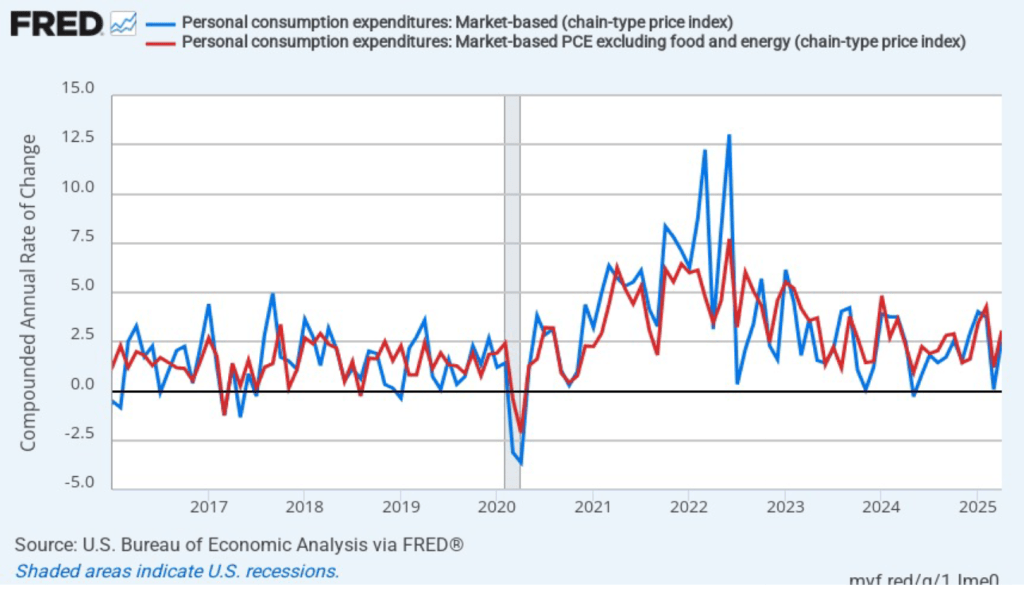
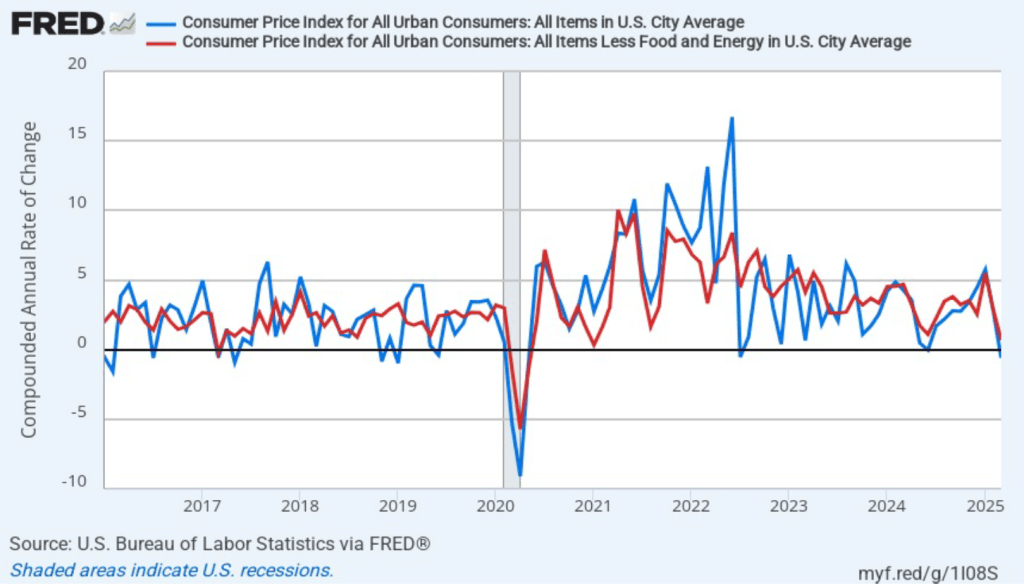
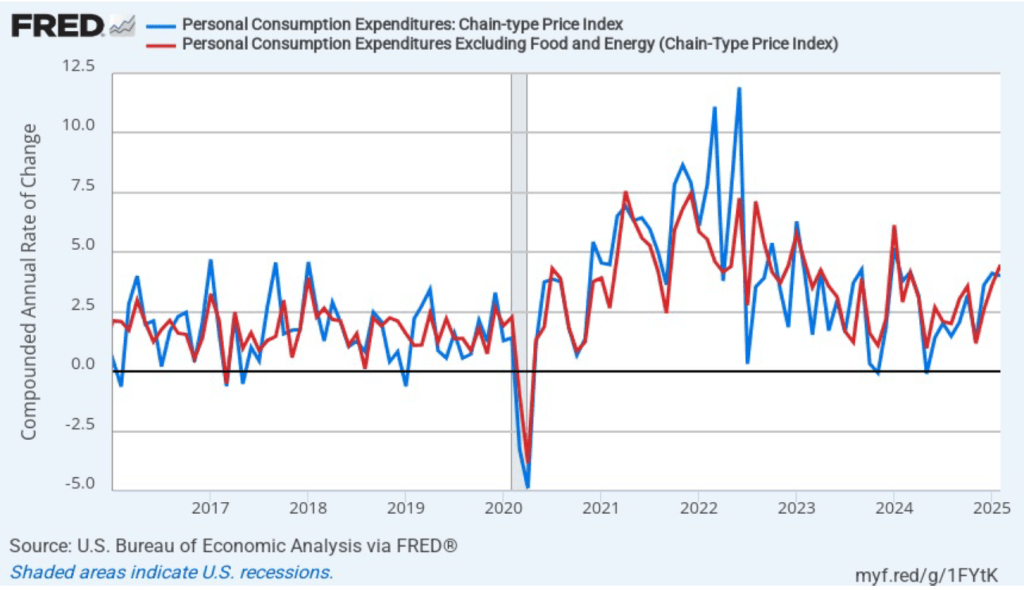
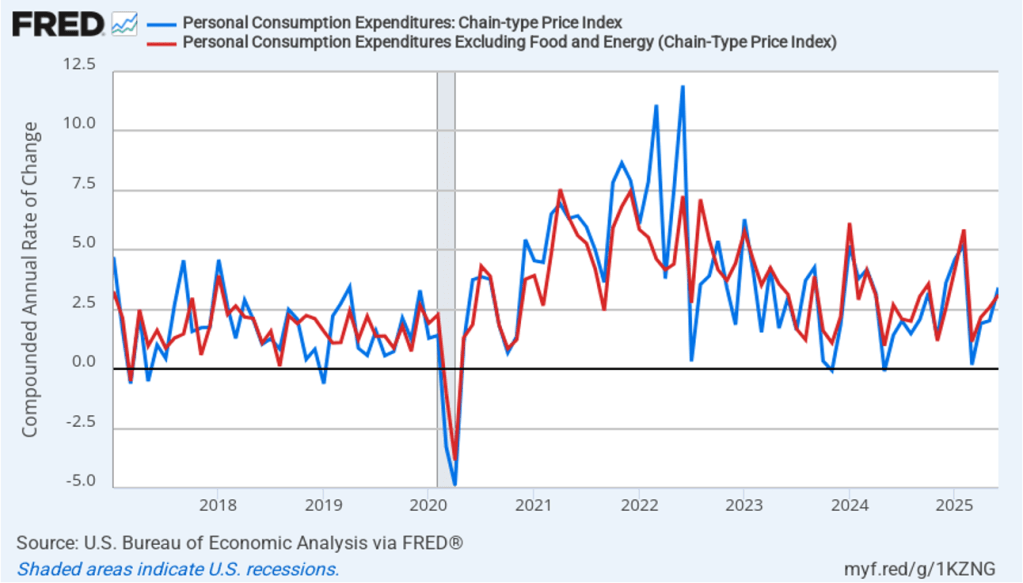
The following figure shows headline PCE inflation and core PCE inflation calculated by compounding the current month’s rate over an entire year. (The figure above shows what is sometimes called 12-month inflation, while this figure shows 1-month inflation.) Measured this way, headline PCE inflation jumped from 2.0 percent in May to 3.4 percent in June. Core PCE inflation increased from 2.6 percent in May to 3.1 percent in June. So, both 1-month PCE inflation estimates are well above the Fed’s 2 percent target. The usual caution applies that 1-month inflation figures are volatile (as can be seen in the figure), so we shouldn’t attempt to draw wider conclusions from one month’s data. In addition, these data likely don’t capture fully the higher prices likely to result from the tariff increases the Trump administration has implemented, including those in trade agreements that have only been announced in the past few days.
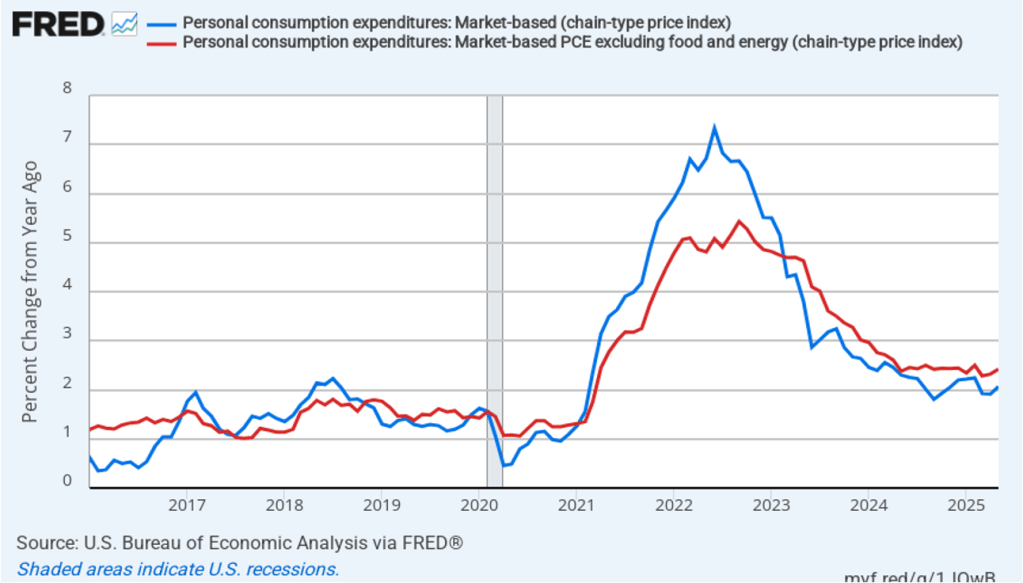
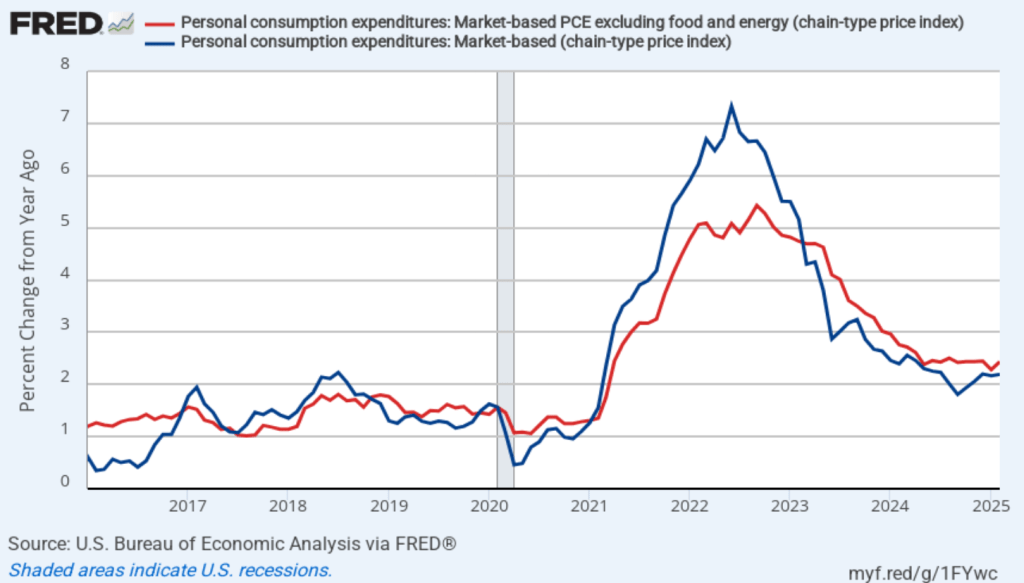
Fed Chair Jerome Powell has frequently noted that inflation in non-market services can skew PCE inflation. Non-market services are services whose prices the BEA imputes rather than measures directly. For instance, the BEA assumes that prices of financial services—such as brokerage fees—vary with the prices of financial assets. So that if stock prices fall, the prices of financial services included in the PCE price index also fall. Powell has argued that these imputed prices “don’t really tell us much about … tightness in the economy. They don’t really reflect that.” The following figure shows 12-month headline inflation (the blue line) and 12-month core inflation (the red line) for market-based PCE. (The BEA explains the market-based PCE measure here.)
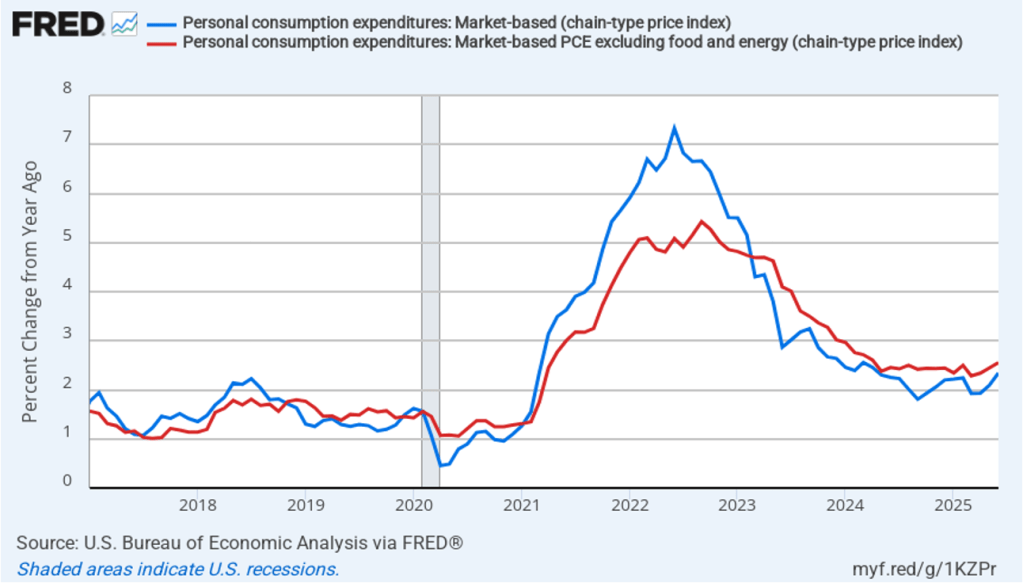
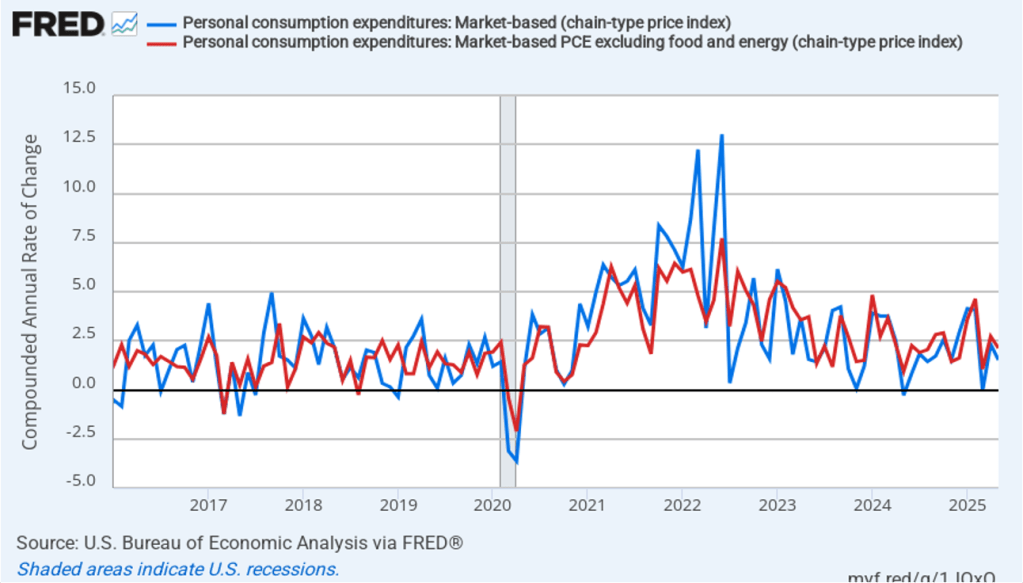
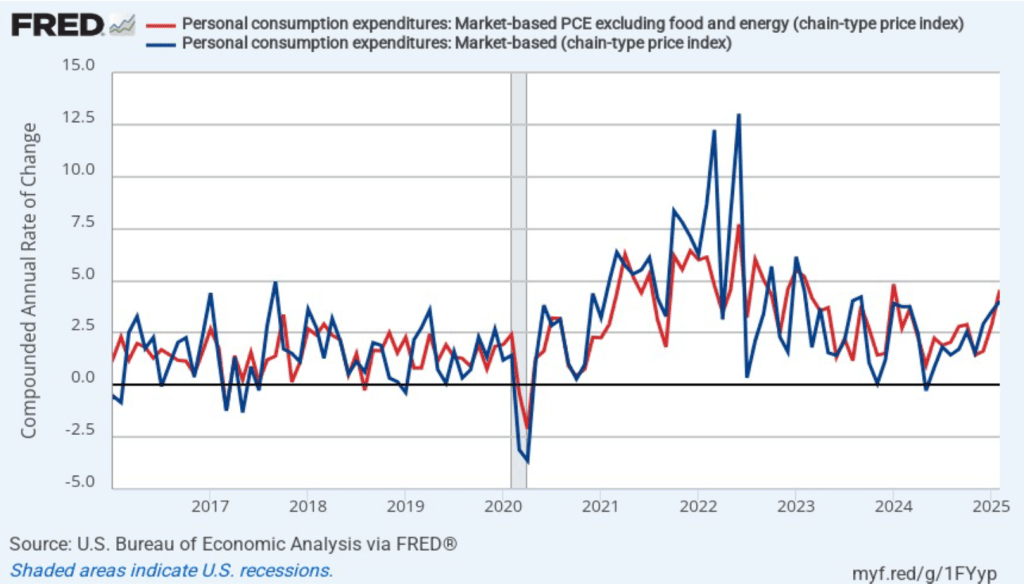
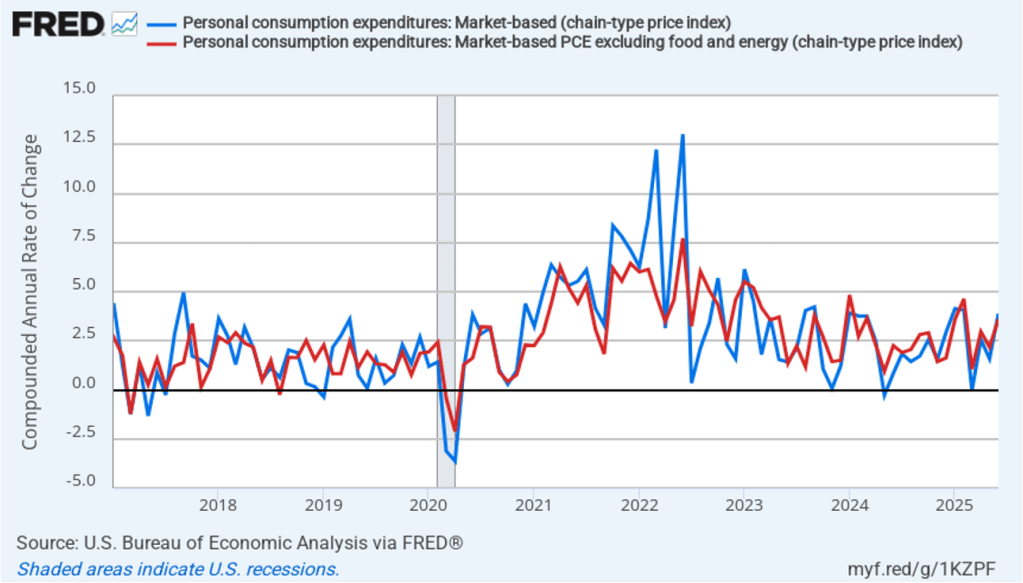
Headline market-based PCE inflation was 2.3 percent in June, up from 2.1 percent in May. Core market-based PCE inflation was 2.6 percent in June, up from 2.4 percent in May. So, both market-based measures show similar rates of inflation in June as the total measures do. In the following figure, we look at 1-month inflation using these measures. The 1-month inflation rates are both higher than the 12-month rates. One-month headline market-based inflation soared to 3.9 percent in June from 1.6 percent in May. One-month core market-based inflation also increased sharply to 3.6 percent in June from 2.2 percent in May. As the figure shows, the 1-month inflation rates are more volatile than the 12-month rates, which is why the Fed relies on the 12-month rates when gauging how close it is coming to hitting its target inflation rate. Still, looking at 1-month inflation gives us a better look at current trends in inflation, which these data indicate is rising significantly.
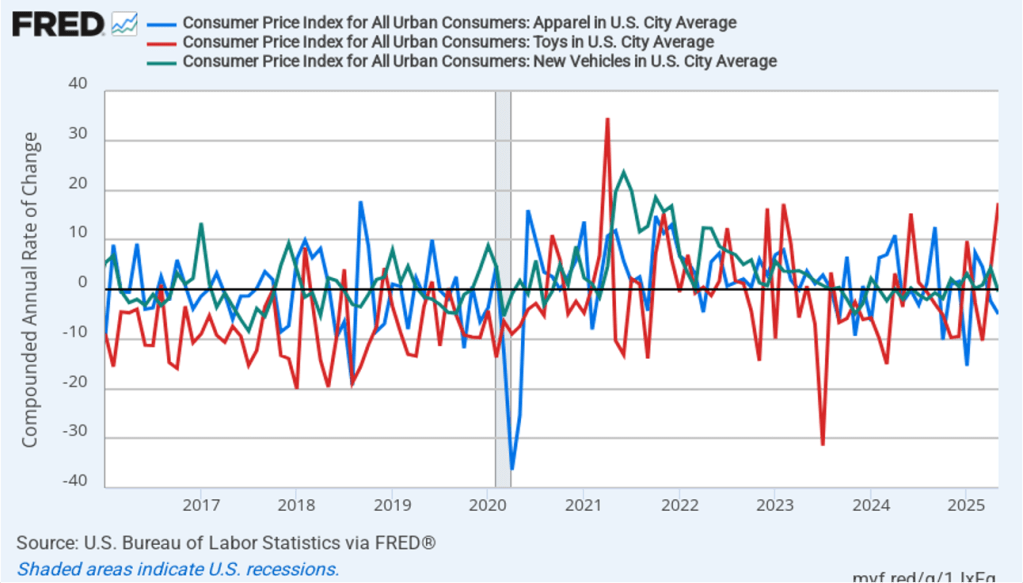
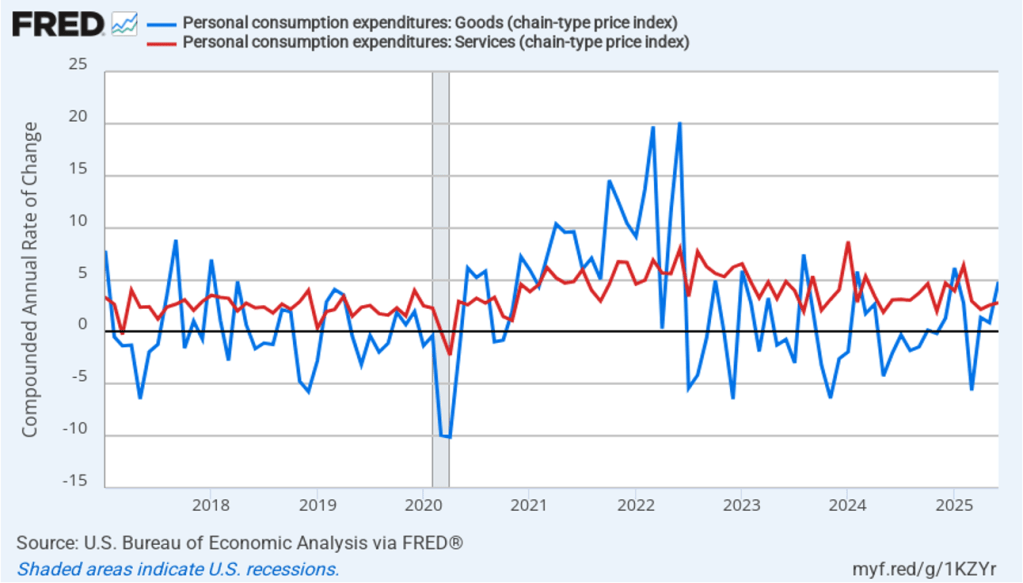
Is the increase in inflation attributable to the effects of tariffs? At this point, it’s too early to tell, particularly since, as noted earlier, all tariff increases have not yet been implemented. We can note, though, that the effect of tariffs are typically seen in goods prices, rather than in service prices because tariffs are levied primarily on imports of goods. As the following figure shows, one-month inflation in goods prices jumped from 0.9 percent in May to 4.8 percent in June, while one-month inflation in services prices increased only from 2.5 percent in May to 2.8 percent in June.
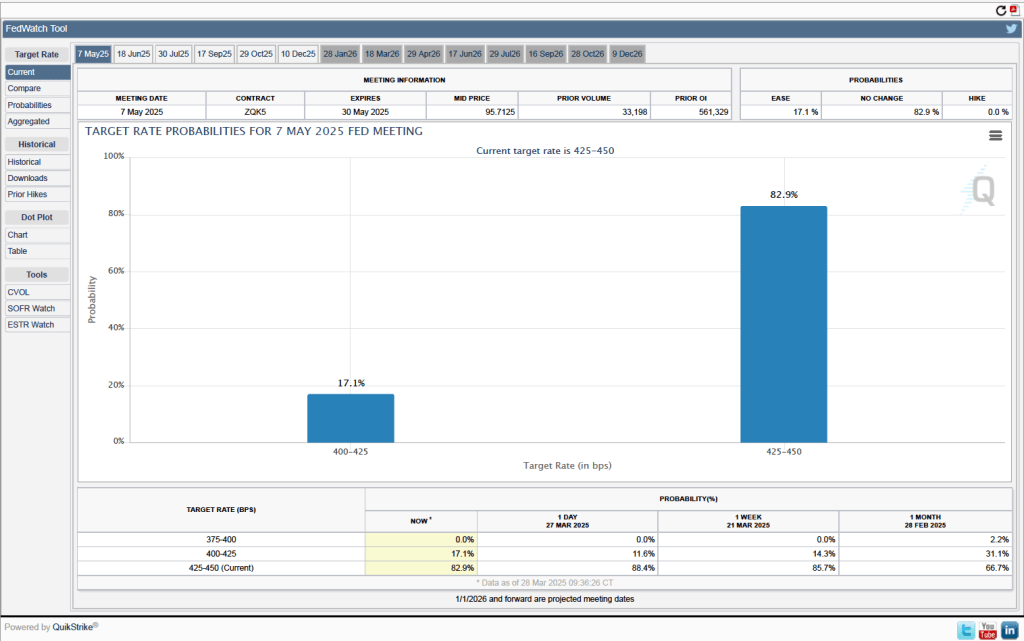
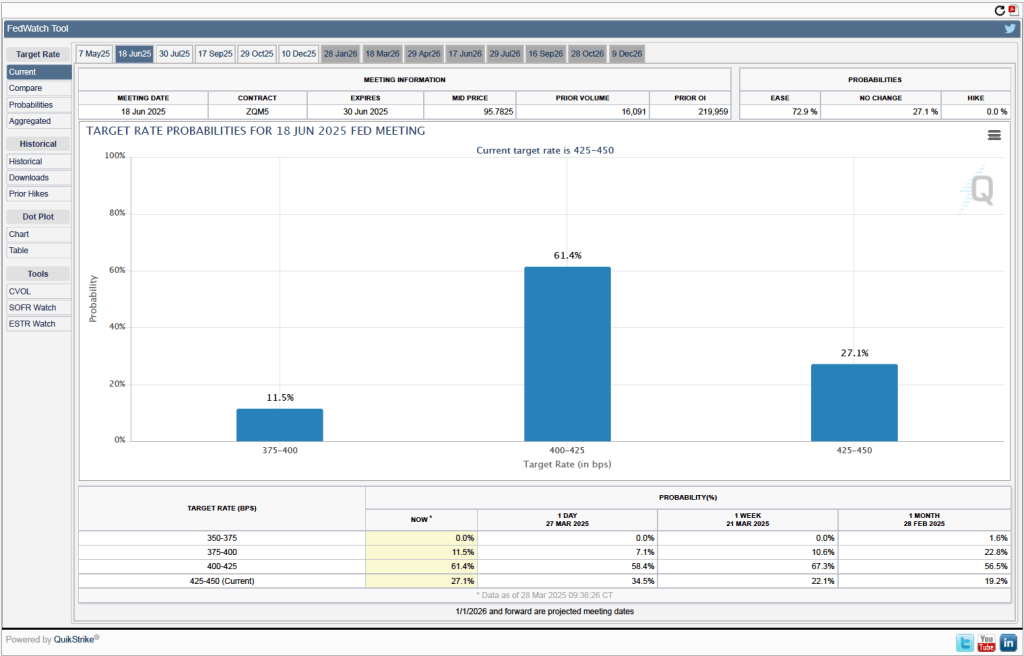
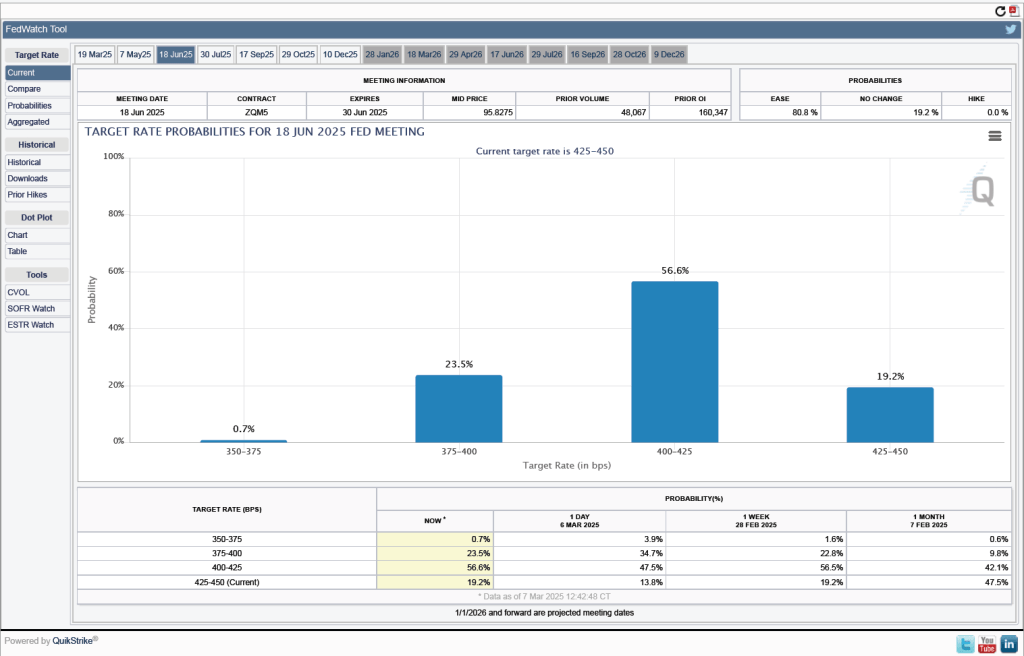
Finally, we noted in a blog post yesterday that investors trading federal funds rate futures assigned a 55.0 percent probability to the Federal Open Market Committee leaving its target for the federal funds rate unchanged at its meeting on September 16–17. With today’s PCE report showing higher than expected inflation, that probability has increased to 60.8 percent.