The Surprising Effect of Weight-Loss Drugs on Monetary Policy in Denmark

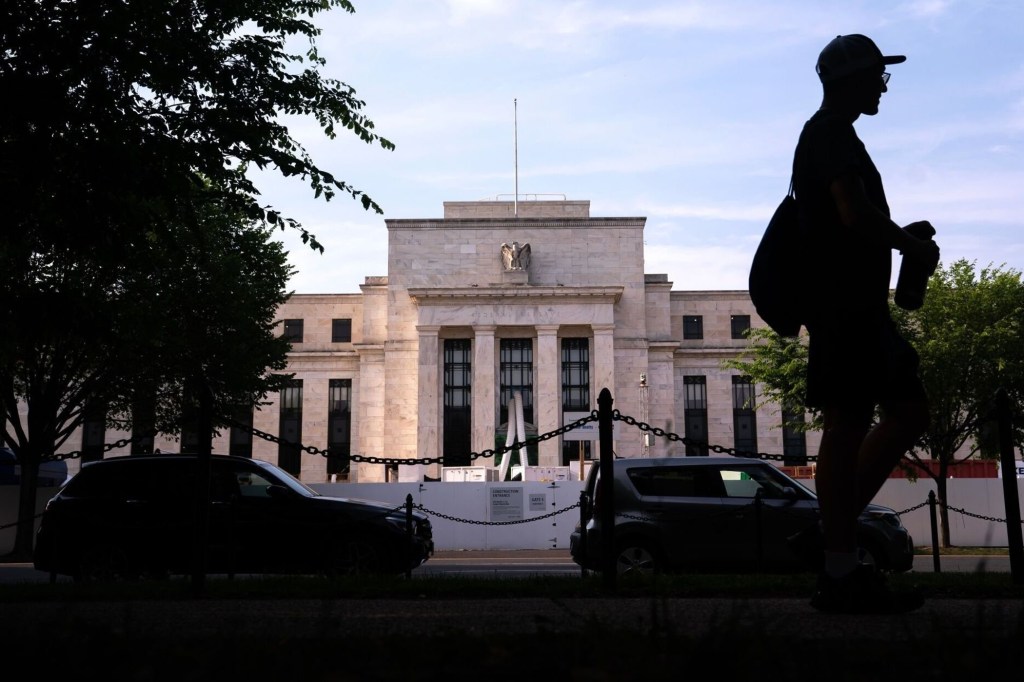
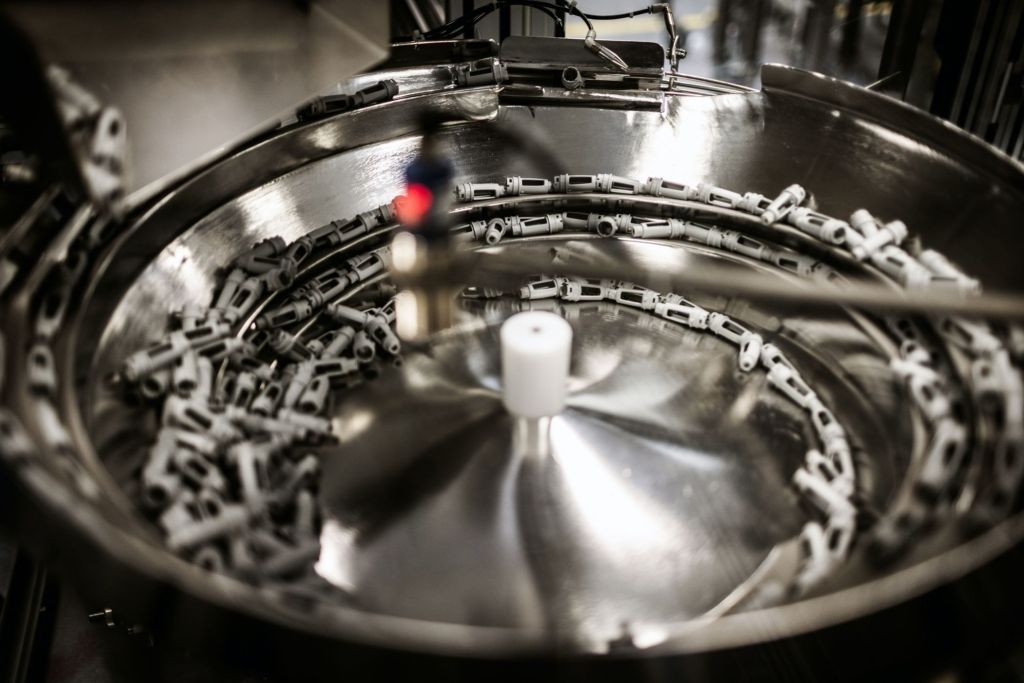
Novo Nordisk production facility in Denmark (Photo from Bloomberg News via the Wall Street Journal.)

Like most other small European countries, imports and exports are more important in the Danish economy than in the U.S. economy.  In 2022, imports were 59 percent of Danish GDP and exports were 70 percent. In contrast, in 2022 imports were only 16 percent of U.S. GDP and exports were only 12 percent.

The Danish company Novo Nordisk makes the weight-loss prescription injections Ozempic and Wegovy. Because these and related pharmaceuticals are the first to result in significant weight loss among patients, demand for them has been very strong. (Note that some researchers believe that is not yet clear whether long-term use of these drugs might have side effects.) Demand has been so strong that Novo Nordisk’s market cap—the total value of its outstanding shares of stock—is now larger than Denmark’s GDP. According to the Wall Street Journal, Novo Nordisk now has the second largest market cap in Europe, behind only luxury good manufacturer LVMH Moët Hennessy Louis Vuitton

Most of Novo Nordisk’s customers are outside of Denmark, so to buy Ozempic or Wegovy, these customers much exchange their domestic currency—for example, euros, U.S. dollars, pounds, or yen—for Danish kroner. This increase in demand, increases the value of kroner relative to dollars, euros, and other currencies. (We discuss the effects of changes in demand and supply of a currency relative other currencies in Macroeconomics, Chapter 18, Section 18.2, Economics, Chapter 28, Section 28.2, and Essentials of Economics, Chapter 19, Section 19.6.)

Denmark has been a member of the European Union (EU), since the EU’s formation in 1991. But it is one of two EU countries (Sweden is the other) that has retained its own currency rather than using the euro. Because most of Denmark’s trade has traditionally been with other countries in the EU, the Danmarks Nationalbank, Denmark’s central bank, has pegged the value of the krone to the euro. Pegging makes it easier for Danish firms to plan because they know the prices their goods and services will sell for in eurozone countries. In addition, Danish firms that borrow in euros know how much in interest they will be paying in kroner. Finally, if the krone rises in value against other currencies, prices of imported goods and services will increase, raising the Danish inflation rate. (We discuss currency pegs in Macroeconomics, Chapter 18, Section 18.3, and Economics, Chapter 28, Section 28.3.) Inflation is a significant concern in Denmark because, as the following figure shows, the inflation rate reached 10.1 percent in October 2022. Although by July 2023, the inflation rate had decline to 3.1 percent, that rate was still above the Nationalbank’s inflation target of 2 percent.

Source: Statistics Denmark, dst.dk.

To keep the the krone pegged against the euro, the Nationalbank has to reduce the demand for the krone. The key tool that a central bank has to reduce demand for its country’s currency is interest rates. If the Nationalbank keeps interest rates in Denmark below interest rates in eurozone countries, investors will demand fewer kroner in exchange for euros. Accordingly, the Nationalbank as kept its key monetary policy rate below the corresponding rate set by the European Central Bank. In August the ECB’s policy rate was 3.75 percent, whereas the Nationalbank’s corresponding policy rate was 3.35 percent.

It’s unusual even for a small country that its central bank has to take steps to respond to a surge in demand for a single product. But that was the situation of the Danish central bank in 2023.

Sources: Joseph Walker, Dominic Chopping, and Sune Engel Rasmussen Wall Street Journal, August 17, 2023; Matthew Fox, “America’s Favorite Weight Loss Drugs Are Impacting Denmark’s Currency and Interest Rates,” finance.yahoo.com, August 18, 2023; Christian Weinberg, “Novo’s Value Surpasses Denmark GDP After Obesity Drug Boost,” bloomberg.com, August 9, 2023; Tom Fairless, “European Central Bank Raises Rates, Says Pausing Is an Option” Wall Street Journal, July 27, 2023; and “Official Interest Rates,” nationalbanken.dk.

The Fortune Magazine Global 500

Photo of a Walmart store from the Associated Press via the Wall Street Journal.

Many people are familiar with Fortune magazine’s list of the 500 largest U.S.-based firms, measured by their revenue in 2022. (Note: It’s easy to confuse the Fortune 500 with the S&P 500. Firms are included in the S&P 500 on the basis of their market capitalization—the value of all of their outstanding shares of stock—rather than on the basis of their revenue. The S&P 500 is used to compute the most widely followed stock market index. See Microeconomics and Economics, Chapter 8, Section 8.2, and Macroeconomics and Essentials of Economics, Chapter 6, Section 6.2.) 

Fortune also compiles a global 500 list, which includes firms based anywhere in the world. The table below shows the top 10 firms on this Fortune list. With more than $600 billion in revenue in 2022, Walmart tops the list. Five of the ten largest firms are in the oil industry. The three firms based in China are owned by the Chinese government. The Saudi government owns more than half of Saudi Aramco. 

FirmIndustryCountry
WalmartRetailingUnited States
Saudi AramcoOilSaudi Arabia
State GridPublic utilityChina
AmazonRetailingUnited States
China National PetroleumOilChina
Sinopec GroupOilChina
Exxon MobilOilUnited States
AppleConsumer electronicsUnited States
ShellOilUnited Kingdom
UnitedHealth GroupHealth insuranceUnited States

The following table shows how many firms among the top 100 are headquartered in the listed countries. All countries that have more than one firm located in them are included. Far more of these large firms are located in the United States and China than in any of the other countries. Germany, Japan, France, and South Korea are the only other countries that are the headquarters for more than two firms.

CountryNumber of firms
United States38
China30
Germany7
Japan5
France4
South Korea3
India2
United Kingdom2
Italy2

The Fortune article can be found here.

Is the U.S. Economy Coming in for a Soft Landing?

The Federal Reserve building in Washington, DC. (Photo from Bloomberg News via the Wall Street Journal.)

The key macroeconomic question of the past two years is whether the Federal Reserve could bring down the high inflation rate without triggering a recession. In this blog post from back in February, we described the three likely macroeconomic outcomes as:

  1. A soft landing—inflation returns to the Fed’s 2 percent target without a recession occurring.
  2. A hard landing—inflation returns to the Fed’s 2 percent target with a recession occurring.
  3. No landing—inflation remains above the Fed’s 2 percent target but no recession occurs.

The following figure shows inflation measured as the percentage change in the personal consumption expenditures (PCE) price index and in the core PCE, which excludes food and energy prices. Recall that the Fed uses inflation as measured by the PCE to determine whether it is hitting its inflation target of 2 percent. Because food and energy prices tend to be volatile, many economists inside and outside of the Fed use the core PCE to better judge the underlying rate of inflation—in other words, the inflation rate likely to persist in at least the near future.

The figure shows that inflation first began to rise above the Fed’s target in March 2021. Most members of the Federal Open Market Committee (FOMC) believed that the inflation was caused by temporary disruptions to supply chains caused by the effects of the Covid–19 pandemic. Accordingly, the FOMC didn’t raise its target for the federal funds from 0 to 0.25 percent until March 2022. Since March 2022, the FOMC has raised its target for the federal funds rate in a series of steps until the target range reached 5.25 to 5.50 percent following the FOMC’s July 26, 2023 meeting.

PCE inflation peaked at 7.0 percent in June 2022 and had fallen to 2.9 percent in June 2023. Core PCE had a lower and earlier peak of 5.4 percent in February 2023, but had experienced a smaller decline—to 4.1 percent in June 2023. Inflation as measured by the consumer price index (CPI) followed a similar pattern, as shown in the following figure. Inflation measured by core CPI reached a lower peak than did inflation measured by the CPI and declined by less through June 2023.

As inflation has been falling since mid-2022, , the unemployment rate has remained low and the employment-population ratio for prime-age workers (workers aged 25 to 54) has risen above its 2019 pre-pandemic peak, as the following two figures show.

So, the Fed seems to be well on its way to achieving a soft landing. But in the press conference following the July 26 FOMC meeting Chair Jerome Powell was cautious in summarizing the inflation situation:

“Inflation has moderated somewhat since the middle of last year. Nonetheless, the process of getting inflation back down to 2 percent has a long way to go. Despite elevated inflation, longer-term inflation expectations appear to remain well anchored, as reflected in a broad range of surveys of households, businesses, and forecasters, as well as measures from financial markets.”

By “longer-term expectations appear to remain well anchored,” Powell was referring to the fact that households, firms, and investors appear to be expecting that the inflation rate will decline over the following year to the Fed’s 2 percent target.

Those economists who still believe that there is a good chance of a recession occuring during the next year have tended to focus on the following three points:

1. As shown in the following two figures, the labor market remains tight, with wage increases remaining high—although slowing in recent months—and the ratio of job openings to the number of unemployed workers remaining at historic levels—although that ratio has also been declining in recent months. If the labor market remains very tight, wages may continue to rise at a rate that isn’t consistent with 2 percent inflation. In that case, the FOMC may have to persist in raising its target for the federal funds rate, increasing the chances for a recession.

2. The lagged effect of the Fed’s contractionary monetary policy over the past year—increases in the target for the federal funds rate and quantitative tightening (allowing the Fed’s holdings of Treasury securites and mortgage-backed securities to decline; a process of quantitative tightening (QT))—may have a significant negative effect on the growth of aggegate demand in the coming months. Economists disagree on the extent to which monetary policy has lagged effects on the economy. Some economists believe that lags in policy have been significantly reduced in recent years, while other economists believe the lags are still substantial. The lagged effects of monetary policy, if sufficiently large, may be enough to push the economy into a recession.

3. The economies of key trading partners, including the European Union, the United Kingdom, China, and Japan are either growing more slowly than in the previous year or are in recession. The result could be a decline in net exports, which have been contributing to the growth of aggregate demand since early 2021.

In summary, we can say that in early August 2023, the probability of the Fed bringing off a soft landing has increased compared with the situation in mid-2022 or even at the beginning of 2023. But problems can still arise before the plane is safely on the ground.

Glenn on Bank Regulation

(Photo from the Wall Street Journal.)

This opinion column first appeared on barrons.com. It is also on the web site of the American Enterprise Institute.

Runs at Silicon Valley Bank and others emerged quickly and drove steep losses in regional bank equity values. Regulators shouldn’t have been caught by surprise, but at least they should take lessons from the shock. The subsequent ad hoc fixes to deposit insurance and assurances that the banking system is sufficiently well-capitalized don’t yet suggest a serious policy focus on those lessons. Calls for much higher levels of bank capital and tighter financial regulation notwithstanding, deeper questions about bank regulation merit greater attention.

Runs are a feature of banking. Banks transform short-term, liquid (even demandable) deposits into longer-term, sometimes much less liquid assets. Bank capital offers a partial buffer against the risk of a run, though a large-scale dash for cash can topple almost any institution, as converting blocks of assets to cash quickly to satisfy deposit withdrawals is almost sure to bring losses. The likelihood of a run goes up with bad news or rumors about the bank and correlation among depositors’ on their demand for funds back. That’s what happened at Silicon Valley Bank. Think also George Bailey’s impassioned speech in the classic movie It’s a Wonderful Life, explaining how maturity and liquidity transformations can unravel, with costs to depositors, bankers, and credit reductions to local businesses and households. The bank examiner in the movie, eager to get home, didn’t see it coming.

While bank runs and banking crises can be hard to predict, a simple maxim can guide regulation and supervision: Increase scrutiny in areas and institutions in which significant changes are occurring over a short period. On an aggregate level, the sharp, rapid increase in the federal funds rate since March 2022 should have focused attention on asset values and interest rate risks. So, too, should the fast potential compression in values of office real estate in many locations as a consequence of pandemic-related working shifts and rate hikes. At the bank level, significant inflows of deposits—particularly uninsured deposits—merit closer risk review. This approach isn’t limited to banking. A recent report of the Brookings-Chicago Booth Task Force on Financial Stability, co-chaired by Donald Kohn and me, put forth a similar change-based approach to scrutiny of nonbank financial institutions.

Such an approach would have magnified supervisory attention to Silicon Valley Bank and First Republic Bank . It also suggests the desirability of greater scrutiny and stress testing of midsize banks generally facing interest rate and commercial real estate risk. Those stress tests can give the Fed and the Federal Deposit Insurance Corp. an indication of capital adequacy concerns that could give rise to mergers or bank closures.

Even with this enhanced regulatory and supervisory attention, two major questions remain: For bank liabilities, what role should deposit insurance play in forestalling costly runs? For bank assets, what role should banks play in commercial lending?

Actions taken since Silicon Valley Bank’s collapse have effectively increased deposit-insurance guarantees for troubled institutions. But the absence of a clearer policy framework for dealing with uninsured deposits dragged out the unwinding of First Republic Bank and threatens other institutions experiencing rapid deposit increases and interest rate risk. When regulators asserted in the wake of the runs that the status quo of a $250,000 limit remained unchanged, they lacked both credibility and a means to reduce uncertainty about future policy actions in a run. That makes runs at vulnerable institutions both more likely and more severe. One reform would be to increase deposit insurance limits for transaction accounts of households and small and midsize firms, as recently proposed by the FDIC. Of course, even this reform raises concerns about implementation, how to price the enhanced coverage, and whether supervision will shift toward the “focus on the changes” framework I outlined earlier.

Retaining a more modest role for deposit insurance raises a larger question: What role should banks play in business lending for working capital, investment, and commercial real estate? The FDIC is mandated to resolve bank failures at the least cost to the deposit-insurance fund, but following that path may lead to more mergers of vulnerable institutions into the nations’ largest banks. While consolidation may mitigate risks for depositors with greater diversification of deposits, it leaves open effects on the mix of lending. Knowing local borrowers better, small and midsize banks have a prominent local lending presence in commercial and industrial loans and real estate. Whether such projects would be financed in a similar mix by local branches of megabanks is a question. Congress should consider whether other alternatives might be reasonable. It might permit consolidation among smaller institutions, even if more costly in resolution in the near term to taxpayers. Or nonbank institutions could be permitted to play a role in resolving troubled banks. The latter mechanism should be considered, as nonbank asset managers like Blackstone or BlackRock could fund loans originated by local banks.

Two lessons for regulation loom large. The first is that attention should be paid to policy risk management as well as bank risk management in identifying areas of concern. Think easy money and the reach for yield, inflationary fiscal and monetary policy during the pandemic, and the Fed’s rapid-fire increase in short-term rates to combat stubborn inflation. Second, regulators and Congress need to be wary of both too much deposit insurance (with likely increased risk-taking and pressure on supervision) and too little deposit insurance (with likely jumps in banking concentration and disruption of local credit to businesses).

One can reasonably anticipate additional erosion of capital in non-money-center banks from rising interest rates and lower office real estate collateral values, hopefully motivating a quick grasp of these lessons. While banks don’t have to mark assets to market if current and can survive turbulence until monetary policy eases, potential runs can upset this equilibrium. Declining regional bank stock prices make this risk clear. Only good fortune or a more thoughtful policy stand in the way of additional bank distress and attendant credit supply reductions.

Unraveling the Mysteries of the May 2023 Employment Situation Report

(Photo from the Associated Press via the Wall Street Journal.)

During most periods, the “Employment Situation” report that the Bureau of Labor Statistics issues on the first Friday of each month includes the most closely watched macroeconomic data. Since the spring of 2021, high inflation rates have made the BLS’s “Consumer Price Index Summary” at least a close second in interest to the employment report. The data in the CPI report is usually more readily comprehensible than the data in the employment report. So, we think it’s worth class time to go into some of the details of the employment report, as we do in Macroeconomics, Chapter 9, Section 9.1, Economics, Chapter 19, Section 19.1, and Essentials of Economics, Chapter 13, Section 13.1.

When the BLS released the May employment report, the Wall Street Journal noted that: “Employers added 339,000 jobs last month; unemployment rate rose to 3.7%.” Employment increased … but the unemployment rate also rose? How is that possible? One key to understanding media accounts of the report is to note that the report contains data from two separate surveys: 1) the household survey and 2) the employment or establishment survey. As in the statement just quoted from the Wall Street Journal, media accounts often mix data from the two surveys.  

The data showing an increase of 339,000 jobs in May are from the payroll survey, while the data showing that the unemployment rate rose are from the household survey. Below we reproduce part of the relevant table from the report showing some of the data from the household survey. Note that total employment in the household survey falls by 310,000, so there appears to be no contradiction to explain—the unemployment rate increased because the number of people employed fell and the number of people unemployed rose. But why, then, did employment rise in the payroll survey?

Employment can rise in one survey and fall in the other because: 1) the types of employment measured in the two series differ, 2) the periods during which the data are collected differ, and 3) because of measurement error. The household survey uses a broader measure of employment that includes several categories of workers who are not included in the payroll survey: agricultural workers, self-employed workers, unpaid workers in family businesses, workers employed in private households rather than in businsses, and workers on unpaid leave from their jobs. In addition, the payroll employment numbers are revised—sometimes substantially—as additional data are collected from firms, while the household employment numbers are subject to much smaller revisions because data in the household survey are collected during a single week. A detailed discussion of the differences between the employment measures in the two series can be found here.

Usefully, the BLS publishes a series labeled “Adjusted employment” that estimates what the value for household employment would be if the household survey was measuring the same categories of employment as the payroll survey. In this case, the adjusted employment series shows an increase in employment in May of 394,000—close to the payroll survey’s increase of 339,000.

To summarize, the May employment report indicates that payroll employment increased, while the non-payroll categories of household employment declined, and the unemployment rate rose. Note also in the table above that the number of people counted as not being in labor force rose slightly and the employment-population ratio fell slightly. Average weekly hours (not shown in the table above) decreased slightly from 34.4 hours per week to 34.3.

A reasonable conclusion from the report is that the labor market remains strong, although it may have weakened slightly. Prior to release of the report, there was much speculation in the business press about how the report might affect the deliberations of the Federal Reserve’s Federal Open Market Committe (FOMC) at its next meeting to be held on June 13th and 14th. The report showed stronger employment growth than economists surveyed by Dow Jones had expected, indicating that the FOMC was likely to remain concerned that a tight labor market might continue to put upward pressure on wages, which firms could pass through to higher prices. Members of the FOMC had been signalling that they were likely to keep their target for the federal funds rate unchanged in June. The reported employment increase was likely not large enough to cause the FOMC to change course.

The Fed Continues to Walk a Tightrope

Photo from the Associated Press of Fed Chair Jerome Powell at a news conference

At its Wednesday, May 3, 2023 meeting, the Federal Open Market Committee (FOMC) raised its target for the federal funds rate by 0.25 percentage point to a range of 5.00 to 5.25.  The decision by the committee’s 11 voting members was unanimous. After each meeting, the FOMC releases a statement (the statement for this meeting can be found here) explaining its reasons for its actions at the meeting. 

The statement for this meeting had a key change from the statement the committee issued after its last meeting on March 22. The previous statement (found here) included this sentence:

“The Committee anticipates that some additional policy firming may be appropriate in order to attain a stance of monetary policy that is sufficiently restrictive to return inflation to 2 percent over time.”

In the statement for this meeting, the committee rewrote that sentence to read:

“In determining the extent to which additional policy firming may be appropriate to return inflation to 2 percent over time, the Committee will take into account the cumulative tightening of monetary policy, the lags with which monetary policy affects economic activity and inflation, and economic and financial developments.”

This change indicates that the FOMC has stopped—or at least suspended—use of forward guidance.  As we explain in Money, Banking, and the Financial System, Chapter 15, Section 5.2, forward guidance refers to statements by the FOMC about how it will conduct monetary policy in the future.

After the March meeting, the committee was providing investors, firms, and households with the forward guidance that it intended to continue raising its target for the federal funds rate—which is what the reference to “additional policy firming” means. The statement after the May meeting indicated that the committee was no longer giving guidance about future changes in its target for the federal funds rate other than to state that it would depend on the future state of the economy.  In other words, the committee was indicating that it might not raise its target for the federal funds rate after its next meeting on June 14. The committee didn’t indicate directly that it was pausing further increases in the federal funds rate but indicated that pausing further increases was a possible outcome.

Following the end of the meeting, Fed Chair Jerome Powell conducted a press conference. Although not yet available when this post was written, a transcript will be posted to the Fed’s website here. Powell made the following points in response to questions:

  1.  He was not willing to move beyond the formal statement to indicate that the committee would pause further rate increases. 
  2. He believed that the bank runs that had led to the closure and sale of Silicon Valley Bank, Signature Bank, and First Republic Bank were likely to be over.  He didn’t believe that other regional banks were likely to experience runs. He indicated that the Fed needed to adjust its regulatory and supervisory actions to help ensure that similar runs didn’t happen in the future.
  3. He repeated that he believed that the Fed could achieve its target inflation rate of 2 percent without the U.S. economy experiencing a recession. In other words, he believed that a soft landing was still possible. He acknowledged that some other members of the committee and the committee’s staff economist disagreed with him and expected a mild recession to occur later this year.
  4. He stated that as banks have attempted to become more liquid following the failure of the three regional banks, they have reduced the volume of loans they are making. This credit contraction has an effect on the economy similar to that of an increase in the federal funds rate in that increases in the target for the federal funds rate are also intended to reduce demand for goods, such as housing and business fixed investment, that depend on borrowing. He noted that both those sectors had been contracting in recent months, slowing the economy and potentially reducing the inflation rate.
  5. He indicated that although inflation had declined somewhat during the past year, it was still well above the Fed’s target. He mentioned that wage increases were still higher than is consistent with an inflation rate of 2 percent. In response to a question, he indicated that if the inflation rate were to fall from current rates above 4 percent to 3 percent, the FOMC would not be satisfied to accept that rate. In other words, the FOMC still had a firm target rate of 2 percent.

In summary, the FOMC finds itself in the same situation it has been in since it began raising its target for the federal funds rate in March 2022: Trying to bring high inflation rates back down to its 2 percent target without causing the U.S. economy to experience a significant recession. 

4/29/23 Podcast – Authors Glenn Hubbard & Tony O’Brien discuss a hard vs. soft landing, the debt ceiling, and an economics view of the CHIPS act passed in 2022.

Join authors Glenn Hubbard & Tony O’Brien as they discuss the state of the landing the economy will achieve – hard vs. soft – or “no landing”. Also, they address the debt ceiling and the barriers it might present to a recovery. We also delve into the Chips Act and what economics has to say about the subsidy of a particular industry. Gain insights into today’s economy through our final podcast of the 2022-2023 academic year! Our discussion covers these points but you can also check for updates on our blog post that can be found HERE .

Is a Soft Landing More Likely Now?

Photo from the Wall Street Journal.

The Federal Reserve’s goal has been to end the current period of high inflation by bringing the economy in for a soft landing—reducing the inflation rate to closer to the Fed’s 2 percent target while avoiding a recession. Although Fed Chair Jerome Powell has said repeatedly during the last year that he expected the Fed would achieve a soft landing, many economists have been much more doubtful.

It’s possible to read recent economic data as indicating that it’s more likely that the economy is approaching a soft landing, but there is clearly still a great deal of uncertainty. On April 12, the Bureau of Labor Statistics released the latest CPI data. The figure below shows the inflation rate as measured by the CPI (blue line) and by core CPI—which excludes the prices of food and fuel (red line). In both cases the inflation rate is the percentage change from the same month in the previous year. 

The inflation rate as measured by the CPI has been trending down since it hit a peak of 8.9 percent in June 2022. The inflation rate as measured by core CPI has been trending down more gradually since it reached a peak of 6.6 percent in September 2022. In March, it was up slightly to 5.6 percent from 5.5 percent in February.

As the following figure shows, payroll employment while still increasing, has been increasing more slowly during the past three months—bearing in mind that the payroll employment data are often subject to substantial revisions. The slowing growth in payroll employment is what we would expect with a slowing economy. The goal of the Fed in slowing the economy is, of course, to bring down the inflation rate. That payroll employment is still growing indicates that the economy is likely not yet in a recession.

The slowing in employment growth has been matched by slowing wage growth, as measured by the percentage change in average hourly earnings. As the following figure shows, the rate of increase in average hourly earnings has declined from 5.9 percent in March 2022 to 4.2 percent in March 2023. This decline indicates that businesses are experiencing somewhat lower increases in their labor costs, which may pass through to lower increases in prices.

Credit conditions also indicate a slowing economy As the following figure shows, bank lending to businesses and consumers has declined sharply, partly because banks have experienced an outflow of deposits following the failure of Silicon Valley and Signature Banks and partly because some banks have raised their requirements for households and firms to qualify for loans in anticipation of the economy slowing. In a slowing economy, households and firms are more likely to default on loans. To the extent that consumers and businesses also anticipate the possibility of a recession, they may have reduced their demand for loans.

But such a sharp decline in bank lending may also be an indication that the economy is not just slowing, on its way to a making a soft landing, but is on the verge of a recession. The minutes of the March meeting of the Federal Open Market Committee (FOMC) included the information that the FOMC’s staff economists forceast “at the time of the March meeting included a mild recession starting later this year, with a recovery over the subsequent two years.” (The minutes can be found here.) The increased chance of a recession was attributed largely to “banking and financial conditions.”

At its next meeting in May, the FOMC will have to decide whether to once more increase its target range for the federal funds rate. The target range is currently 4.75 percent to 5.00 percent. The FOMC will have to decide whether inflation is on a course to fall back to the Fed’s 2 percent target or whether the FOMC needs to further slow the economy by increasing its target range for the federal funds rate. One factor likely to be considered by the FOMC is, as the following figure shows, the sharp difference between the inflation rate in prices of goods (blue line) and the inflation rate in prices of services (red line).

During the period from January 2021 to November 2022, inflation in goods was higher—often much higher—than inflation in services. The high rates of inflation in goods were partly the result of disruptions to supply chains resulting from the Covid-19 pandemic and partly due to a surge in demand for goods as a result of very expansionary fiscal and monetary policies. Since November 2022, inflation in the prices of services has remained high, while inflation in the prices of goods has continued to decline. In March, goods inflation was only 1.6 percent, while services inflation was 7.2 percent. In his press conference following the last FOMC meeting, Fed Chair Jerome Powell stated that as long as services inflation remains high “it would be very premature to declare victory [over inflation] or to think that we’ve really got this.” (The transcript of Powell’s news conference can be found here.) This statement coupled with the latest data on service inflation would seem to indicate that Powell will be in favor of another 0.25 percentage point increase in the federal funds rate target range.

The Fed’s inflation target is stated in terms of the personal consumption expenditure (PCE) price index, not the CPI. The Bureau of Economic Analysis will release the March PCE on April 28, before the next FOMC meeting. If the Fed is as closely divided as it appears to be over whether additional increases in the federal funds rate target range are necessary, the latest PCE data may prove to have a significan effect on their decision.

So—as usual!—the macroeconomic picture is murky. The economy appears to be slowing and inflation seems to be declining but it’s still difficult to determine whether the Fed will be able to bring inflation back to its 2 percent target without causing a recession.

4/8/23 Podcast – Authors Glenn Hubbard & Tony O’Brien discuss the role of small banks in the US financial system in the wake of the recent bank failures.

Join authors Glenn Hubbard and Tony O’Brien as they discuss the future of small banks in the US financial system in the wake of recent bank failures. With a government that is guaranteeing just about all deposits, what is the role of deposit insurance. Small banks serve a real purpose in our economy and will further government regularly only complicate their mission. Other small business rely on small banks for their intimate knowledge of their market and of their business. However, many may now rely on larger banks that may seem a safer place over the next few years. Our discussion covers these points but you can also check for updates on our blog post that can be found HERE .

New York Fed Economists Analyze the Decline in the Labor Force Participation Rate

The ability of any economy to produce goods and services depends partly on the number of people working in the economy. The number of people working depends on the size of the population and the fraction of the population that is working. As we discuss in Macroeconomics, Chapter 9, Section 9.1 (Economics, Chapter 19, Section 9.1), the labor force participation rate (LFPR) is the fraction of the working-age population in the labor force. (Technically, the “working-age population” is the civilian, non-institutional population age 16 and older.)

The figure above shows the values of the LFPR from January 1948 through February 2023. The steady increase in the LFPR beginning in the late 1960s and lasting until 2000 was caused by an increase in the number of women working outside of the home and the effects of the baby boom–the increase in birth rates between 1946 and 1964–which led to a decline in the average age of the U.S. population. The LFPR reached a peak of 67.3 percent in early 2000. The gradual decline in the following years reflects the aging of the population as birth rates fell and a small decline in the fraction of prime-age workers–those between ages 25 and 54–in the labor force.

The start of the Covid-19 pandemic in the United States in March 2020 led to an abrupt decline in the LFPR followed by a gradual recovery. In February 2020, the LFPR was 63.3 percent. In February 2023, it was 62.5 percent. The difference means that about 2.1 million fewer people were working in February 2023 than would have been working if the LFPR had regained its February 2020 level.

What explains the LFPR not regaining is pre-Covid level? The following figure shows that in February 2023, the LFPR for prime-age workers had reached its February 2020 level. The implication of the figure is that the decline in the LFPR for the whole working-age population is due to a decline in labor force participation by non-prime-age workers.

This conclusion is confirmed by the analys of economists Mary Amiti, Sebastian Heise, Giorgio Topa, and Julia Wu of the Federal Reserve Bank of New York. (Their paper can be found here.) They consider three possible explanations for the decline in the overall LFPR:

  1. The aging of the U.S. population
  2. An increase in fraction of people in different age groups who have retired
  3. An increase in the fraction of the population that is disabled, as result of suffering from “long Covid” or for other reasons

After analyzing the data they find that an increase in retirement rates (explanation 2), particularly for older people, has had only a small effect on LFPR. They find that “Once we adjust for aging, we find that the share of disabled individuals not in the labor force has, in fact, marginally declined.” So explanation 3 is not the key to the decline in the LFPR. They conclude that 1 is the most likely explanation: “Removing the effect of aging can explain the entire participation gap ….” The figure below summarizes their results. The gold line shows that if the United States had the same age structure in February 2023 as it had in February 2020 (that is, if the average age of the working population were lower, with fewer people older than 65), the LFPR would not have declined.