Image of the White House generated by ChatGPT
Note: In this opinion column, Glenn discusses issues—including the U.S. current account deficit, the role of the U.S. dollar in the international financial system, and the effect of the exchange value of the dollar on the U.S. economy—covered in Macroeconomics, Chapter 18 (Economics, Chapter 28).
This opinion column first appeared in Project Syndicate.
The Policy Pivot Trump Needs
US President Donald Trump’s administration believes that the dollar’s reserve-currency status has tilted the global playing field against America and undermined the country’s competitiveness. While wrong about the dollar, the White House is right about an issue that economists—who, unlike voters, abstract from the exchange rate’s distributional effects—often ignore. As November’s midterm elections approach, the administration needs a policy pivot if it is to meet its rebalancing goals and strengthen the US economy.
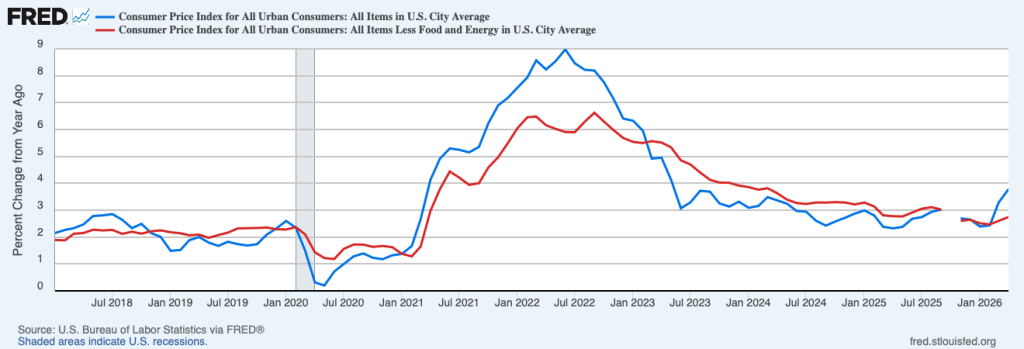
To be sure, the dollar’s global role, all else being equal, increases its value but also leaves the United States running larger current-account deficits than it would otherwise. But focusing solely on a reserve currency’s challenges overlooks its benefits and, importantly, the non-tariff policy tools that can address domestic spillovers—the impetus for Trump’s “Liberation Day” tariffs, which aimed to rein in imports and promote exports.
Economists have responded to the Trump administration’s concerns about US Federal Reserve swap lines with foreign central banks by arguing that they are a feature, not a bug, of the dollar’s position, which requires the US to supply greenbacks when needed. They have also pointed out that while current-account deficits may be associated with a strong dollar, the US has had large trade imbalances, with the attendant fretting, even when the greenback’s foreign-exchange value has been relatively low.
Instead, economists emphasize the dollar’s “exorbitant privilege,” including lower borrowing costs and the ability to impose financial sanctions on geopolitical adversaries. Moreover, they counter that tariffs are not an effective response to the dollar’s impact on US exports because they raise domestic manufacturing costs (roughly half of US imports are intermediate goods) and do not reduce the macro imbalances driving the overall trade deficit.
These arguments are correct, but also incomplete. In fact, Trump’s concerns reflect a crucial political-economy question: the distributional implications of dollar dominance.
To see why, consider Robert E. Rubin’s tenure as US Treasury Secretary in the Clinton administration. His mantra was that “a strong dollar is good for America.” He could have been referring to the features of the US economy that underpin the dollar’s status, such as institutional and policy stability and deep financial markets. Whatever the exact meaning, his stance reflected the prevailing view on Wall Street, which benefited from the stronger dollar implied by reserve-currency status.
But for all the benefits that accrue to financiers and consumers, a stronger dollar makes it harder for US industry to compete globally, to the detriment of industrial employment, incomes, and communities. Trump’s position is thus reminiscent of the political tug-of-war in 1925 in the UK over returning pound sterling to its pre-World War I exchange rate under the gold standard. Despite supporting financial interests and the stronger pound, then-Chancellor of the Exchequer Winston Churchill said: “I would rather see finance less proud and industry more content.”
Trump’s economic agenda recognizes the adverse effects of globalization and technological advances on certain parts of American society, in contrast to economists’ emphasis on averages and overall benefits. But Trump misses the simple insight that there are more—and better—ways to help US manufacturing and its left-behind workers than through a weaker dollar alone. He has several policy instruments at his disposal that can address these voters’ concerns and help achieve his administration’s goals while preserving support for the dollar’s reserve-currency role.
For starters, the administration can support a robust industrial sector by increasing public funding for basic research, which advances technology, and a network of applied research centers to diffuse advances in industrial processes. Streamlining regulatory approvals for construction and electricity transmission will also be crucial.
Second, to help workers develop new skills, the administration could channel more resources toward community colleges, while a substantially expanded Earned Income Tax Credit would increase rewards for work. Lastly, more targeted place-based aid could help those areas facing severe disruptions from globalization and technology.
By focusing on the problems associated with a stronger dollar, Trump and his economic advisers have asked an old question in a new way. Their mistake is insisting on answering it with the wrong instrument. Weakening the dollar, including by eroding policy predictability and the economic institutions underpinning its hegemony, will exacerbate the affordability pressures many Americans face and harm the country’s fiscal position. The question now is whether the administration will see the need for a policy pivot in time to affect the midterms.