

Image created by ChatGPT
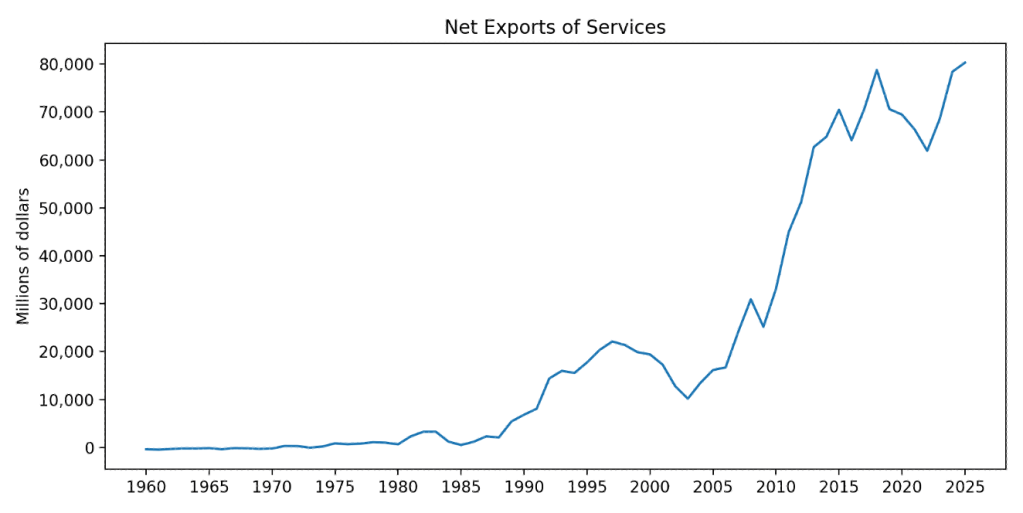
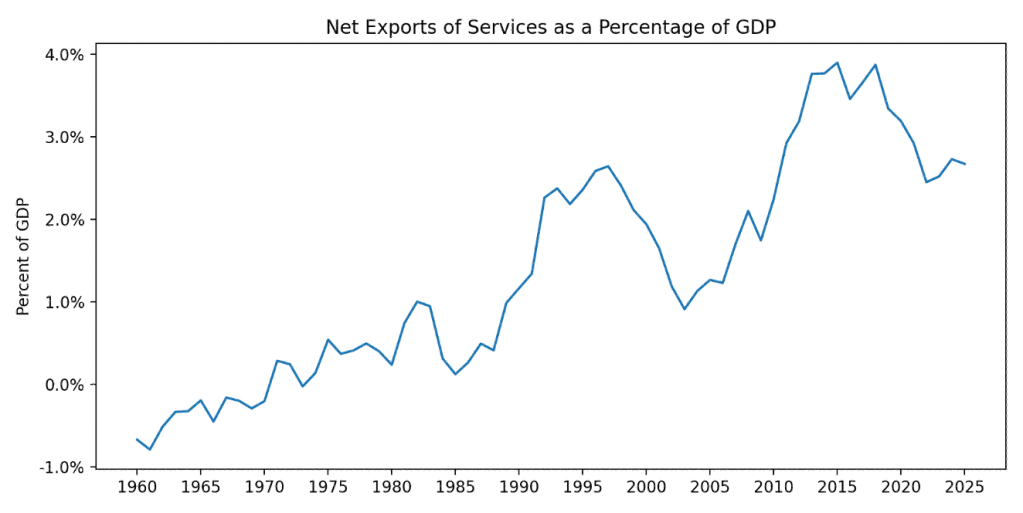
A recent post on the blog of the Federal Reserve Bank of St. Louis reminds us that although the media and some policymakers tend to focus on the fact that the United States typically runs a deficit in trade in goods, it also typically runs a surplus in trade in services. We discuss these points in Economics, Chapter 9, Section 9.1 and Chapter 28, Section 28.1 (Macroeconomics, Chapter 7, Section 7.1 and Chapter 18, Section 18.1, and Microeconomics, Section 9.1). The first of the following figures shows U.S. net exports in services in dollar terms for the period from the first quarter of 1960 through the second quarter of 2025. The second figure show U.S. net exports in services as a percentage of U.S. GDP.
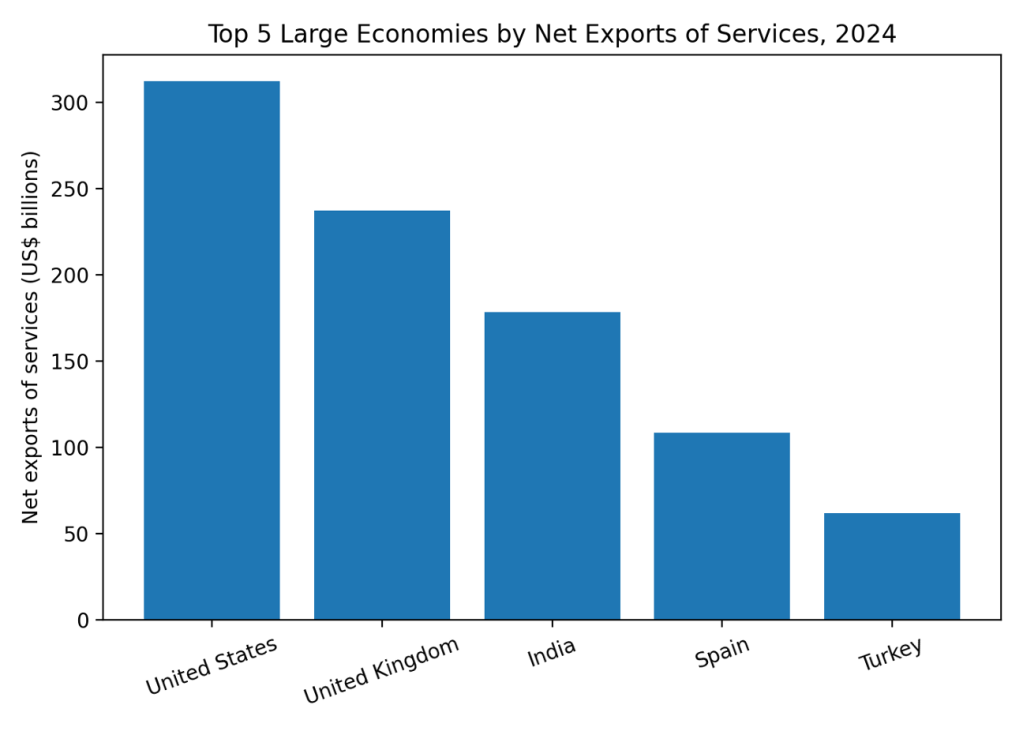
How does the United States compare to other countries? The following figure shows for 2024 the leaders in net exports of services for large economies (those with GDP of $1 trillion or more). The United States has largest value for net exports of services followed by the United Kingdom. China had negative net exports of services in 2024.
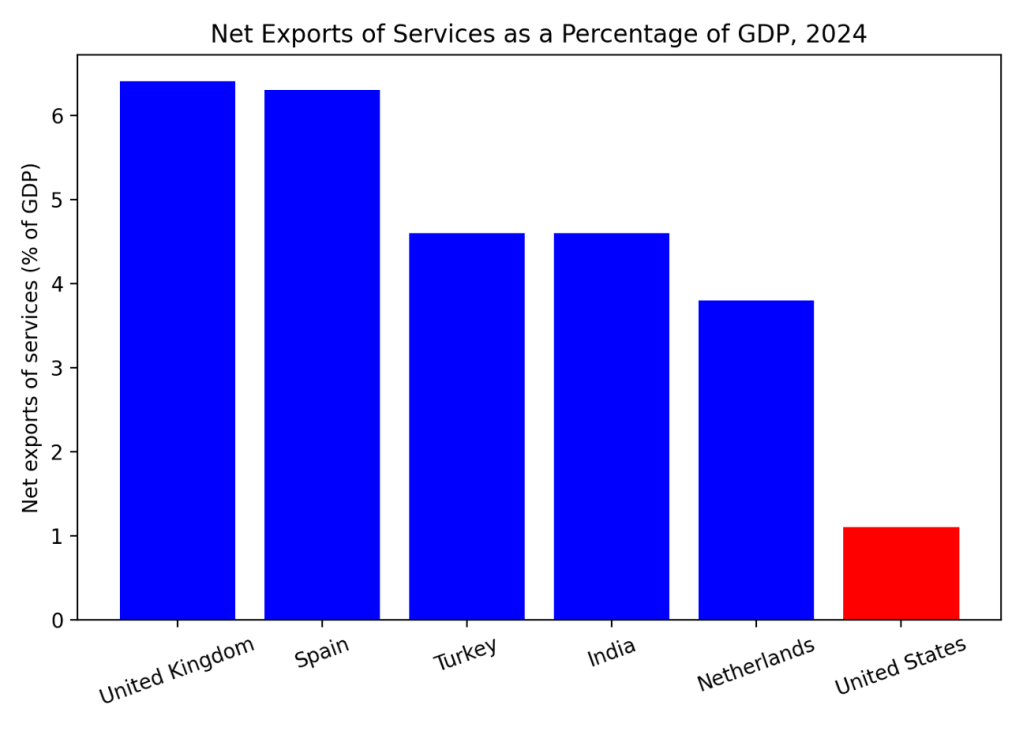
The following figure shows net exports in services as percentage of GDP among large economies. Measured this way, the largest net exporter of services is the United Kingdom, followed by Spain. The United States is included in graph (in red) for comparison and ranks ninth.
The following table from the St. Louis Fed’s blog posts shows the U.S. industries that export the most services.
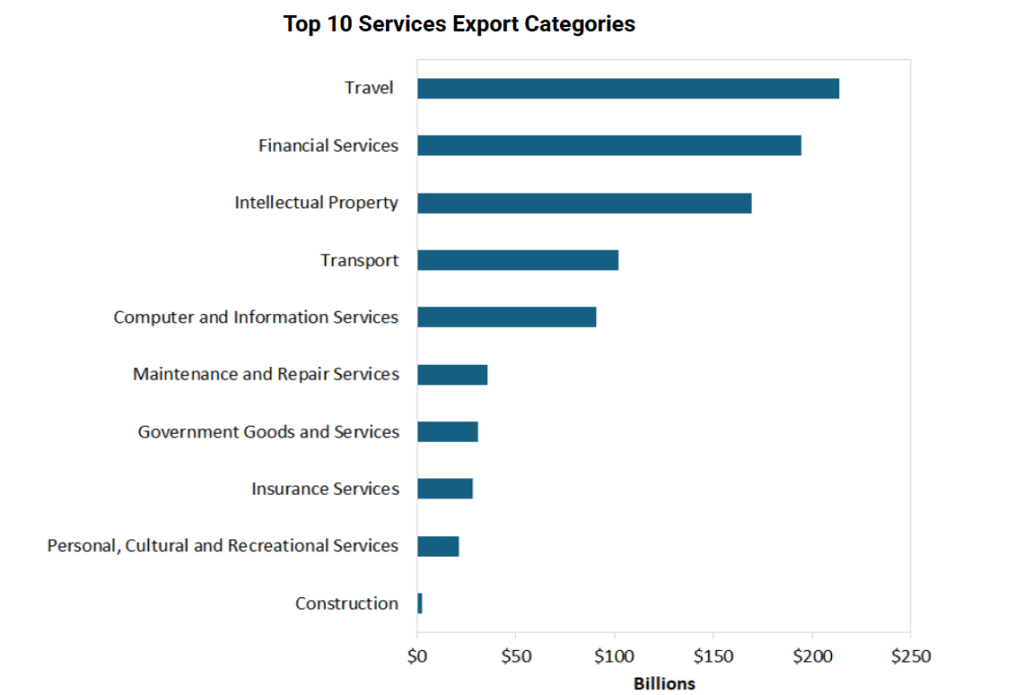
The export of travel services represents largely foreign tourism in the United States. For example, if a family from France visits Walt Disney World in Florida, their spending would be included as an export of travel services.
