Another Steady-as-She-Goes FOMC Meeting

Federal Reserve Chair Jerome Powell (Photo from the New York Times)

As always, economists and investors had been awaiting the outcome of today’s meeting of the Federal Reserve’s policy-making Federal Open Market Committee (FOMC) to get further insight into future monetary policy. The expectation has been that the FOMC would begin reducing its target for the federal funds rate, mostly likely beginning with its meeting on June 11-12. Financial markets were expecting that the FOMC would make three 0.25 percentage point cuts by the end of the year, reducing its target range from the current 5.25 to 5.50 percent to 4.50 to 4.75 percent.

There appears to be nothing in the committees statement (found here) or in Powell’s press conference following the meeting to warrant a change in expectations of future Fed policy. The committee’s statement noted that: “The Committee does not expect it will be appropriate to reduce the target range until it has gained greater confidence that inflation is moving sustainably toward 2 percent.” As Powell stated in his press conference, although the committee found the general trend in inflation data to be encouraging, they would have to see additional months of data that were consistent with their 2 percent inflation target before reducing their target for the federal funds rate.

As we’ve noted in earlier blog posts (here, here, and here), inflation during January and February has been somewhat higher than expected. Some economists and investors had wondered if, as a result, the committee might delay its first cut in the federal funds target range or implement only two cuts rather than three. In his press conference, Powell seemed unconcerned about the January and February data and expected that falling inflation rates of the second half of 2023 to resume.

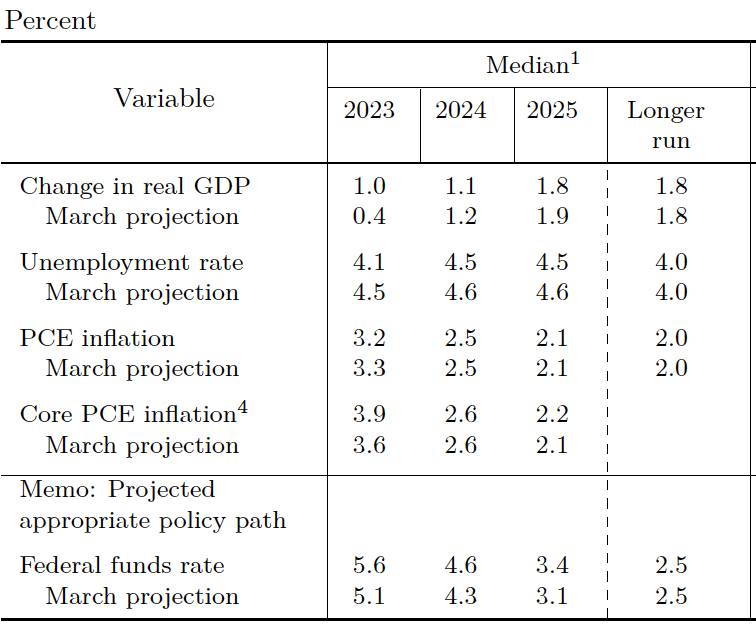
Typically, at the FOMC’s December, March, June, and September meetings, the committee releases a “Summary of Economic Projections” (SEP), which presents median values of the committee members’ forecasts of key economic variables.

The table shows that the committee members made relatively small changes to their projections since their December meeting. Most notable was an increase in the median projection of growth in real GDP for 2024 from 1.4 percent at the December meeting to 2.1 percent at this meeting. Correspondingly, the median projection of unemployment during 2024 dropped from 4.1 percent to 4.0 percent. The key projection of the value of the federal funds rate at the end of 2024 was left unchanged at 4.6 percent. As noted earlier, that rate is consistent with three 0.25 percent cuts in the target range during the remainder of the year.

The SEP also includes a “dot plot.” Each dot in the plot represents the projection of an individual committee member. (The committee doesn’t disclose which member is associated with which dot.) Note that there are 19 dots, representing the 7 members of the Fed’s Board of Governors and the 12 presidents of the Fed’s district banks. Although only the president of the New York Fed and the presidents of 4 of the 11 district banks are voting members of the committee, all the district bank presidents attend the committee meetings and provide economic projections.

The plots on the far left of the figure represent the projections of each of the 19 members of the value of the federal funds rate at the end of 2024. These dots are bunched fairly closely around the median projection of 4.6 percent. The dots representing the projections for 2025 and 2026 are more dispersed, representing greater uncertainty among committee members about conditions in the future. The dots on the far right represent the members’ projections of the value of the federal funds rate in the long run. As Table 1 shows, the median projected value is 2.6 percent (up slightly from 2.5 percent in December), although the plot indicates that all but one member expects that the long-run rate will be 2.5 percent or higher. In other words, few members expect a return to the very low federal funds rates of the period from 2008 to 2016.

The Fed Throws Wall Street a Curveball

A trader on the New York Stock Exchange listtening to Fed Chair Jerome Powell (from Reuters via the New York Times)

Accounting for movements in the market prices of stocks and bonds is not an exact exercise. Accounts in the Wall Street Journal and on other business web sites often attribute movements in stock and bond prices to the Fed having acted in a way that investors didn’t expect. 

The decision by the Fed’s Federal Open Market Committee (FOMC) at its meeting on September 20-21, 2023 to hold its target for the federal funds rate constant at a range of 5.25 percent to 5.50 percent wasn’t a surprise. Fed Chair Jerome Powell had signaled during his press conference on July 26 following the FOMC’s previous meeting that the FOMC was likely to pause further increases in the federal funds rate target. (A transcript of Powell’s July 26 press conference can be found here.)

In advance of the September meeting, some other members of the FOMC had also signaled that the committee was unlikely to increase its target. For instance, an article in the Wall Street Journal quoted Susan Collins, president of the Federal Reserve Bank of Boston, as stating that: “The risk of inflation staying higher for longer must now be weighed against the risk that an overly restrictive stance of monetary policy will lead to a greater slowdown than is needed to restore price stability.” And in a speech in August, Raphael Bostic, president of the Federal Reserve Bank of Atlanta, explained his position on future rate increases: “Based on current dynamics in the macroeconomy, I feel policy is appropriately restrictive. I think we should be cautious and patient and let the restrictive policy continue to influence the economy, lest we risk tightening too much and inflicting unnecessary economic pain.”

Although it wasn’t a surprise that the FOMCdecided to hold its target for the federal funds rate constant, after the decision was announced, stock and bond prices declined. The following figure shows the S&P 500 index of stock prices. The index declined 2.8 percent from September 19—the day before the FOMC meeting—to September 22—two days after the meeting. (We discuss indexes of stock prices in Macroeconomics, Chapter 6, Section 6.2; Economics, Chapter 8, Section 8.2; and Essentials of Economics, Chapter 8, Section 8.2.)

We see a similar pattern in the bond market. Recall that when the price of bonds declines in the bond market, the interest rates—or yields—on the bonds increase. As the following figure shows, the interest rate on the 10-year Treasury note rose from 4.37 percent on September 19 to 4.49 percent on September 21. The 10-year Treasury note plays an important role in the financial system, influencing interest rates on mortgages and corporate bonds. So, the yield on the 10-year Treasury note increasing from 3.3 percent in the spring of 2023 to 4.5 percent following the FOMC meeting has the effect of increasing long-term interest rates throughout the U.S. economy.

What explains the movements in the prices of stocks and bonds following the September FOMC meeting? Investors seem to have been surprised by: 1) what Chair Powell had to say in his news conference following the meeting; and 2) the committee members’ Summary of Economic Projections (SEP), which was released after the meeting.

Powell’s remarks were interpreted as indicating that the FOMC was likely to increase its target for the federal funds rate at least once more in 2023 and was unlikely to cut its target before late 2024. For instance, in response to a question Powell said: “We need policy to be restrictive so that we can get inflation down to target. Okay. And we’re going to need that to remain to be the case for some time.” Investors often disagree in their interpretations of what a Fed chair says. Fed chairs don’t act unilaterally because the 12 voting members of the FOMC decide on the target for the federal funds rate. So chairs tend to speak cautiously about future policy. Still, their seemed to be a consensus among investors that Powell was indicating that Fed policy would be more restrictive (or contractionary) than had been anticipated prior to the meeting.

The FOMC releases the SEP four times per year. The most recent SEP before the September meeting was from the June meeting. The table below shows the median of the projections, or forecasts, of key economic variables made by the members of the FOMC at the June meeting. Note the second row from the bottom, which shows members’ median forecast of the federal funds rate.

The following table shows the median values of members’ forecast at the September meeting. Look again at the next to last row. The members’ forecast of the federal funds rate at the end of 2023 was unchanged. But their forecasts for the federal funds rate at the end of 2024 and 2025 were both 0.50 percent higher.

Why were members of the FOMC signaling that they expected to hold their target for the federal funds rate higher for a longer period? The other economic projections in the tables provide a clue. In September, the members expected that real GDP growth would be higher and the unemployment rate would be lower than they had expected in June. Stronger economic growth and a tighter labor market seemed likely to require them to maintain a contractionary monetary policy for a longer period if the inflation rate was to return to their 2.0 percent target. Note that the members didn’t expect that the inflation rate would return to their target until 2026.