
Earlier this week, as we discussed in this blog post, the Federal Reserve’s policy-making Federal Open Market Committee (FOMC) voted to leave its target for the federal funds rate unchanged. In his press conference following the meeting, Fed Chair Jerome Powell stated that: “Overall, a broad set of indicators suggests that conditions in the labor market have returned to about where they stood on the eve of the pandemic—strong but not overheated.”
This morning (August 2), the Bureau of Labor Statistics (BLS) released its “Employment Situation” report (often referred to as the “jobs report”) for July, which indicates that the labor market may be weaker than Powell and the other members of the FOMC believed it to be when they decided to leave their target for the federal funds rate unchanged.
The jobs report has two estimates of the change in employment during the month: one estimate from the establishment survey, often referred to as the payroll survey, and one from the household survey. As we discuss in Macroeconomics, Chapter 9, Section 9.1 (Economics, Chapter 19, Section 19.1), many economists and policymakers at the Federal Reserve believe that employment data from the establishment survey provides a more accurate indicator of the state of the labor market than do either the employment data or the unemployment data from the household survey. (The groups included in the employment estimates from the two surveys are somewhat different, as we discuss in this post.)
According to the establishment survey, there was a net increase of 114,000 jobs during July. This increase was below the increase of 175,000 to 185,000 that economists had forecast in surveys by the Wall Street Journal and bloomberg.com. The following figure, taken from the BLS report, shows the monthly net changes in employment for each month during the past two years.
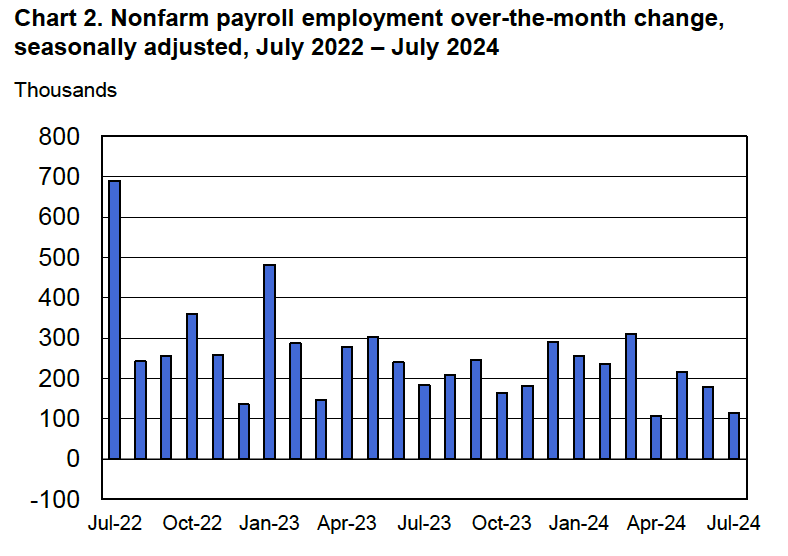
The previously reported increases in employment for April and May were revised downward by 29,000 jobs. (The BLS notes that: “Monthly revisions result from additional reports received from businesses and government agencies since the last published estimates and from the recalculation of seasonal factors.”) As we’ve discussed in previous posts (most recently here), downward revisions to the payroll employment estimates are particularly likely at the beginning of a recession, although this month’s adjustments were relatively small.
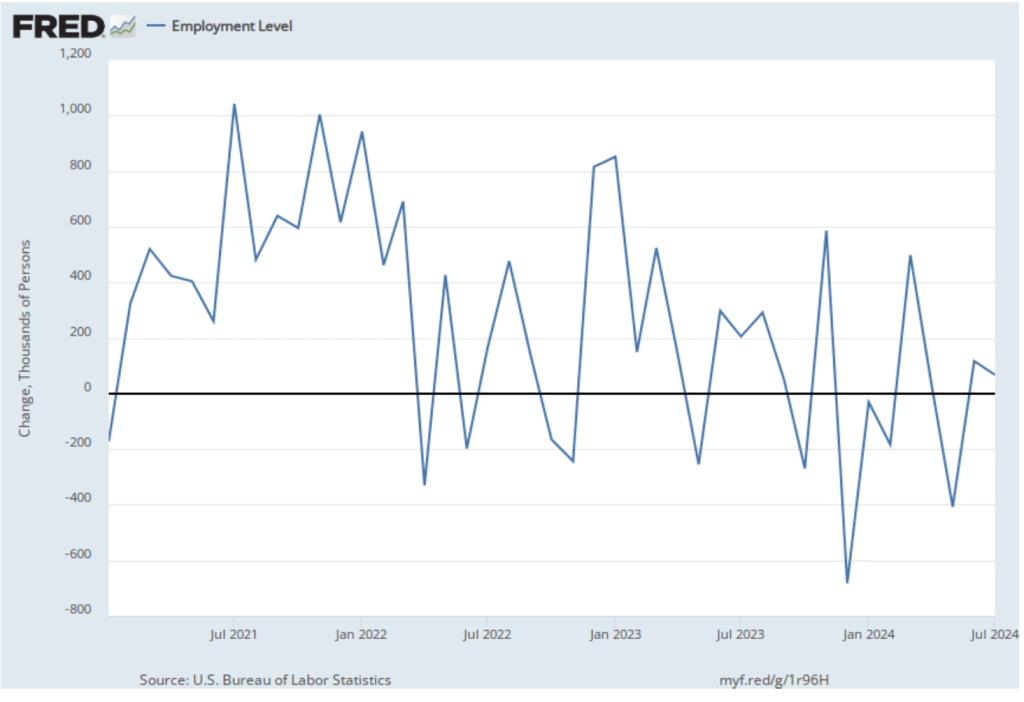
As the following figure shows, the net change in jobs from the household survey moves much more erratically than does the net change in jobs in the establishment survey. The net change in jobs as measured by the household survey declined from 116,000 in June to 67,000 in June. So, in this case the direction of change in the two surveys was the same—a decline in the increase in the number of jobs.
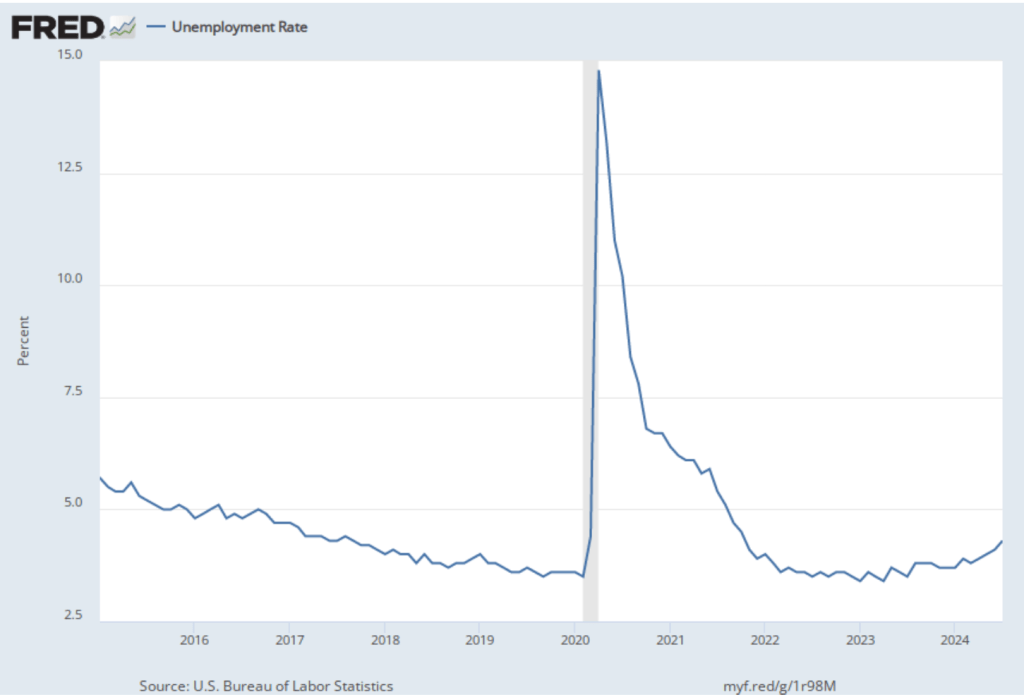
As the following figure shows, the unemployment rate, which is also reported in the household survey, increased from 4.1 percent to 4.3 percent—the highest unemployment rate since October 2021. Although still low by historical standards, July was the fifth consecutive month in which the unemployment rate increased. It is also higher than the unemployment rate just before the pandemic. The unemployment rate was below 4 percent most months from mid-2018 to early 2020.
Some economists and policymakers have been following the Sahm rule, named after Claudia Sahm Chief Economist for New Century Advisors and a former Fed economist. The Sahm rule, as stated on the site of the Federal Reserve Bank of St. Louis is: “Sahm Recession Indicator signals the start of a recession when the three-month moving average of the national unemployment rate (U3 [measure]) rises by 0.50 percentage points or more relative to the minimum of the three-month averages from the previous 12 months.” The following figure shows the values of this indicator dating back to March 1949.
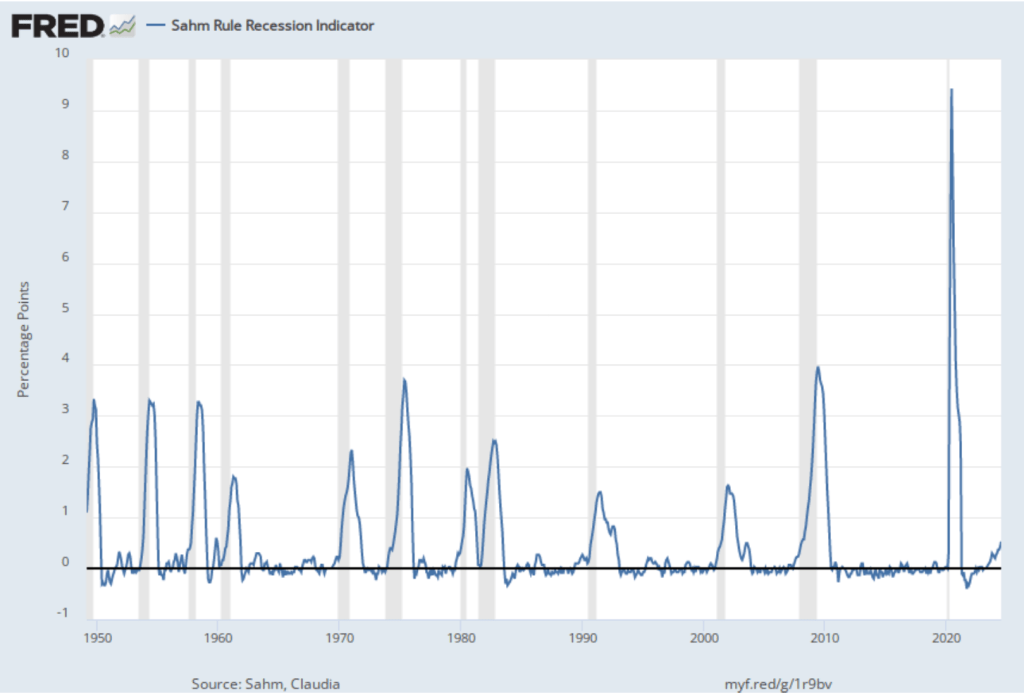
So, according to this indicator, the U.S. economy is now at the start of a recession. Does that mean that a recession has actually started? Not necessarily. As Sahm stated in an interview this morning, her indicator is a historical relationship that may not always hold, particularly given how signficantly the labor market has been affected during the last four years by the pandemic.
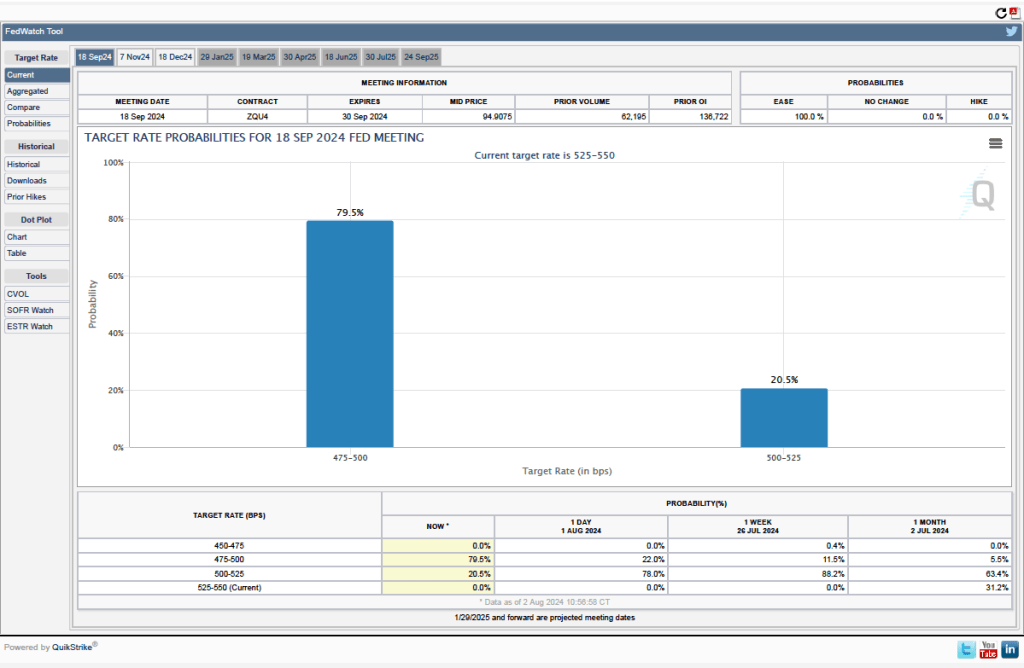
As we noted in a post earlier this week, investors who buy and sell federal funds futures contracts assigned a probability of 11 percent that the FOMC would cut its target for the federal funds rate by 0.50 percentage point at its next meeting. (Investors in this market assigned a probability of 89 percent that the FOMC would cut its target by o.25 percentage point.) Today, investors dramatically increased the probability to 79.5 percent of a 0.50 cut in the federal funds rate target, as shown in this figure from the CME site.
Investors on the stock market appear to believe that the probability of a recession beginning before the end of the year has increased, as indicated by sharp declines today in the stock market indexes.
The next scheduled FOMC meeting isn’t until September 17-18. The FOMC is free to meet in between scheduled meetings but doing so might be interpreted as meanng that economy is in crisis, which is a message the committee is unlikely to want to send. It would likely take additional unfavorable reports on macro data for the FOMC not to wait until September to take action on cutting its target for the federal funds rate.
