Solved Problem: Congestion Pricing and the Price Elasticity of Demand

Supports: Microeconomics and Economics, Chapter 6, and Essentials of Economics, Chapter 7, Section 7.5-7.7

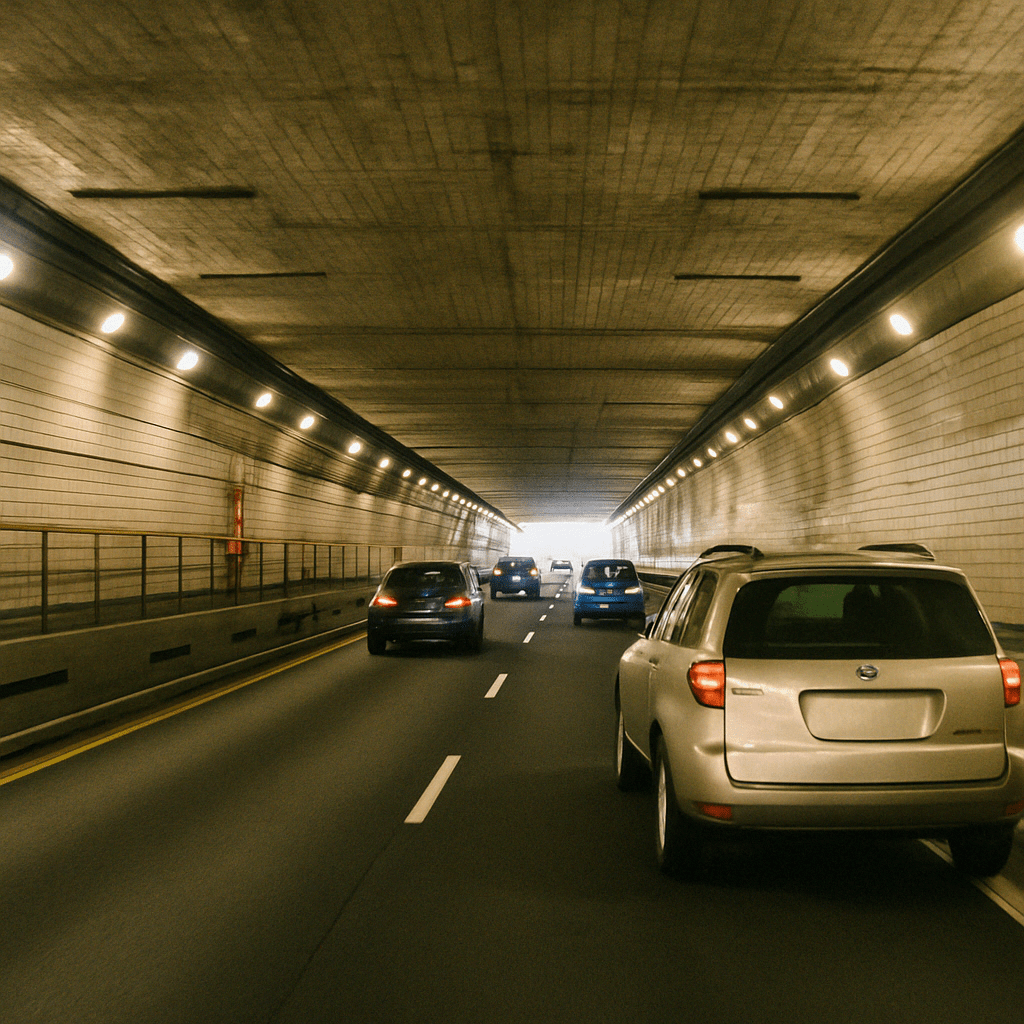
ChatGTP-4o image of cars in the Lincoln Tunnel, which connects New Jersey with midtown Manhattan.

In January 2025, New York City began enforcing congestion pricing in the borough of Manhattan south of 60th Street—the congestion relief zone. The Metropolitan Transportation Authority (MTA) in New York collects a toll from a vehicle entering that zone either automatically using the vehicle’s E-ZPass transponder or by reading the vehicle’s license plate and mailing a bill to the vehicle’s owner. Nobel Laureate William Vickrey of Columbia University first proposed congestion pricing in the 1950s as a way to deal with the negative externalities from traffic congestion. Congestion pricing acts as a Pigovian tax that internalizes the external costs drivers generate by using streets in congested areas. (We discuss Pigovian taxes in Microeconomics and Economics, Chapter 5, Section 5.3, and in Essentials of Economics, Chapter 4, Section 4.3.)

The New York City congestion toll is somewhat complex, varying according to the type of vehicle and how the vehicle enters the area in which the toll applies. The congestion toll fora car entering Manhattan through the Lincoln Tunnel on a weekday between 5 am and 9 pm is $6.00 on top of the existing toll of $16.06. In January 2025, the volume of cars driving through the Lincoln Tunnel declined by 8 percent during the weekday hours of 5 am to 9 pm. According to an article in Crain’s New York Business, the number of vehicles entering the congestion relief zone compared with the same month in the previous year declined by 8 percent in January, 12 percent in February, and 13 percent in March.

  1. From the information given, can we determine the price elasticity of demand for entering Manhattan by driving though the Lincoln Tunnel during weekdays from 5am to 9am? Briefly explain.
  2. Suppose someone makes the following claim: “Because the quantity of cars using the Lincoln Tunnel has declined by 8 percent, we know that the MTA must have collected less revenue from cars using the tunnel than before the congestion toll was imposed.” Briefly explain whether you agree.
  3. Is the pattern of increasing percentage declines in vehicle traffic in the congestion relief zone each month from January to March what we would expect? Be sure your answer refers to concepts related to the price elasticity of demand.

Step 1: Review the chapter material. This problem is about the price elasticity of demand, so you may want to review Chapter 6, Sections 6.1-6.4. 

Step 2: Answer part (a) by explaining whether from the information given we can determine the price elasticity of demand for entering Manhattan by driving through the Lincoln Tunnel. We do have sufficient information to determine the price elasticity, provided that nothing else that would affect the demand for driving through the Lincoln Tunnel changed during January. We’re told the percentage change in the quantity demand, so we need only to calculate the percentage change in the price to determine the price elasticity. The change in the price is the $6 congestion toll. The average of the price before and the price after the toll is imposed is ($16.06 + $22.06) = $19.06. Therefore, the percentage change in the price is ($6/$19.06) × 100 = 31.5 percent. The price elasticity of demand is equal to the percentage change in quantity dmanded divided by the percentage change in price: –6%/31.5% = –0.3. Because this value is less than 1 in absolute value, we can conclude that the demand for driving through the Lincoln Tunnel is price inelastic.

Step 3: Answer part (b) by explaining whether because the quantity of cars driving through the Lincoln Tunnel has declined the MTA must have collected less revenue from cars using the tunnel. As shown in Section 6.3 of the textbook, total revenue received will fall after a price increase only if demand is price elastic. In this case, demand is price inelastic, so the total revenue the MTA collects from cars using the Lincoln Tunnel will rise, not fall.

Step 3: Answer part (c) by explaining whether the pattern of increasing percentage declines in vehicle traffic in the congestion relief zone is one we would expect. In Section 6.2, we see that the passage of time is one of the determinants of the price elasticity of demand. The more time that passes, the more price elastic the demand for a product becomes. In other words, the longer the time that people have to adjust to the congestion toll—by, for instance, taking a bus rather than driving through the Lincoln Tunnel in a car—the more likely it is that people will decide not to drive into the congestion relief zone. So, it is not surprising that the number of vehicles entering the congestion relief zone declined by a greater percentage each month from January to March.

Trump Administration Implements Historically Large Tariff Increases … and a Related Solved Problem

Image generated by ChatGTP-4o of new cars on a dealer’s lot.

This afternoon (April 2), President Donald Trump announced a sweeping increase in tariff rates on imported goods. The increases were by far the largest since the Smoot-Hawley Tariff of 1930. The United States will impose 10 percent across-the-board tariff on all imports, with higher tariffs being imposed on individual countries. Taking into account earlier tariffs, Chinese imports will be subject to a 54 percent tariff. Imports from Vietnam will be subject to a 46 percent tariff, and imports from the countries in the European Union will be subject to a 20 percent tariff.

President Trump’s objectives in imposing the tariffs aren’t entirely clear because he and his advisers have emphasized different goals at different times. The most common objectives the president and his advisers have offered for the tariff increases are these three:

  1. To increase the size of the U.S. manufacturing sector by raising the prices of imported manufactured goods.
  2. To retaliate against barriers that other countries have raised against U.S. exports.
  3. To raise revenue for the federal government.

The effects of the tariffs on the U.S. economy depend in part on whether foreign countries retaliate by raising their tariffs on imports from the United States and on whether, in the future, the president reduces tariffs in exchange for other countries reducing barriers to U.S. imports. For a background discussion of tariffs, see this post. Glenn and Tony discuss tariffs in this podcast, which was recorded on Friday afternoon (March 28). A discussion of the Smoot-Hawley Tariff can be found here.

The following Solved Problem looks at one aspect of the effects of a tariff increase.

Supports: Microeconomics and Economics, Chapter 6, Section 6.3.

Nearly every automobile assembled in the United States contains at least some imported parts. An article on axis.com made the following statement about the effect on U.S. automobile manufacturers of an increase in the tariff on imported auto parts: “If car prices [in the United States] go up, Americans will buy fewer of them, meaning less revenue ….” What assumption is the author of this article making about the demand for new automobiles in the United States?

Solving the Problem

Step 1: Review the chapter material. This problem is about the effect of price increases on a firm’s revenue, so you may want to review the section “The Relationship between Price Elasticity of Demand and Total Revenue.”

Step 2: Answer the question by explaining what must be true of the demand for new automobiles in the United States if an increase in automobile prices results in a decline in the revenue received by automobile producers. This section of Chapter 6 explains how the price elasticity of demand affects the revenue a firm receives following a price increase. A price increase, holding everything else constant that affects the demand for a good, always causes a decline in the quantity demanded. If demand is price inelastic, an increase in price will result in an increase in revenue because the percentage decline in quantity demanded will be smaller than the percentage increase in the price. If demand is price elastic, an increase in price will result in a decrease in revenue because the percentage decline in the quantity demanded will be larger than the percentage increase in price. We can conclude that the author of the article must be assuming that the demand for new automobiles in the United States is price elastic.

Solved Problem: Difficulties in Determining the Price Elasticity of Demand for Frappuccinos

SupportsMicroeconomics and Economics, Chapter 6, and Essentials of Economics, Chapter 7.

Photo from the New York Times.

An article in the Wall Street Journal reported that Starbucks during certain periods is cutting by 50 percent the prices of many of its coffees, including its Frappuccino. The article also noted that: “Many restaurant chains are pumping out new deals this year in a bid to reverse weak traffic.” The article also quoted a Starbucks spokesman as saying that Starbucks is cutting prices “to ensure that consumers who are facing a challenging economic environment continue to visit its cafes.”

  1. What is Starbucks likely assuming about the price elasticity of demand for Frappuccinos?
  2. Suppose that after cutting its price of Frappuccinos by 50 percent, the quantity of Frappuccinos sold increases by 20 percent. Ignoring any information other than the values of the price cut and the quantity increase, calculate the price elasticity of demand for Frappuccinos. Considering only the value of the price elasticity of demand you calculated, will Starbucks earn more revenue or less revenue from selling Frappuccions as a result of the price cut? Briefly explain.
  3. Suppose that during the time that Starbucks cuts the price of Frappuccinos, competing coffee houses also cut the prices of their coffees. How will this fact affect your answer to part b.? Briefly explain.
  4. Does the fact that, because of inflation, some consumers are facing a “challenging economic environment” affect your answer to part b.? Briefly explain. 

Solving the Problem

Step 1: Review the chapter material. This problem is about the determinants of the price elasticity of demand and the effect of the value of the price elasticity of demand on a firm’s revenue following a price change, so you may want to review Chapter 6, Section 6.2 and Section 6.3.

Step 2: Answer part a. by explaining what Starbucks is likely assuming about the price elasticity of demand for Frappuccinos. Starbucks appears to be assuming that the demand for Frappuccions is price elastic, in which case a cut in the price will result in a more than proportional increase in the quantity of Frappuccions demanded. 

Step 3: Answer part b. by using the values given to calculate the price elasticity of demand for Frappuccions and explain whether as a result of the price cut Starbucks will earn more or less revenue from selling Frappuccinos. If all other factors affecting the demand for a product are held constant, the price elasticity of demand equals the percentage change in the quantity demanded divided by the percentage change in price. Therefore, in this case the price elasticity of demand for Frappuccinos equals 20%/–50% = –0.4. Therefore, relying just on the information on the changes in the price and quantity demanded, the demand for Frappuccinos is price inelastic. As explained in Section 6.5, when demand is price inelastic, a cut in price will result in a decrease in revenue.

Step 4: Answer part c. by explaining whether other coffee houses cutting the prices of their coffees will affect your calculation from part b. of the price elasticity of demand for Frappuccinos. The calculation in part b. assumes that during the time that Starbucks cuts the price of Frappuccinos, nothing else that affects demand will have changed. We know that the coffees sold by other coffee houses are substitutes for Frappuccinos. So we would expect that if other coffeehouses cut the prices of their coffees, the demand curve for Frappuccinos will shift to the left. The 20 percent increase in the quantity of Frappuccions sold reflects the effects of both the price cut and the shift in the demand curve for Frappuccinos. Therefore our calculation of the price elasticity of demand for Frappuccinos is inaccurate. It’s likely that the price elasticity is larger (in absolute value) than the value we caculated in part b.


Step 5: Answer part d. by explaining whether the fact that some consumers are facing a “challenging economic environment” affects your answer to part b.  The answer to part d. is similar to the answer to part c. If the fact that some consumers are facing a “challenging economic environment” means that these consumers are less likely to be buying coffee and other products away from home, then the demand curve for Frappuccinos will have shifted to the left during the period that Starbucks cut the price of these coffees. As a result, the value we computed for the price elasticity of demand in part b. will be inaccurate. Taken together, the factors mentioned in parts c. and d. indicate the difficulties that firms have in calculating the price elasticity of demand for their products during a time period when several factors that affect the demand for the products may be changing.

California Deals with the Paradox of Tobacco Taxes

(Photo from Zuma Press via the Wall Street Journal.)

When state and local governments impose taxes on sales of liquor, on cigarettes and other tobacco products, or on soda and other sweetened beverages, they typically have two objectives: (1) Discourage consumption of the taxed goods, and (2) raise revenue to pay for government services.  As we discuss in Chapter 6 of Microeconomics (also Economics, Chapter 6), these objectives can be at odds with each other. The tax revenue a government receives depends on both the size of the tax and the number of units sold. Therefore, the more successful a tax is in significantly reducing, say, sales of cigarettes, the less tax revenue the government receives from the tax.

As we discuss in Chapter 6, a tax on a good shifts the supply curve for the good up by the amount of the tax. (We think it’s intuitively easier to think of a tax as shifting up a supply curve, but analytically the effect on equilibrium is the same if we illustrate the effect of the tax by shifting down the demand curve for the taxed good by the amount of the tax.)  A tax will raise the equilibrium price consumers pay and reduce the equilibrium quantity of the taxed good that they buy. For a supply curve of a given price elasticity in the relevant range of prices, how much a tax increases equilibrium  price relative to how much it decreases equilibrium quantity is determined by the price elasticity of demand. 

The following figure illustrates these points. If a city implements a tax of $0.75 per 2-liter bottle of soda, the supply curve shifts up from S1 to S2. If demand is price elastic, the equilibrium price increases from $1.75 to $2.00, while the equilibrium quantity falls from 90,000 bottles per day to 70,000. If demand is price inelastic, the equilibrium price rises by more, but the equilibrium quantity falls by less. Therefore, a more price elastic demand curve is good news for objective (1) above—soda consumption falls by more—but bad news for the amount of tax revenue the government collects. When the demand for soda is price inelastic, the government collects tax revenue of $0.75 per bottle multiplied by 80,000 bottles, or $60,000 per day. When the demand for soda is price elastic, the government collects tax revenue of $0.75 per bottle multiplied by 70,000 bottles, or only $52,500 per day.

One further point: We would expect the amount of revenue the government earns from the tax to decline over time, holding constant other variables that might affect the market for the taxed good, . This conclusion follows from the fact that demand typically becomes more price elastic over time. In other words, when a tax is first imposed (or an existing tax is increased), consumers are likely to reduce purchases of the taxed good less in the short run than in the long run. This result can a problem for governments that make a commitment to use the tax revenues for a particular purpose.

A recent article in the Los Angeles Times highlighted this last point. In 1999, California voters passed Proposition 10, which increased the tax on cigarettes by $0.50 per pack, with similar tax increases on other tobacco products. The tax revenues were dedicated to funding “First 5” state government agencies, which are focused on providing services to children 5 years old and younger.  The article notes, as the above analysis would lead us to expect, that the additional revenue the state received from the tax increase was largest in the first year and has gradually declined since as the quantity of cigarettes and other tobacco products sold has fallen. (Note that over such a long period of time, other factors in addition to the effects of the tax have contributed to the decline in smoking in California.) As a result, the state and county governments have had to scramble to find additional sources of funds for the First 5 agencies. The article quotes Deborah Daro, a researcher at the University of Chicago, as noting: “It seemed like a brilliant solution—tax the sinners who are smoking to help newborns and their parents …. But then people stopped smoking, which from a public health perspective is great, but from a funding perspective for First 5—they don’t have another funding stream.”

Solved Problem: The German Tobacco Tax and Price Elasticity

(Photo from Reuters via the Wall Street Journal)

Supports: Microeconomics, Chapter 6, Section 6.3, Economics, Chapter 6, Section 6.3, and Essentials of Economics, Chapter 7, Section 7.7.

In August 2023, an article in the Wall Street Journal discussed the effort of the German government to reduce tobacco use. As part of the effort, the government increased the tax on tobacco products, including cigars and cigarettes. The tax increase took effect on January 1, 2022. According to German government data, during 2022 the quantity of cigars and cigarettes sold declined by 8.3 percent. At the same time, the tax revenue the government collected from the tobacco tax declined from €14.7 billion to €14.2 billion.

  1. From this information, can you determine whether the tobacco tax raised the price of cigars and cigarettes by more or less than 8.3 percent? Can you determine whether the demand for cigars and cigarettes in Germany is price elastic or price inelastic? Briefly explain.
  2. According to the Wall Street Journal article, in addition to increasing the tax on tobacco products, the German government took other steps, including banning outdoor advertising of tobacco products, to discourage smoking. Does this additional information affect your answer to parts a.? Briefly explain. 

Solving the Problem

Step 1:  Review the chapter material. This problem is about the effect of price changes on revenue, so you may want to review Microeconomics, Chapter 6, Section 6.3, “The Relationship between Price Elasticity of Demand and Total Revenue,” or the corresponding sections in Economics, Chapter 6 or Essentials of Economics, Chapter 7.

Step 2: Answer part a. by explaining whether you can tell if the tobacco tax raised the price of cigars and cigarettes by more than 8.3 percent and whether the demand for cigars and cigarettes in Germany is price elastic or price inelastic. We have two pieces of information: (1) In 2022, the quantity of cigars and cigarettes sold in Germany fell by 8.3 percent, and (2) the revenue the German government collected from the tobacco tax fell. We know that if a company increases the price of its product and the total revenue it earns falls, then the demand for the product must be price elastic. We can apply that same reasoning to a government increasing a tax. If the tax increase leads to a fall in revenue we can conclude that the demand for the good being taxed (in this case cigars and cigarettes) is price elastic.  When the demand for a good is price elastic, the percentage change in the quantity demanded resulting from a price increase will be greater than the percentage change in the price.  Therefore, the percentage change in price resulting from the tax must be less than 8.3 percent. An important qualification to this conclusion is that it holds only if no variable, other than the increase in the tax, affected the demand for cigars and cigarettes during 2022.

Step 3: Answer part b. by explaining how the German government’s banning of outdoor advertising of tobacco products affects your answer to part a. Banning outdoor advertising of tobacco products may have reduced the demand for cigars and cigarettes. If the demand curve for cigars and cigarettes shifted to left, then some of the 8.3 percent decline in the quantity sold may have been the result of the shift in demand rather than the result of the increase in the tax. In other words, the German market for cigars and cigarettes in 2022 may have experienced both a decrease in demand—as the demand curve shifted to the left—and a decrease in the quantity demanded—as the tax increase raised the price of cigars and cigarettes. Given this new information, we can’t be sure that our conclusions in part a.—that the demand for cigars and cigarettes is price elastic and that the tax resulted in an increase in the price of less than 8.3 percent—are correct.  

Extra credit:  This discussion indicates that in practice economists have to use statistical methods when they estimate the price elasticity of demand for a good or service. The statistical methods make it possible to distinguish the effect of a movement along a demand curve as the price changes from a shift in the demand curve caused by changes in other economic variables.  

Sources:  Jimmy Vielkind, “Smoking Is a Dying Habit. Not in Germany,” Wall Street Journal, August 31, 2023; and Statistisches Bundesamt, “Taxation of Tobacco Products (Cigarettes, Cigars/Cigarillos, Fine-Cut Tobacco, Pipe Tobacco): Germany, Years, Tax Stamps,” September 10, 2023.

The Price Elasticity of Demand for Subway and Bus Rides

Supports: Microeconomics, Chapter 6, Section 6.3, Economics, Chapter 6, Section 6.3, and Essentials of Economics, Chapter 7, Section 7.7.

New York City subway. (Photo from the New York Times.)

An article on Crain’s New York Business noted that the Metropolitan Transit Authority (MTA), which runs New York City’s public transportation system was increasing the fare for a bus or subway ride from $2.75 to $2.90. The article noted that: “Revenue generated by the fare increase is expected to cover the [MTA’s] operating expenses and help keep up with inflation.”

a.  What is the MTA assuming about the price elasticity of demand for subway and bus rides in New York City? How plausible do you find this assumption? Briefly explain.

b. What is the largest percentage decline in subway and bus rides that the MTA can experience and still meet its revenue expectations?

Solving the Problem

Step 1:  Review the chapter material. This problem is about the relationship between a price increase on quantity demanded and revenue, so you may want to review the section “The Relationship between Price Elasticity of Demand and Total Revenue.”

Step 2:  Answer part (a) by explaining what the MTA is assuming about the price elasticity of demand for subway and bus rides, and comment on the plausibility of this assumption. If the MTA is expecting that an increase in the price of a subway and bus ride will increase the total revenue it earns from these rides, it must be assuming that the demand for subway and bus rides is price inelastic. If the demand were price elastic, the MTA would earn less revenue following the price increase.

 As we saw in Chapter 6, Section 6.2, the most important determinant of elasticity is the existence of substitutes. In a big city, the most important substitutes to taking public transportation are: (1) people walking, (2) people driving their own cars, or (3) people using a ride-hailing service, such as Uber and Lyft.  People who live close to their destination and who were indifferent between walking and taking public transportation before the price increase, are likely to switch to walking. Given the size of a city like New York, we might expect the number of these people to be relatively small. Driving your own car in a big city has the drawback that heavy traffic may mean it takes longer to drive than to take the bus or subway and paying for parking can be expensive. Using Uber or Lyft is also much more expensive than taking public transportation and may also be slow. It seems likely that current users of public transportation in New York City don’t see these alternatives as close substitutes for the bus or subway. So, it’s plausible for the MTA to assume that the demand for subway and bus rides is price inelastic. 

Step 3:  Answer part (b) by calculating the largest percentage decline in bus and subway rides that the MTA can experience and still meet its revenue expectations. The MTA is increasing the price of subway and bus rides from $2.75 to $2.90 per ride. That is a ($0.15/$2.75) × 100 = 5.5 percent increase. (Note that we would get a somewhat different result if we used the midpoint formula described in Section 6.1.) For the MTA’s revenue to increase as a result of the price increase, the percentage decrease in the quantity demanded of subway rides must be less than the percentage increase in the price. Therefore, the price increase can’t result in a decline of more than 5.5 percent. 

Source:  Caroline Spivak, “Subway and Bus Fares Will Increase Starting Sunday,” crainesnewyork.com, August 18, 2023.

The Price Elasticity of Demand for Disney+

Supports: Microeconomics, Chapter 6, Section 6.3, Economics, Chapter 6, Section 6.3, and Essentials of Economics, Chapter 7, Section 7.7

The Walt Disney Studios in Burbank, California (Photo from reuters.com)

On August 9, Disney released its earnings for the third quarter of its fiscal year. In a conference call with investors, Disney CEO Bob Iger announced that the price for a subscription to the Disney+ streaming service would increase from $10.99 per month to $13.99. An article in the Wall Street Journal quoted Iger as saying that the company had been more uncertain about pricing Disney+ than rival Netflix was about pricing its streaming service “because we’re new at all this.” According to the article, Iger had also said that “there was room to raise prices further [for Disney+] without reducing demand.” A column in the New York Times made the following observation: “The strategy now is to extract more money from subscribers via hefty price increases for Disney+, and hoping that those efforts don’t drive them away.”

a.  What is Disney assuming about the price elasticity of demand for Disney+? Briefly explain.

b. Assuming that Disney is only concerned with the total revenue it earns from Disney+, what is the largest percentage of subscribers Disney can afford to “drive away” as a result of its price increase?

c.  Why would Iger point out that Disney was new at selling streaming services when discussing the large price increase they were implementing?

d.  According to the Wall Street Journal’s account of Iger’s remarks, did he use the phrase “reducing demand” as an economist would? Briefly explain. 

Solving the Problem

Step 1:  Review the chapter material. This problem is about the effect of a price change on a firm’s revenue, so you may want to review the section “The Relationship between Price Elasticity of Demand and Total Revenue.”

Step 2:  Answer part (a) by explaining what Disney is assuming about the price elasticity of demand for Disney+.Disney must be assuming that the demand for Disney+ is price inelastic because they expect that the price increase will increase the revenue they earn from the service. If the demand were price elastic, they would earn less revenue following the price increase. 

Step 3:  Answer part (b) by calculating the largest percentage of subscribers that Disney can drive away with the price increase. Disney is increasing the price of Disney+ by $3 per month, from $10.99 to $13.99. That is a ($3/$10.99) × 100 = 27.3 percent increase. (Note that we would get a somewhat different result if we used the midpoint formula described in Section 6.1.)  For the price increase to increase Disney’s revenue from Disney+, the percentage decrease in the quantity demanded must be less than the percentage increase in the price. Therefore, the price increase can’t drive away more than 27.3 percent of Disney+ subscribers. 

Step 4:  Answer part (c) by explaining why Iger mentioned that Disney was new to streaming when discussing the Disney+ price increase. Firms sometimes attempt to statistically estimate their demand curves to determine the price elasticity. But particularly when a firm has only recently started selling a product, it often searches for the profit maximizing price through a process of trial and error. Iger contrasted Disney’s relative lack of experience in selling streaming services with Netflix’s much longer experience. In that context, it’s plausible that Disney had been substantially overestimating the price elasticity of demand for Disney+ (that is, Disney had thought that in absolute value, the price elasticity was larger than it actually was). So, the profit maximizing price might be significantly higher than the company had initially thought.

Step 5:  Answer part (d) by explaining whether Iger used the phrase “reducing demand” as an economist would. Following a price increase, Disney will experience a reduction in the quantity demanded of Disney+ subscriptions—a movement along the demand curve for subscriptions. For Disney to experience reduced demand for Disney+ subscriptions—a shift of the demand curve—a change in some variable other than price would have to cause consumers to reduce their willingness to buy subscriptions at every price.

Sources:  Robbie Whelan, “Disney to Significantly Raise Prices of Disney+, Hulu Streaming Services,” Wall Street Journal, August 9, 2023; and Andrew Ross Sorkin, Ravi Mattu, Sarah Kessler, Michael J. de la Merced, and Ephrat Livni, “Bob Iger Tweaks Disney’s Strategy on Streaming,” New York Times, August 10, 2023.