
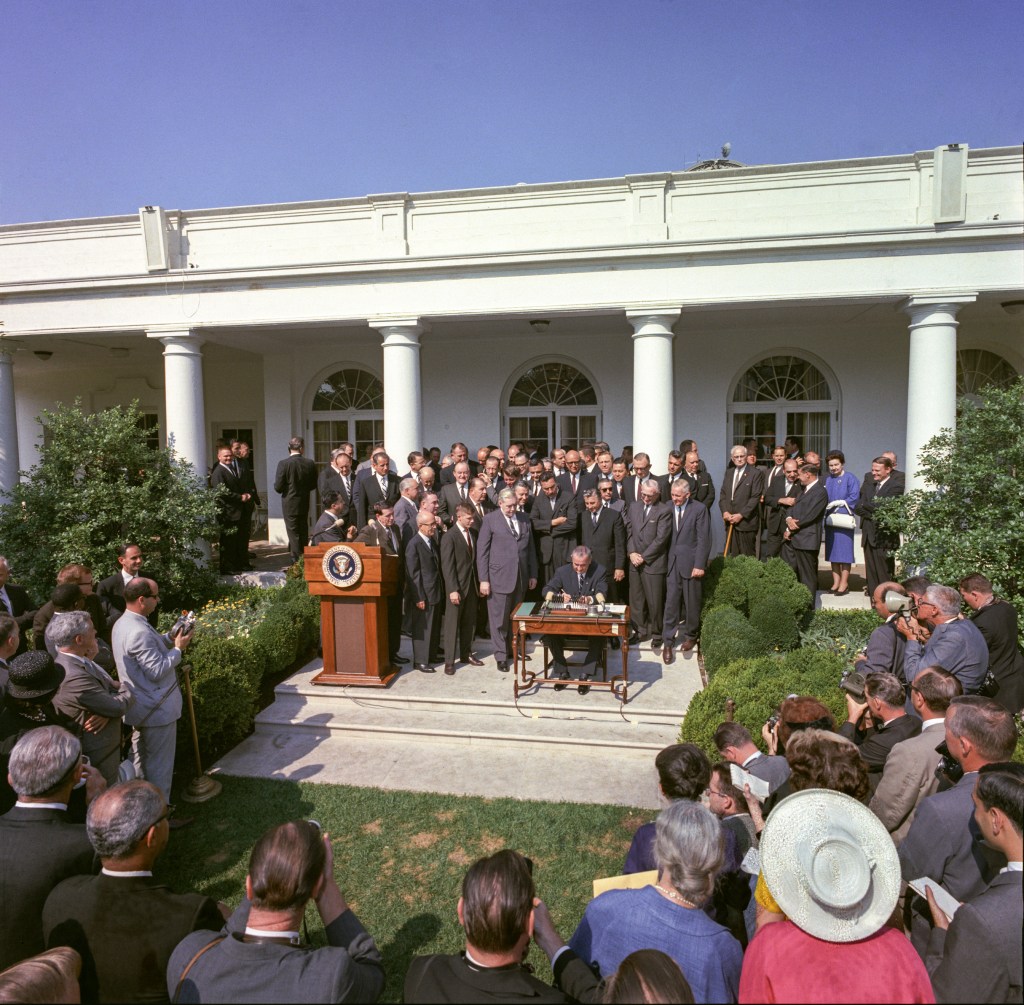
President Lyndon Johnson signing the Economic Opportunity Act in 1964. (Photo from Wikipedia)
In 1964, President Lyndon Johnson announced that the federal government would launch a “War on Povery.” In 1988, President Ronald Regan remarked that “some years ago, the Federal Government declared war on poverty, and poverty won.” Regan was exaggerating because, however you measure poverty, it has declined substantially since 1964, although the official poverty rate has remained stubbornly high since the early 1970s.
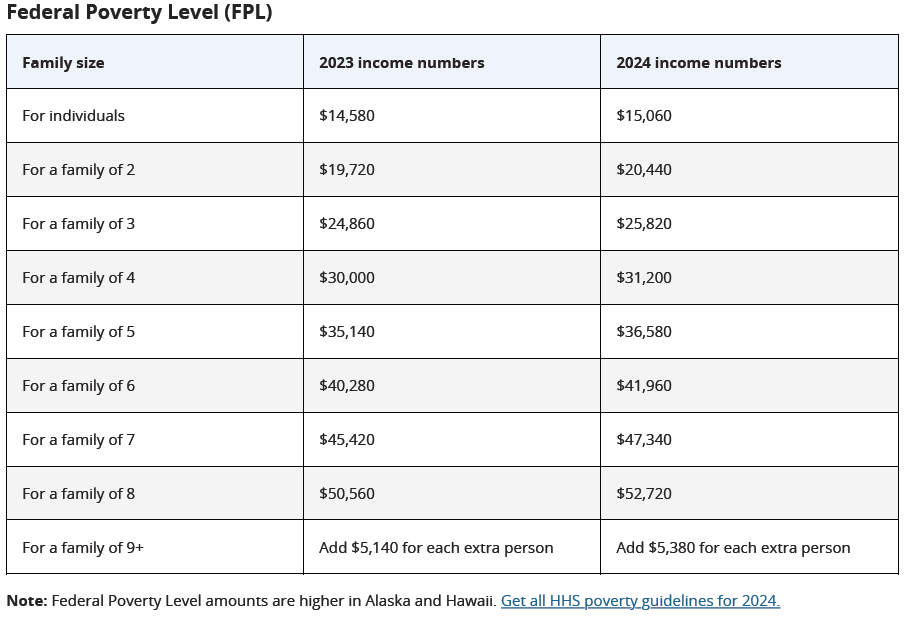
Each year the U.S. Census Bureau calculates the official poverty rate—the fraction of the population with incomes below the federal poverty level, often called the poverty line. The following table shows the poverty line for the years 2023 and 2024 illustrating how it varies with the size of a household:
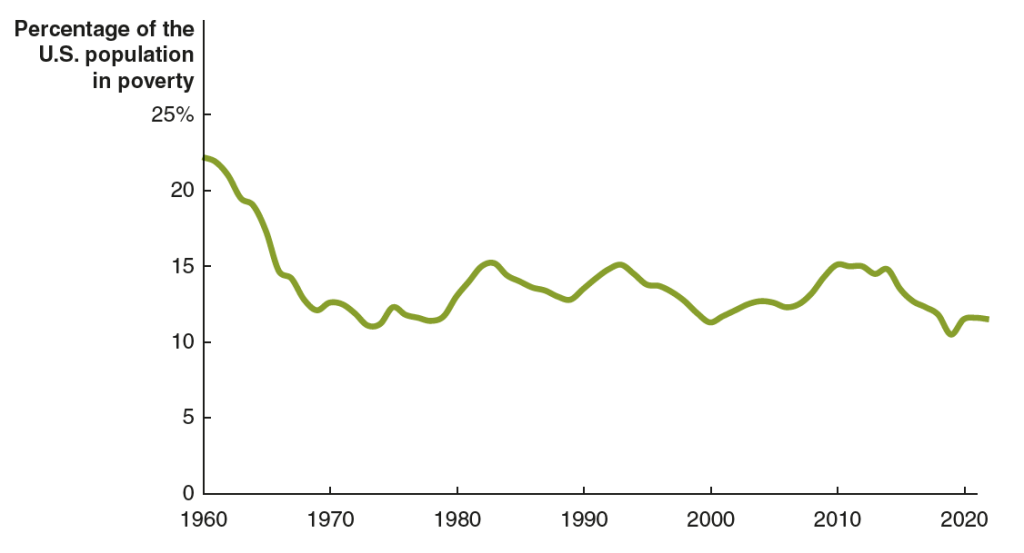
The following figure shows the official poverty rate for the years from 1960 to 2022. The poverty rate in 1960 was 22.2 percent. By 1973, it had been cut in half to 11.1 percent. The decline in the poverty rate largely stopped at that point. In the following years the official poverty rate fluctuated but stopped trending down. In 2022, the poverty rate was 11.5 percent—actually higher than in 1973. (The Census Bureau will release the poverty rate for 2023 later this month.)
But is the official poverty rate the best way to measure poverty? In Microeconomics, Chapter 17, Section 17.4 (Economics, Chapter 27, Section 27.4), we discuss some of the issues involved in measuring poverty. One key issue is how income should be measured for purposes of calculating the poverty rate. In an academic paper, Richard Burkhauser, of the University of Texas, Kevin Corinth, of the American Enterprise Institute, James Elwell, of the Congressional Joint Committee on Taxastion, and Jeff Larimore, of the Federal Reserve Board, carefully consider this issue. (The paper can be found here, although you may need a subscription or access through your library.)
They find that using an adjusted measure of the poverty line and a fuller measure of income results in the poverty rate falling from 19.5 percent in 1963 to 1.9 percent in 2019. In other words, rather than the poverty rate stagnating at around 11 percent—as indicated using the official poverty numbers—it actually fell dramatically. Rather than progress in the War on Poverty having stopped in the early 1970s, these results indicate that the war has largely been won. The authors, though, provide some important qualifications to this conclusion, including the fact that even 1.9 percent of the population represents millions of people.
Discussions of poverty distinguish between absolute poverty—the ability of a person or family to buy essential goods and services—and relative poverty—the ability to buy goods and services similar to those that can be purchased by individuals and families with the median income. The authors of this study argue that in launching the War on Povery, President Johnson intended to combat absolute poverty. Therefore, the authors start with the poverty line as it was in 1963 and increase the line each year by the rate of inflation, as measured by changes in the personal consumption expenditures (PCE) price index.
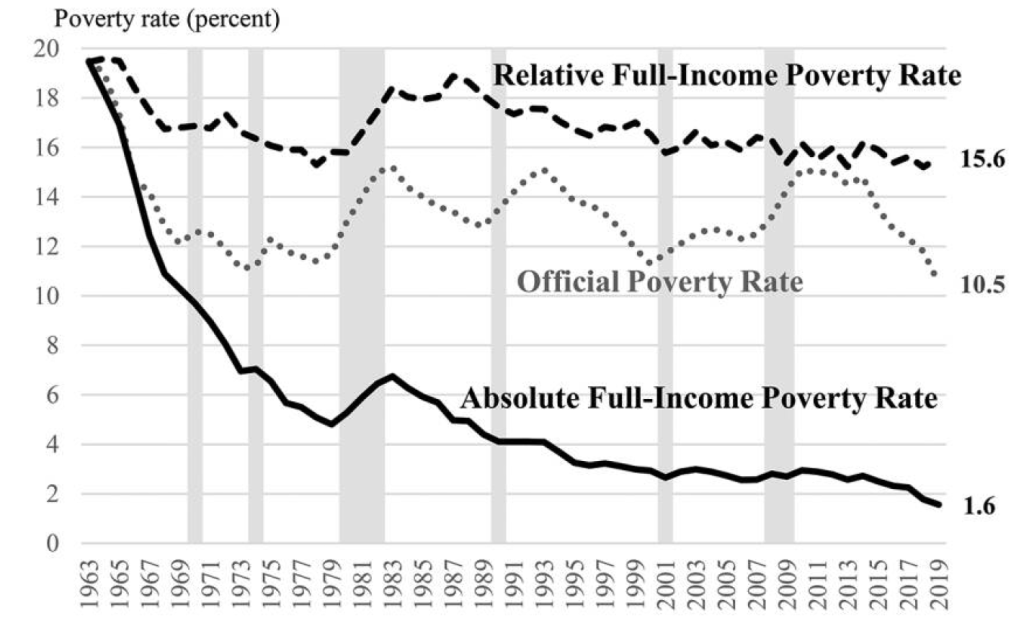
To calculate what they call “the absolute full-income poverty measure (FPM)” they include in income both cash income and “in-kind programs designed to fight poverty, including food stamps (now the Supplemental Nutrition Assistance Program [SNAP]), the schoollunch program, housing assistance, and health insurance.” As noted earlier, using this new definition, the overall poverty rate declined from 19.5 percent in 1963 to 1.9 percent in 2019. The Black poverty rate declined from 50.8 percent in 1963 to 2.9 percent in 2019.
The author’s find that the War on Poverty has been less successful in reducing relative poverty. Linking increases in the poverty line to increases in median income results in the poverty rate having decreased only from 19.5 percent in 1963 to 15.6 percent in 2019. The authors also note that not as much progress has been made in fulfilling President Johnson’s intention that: “The War on Poverty is not a struggle simply to support people, to make them dependent on the generosity of others.” They find that the fraction of working-age people who receive less than half their income from working has increased from 4.7 percent in 1967 to 11.0 percent in 2019.
The following figure from the authors’ paper shows the offical poverty rate, the absolute full-income poverty rate—which the authors believe does the best job of representing President Johnson’s intentions when he launched the War on Poverty—and the relative poverty rate.
Because of disagreements on how to define poverty and because of the difficulty of constructing comprehensive measures of income—difficulties that the authors discuss at length in the paper—this paper won’t be the last word in assessing the results of the War on Poverty. But the paper provides an important new discussion of the issues involved in measuring poverty.
