

Image of servers in a restaurant generated by ChatGTP-4o.
How should you track over time the real wagees of low-wage workers? If you are interested in income mobility, you would want to track the experience over the course of their working lives of individuals who began their careers in low-wage occupations. Doing so would allow you to measure how well (or poorly) the U.S. economy succeeds in providing individuals with opportunities to improve their incomes over time.
You might also be interested in how the real wages of people who earn low wages has changed over time. In this case, rather than tracing the wages over time of individuals who earn low wages when they first enter the labor market, you would look at the real wages of people who earn low wages at any given time. The simplest way to do that analysis would be using data on the average nominal wage earned by, say, the lowest 20 percent of wage earners, and deflate the average nominal wage by a price index to determine the average real wage of these workers. How the average real wage of low-wage workers varies over time provides some insight into the changing standard of living of low-wage workers.
In a recent Substack post, Ernie Tedeschi, Director of Economics at the Budget Lab research center at Yale University, has carried out a careful analysis of movements over time in the average real wage of low-wage workers. Tedeschi points out a complicating factor in this analysis: “The population has gotten older over time and more educated. The workforce looks different too, with more workers in services and fewer in manufacturing. Shifting populations means that comparisons of workers aren’t apples-to-apples over time.”
To correct for these confounding factors, Tedeschi constructs a low-wage index that makes it possible to examine the real wage of low-wage workers, holding constant the composition of low-wage workers with respect to “sex, age, race, college education, and broad industry and occupation” at the values of these characteristics in 2023. Using this approach, makes it possible to separate changes in wages of workers with given characteristics from changes in wages that occur because the average characteristics of workers has changed. For example, on average, workers who are older or who have more years of education will be more productive and, therefore, on average will earn higher wages than will workers who are younger or have fewer years of education.
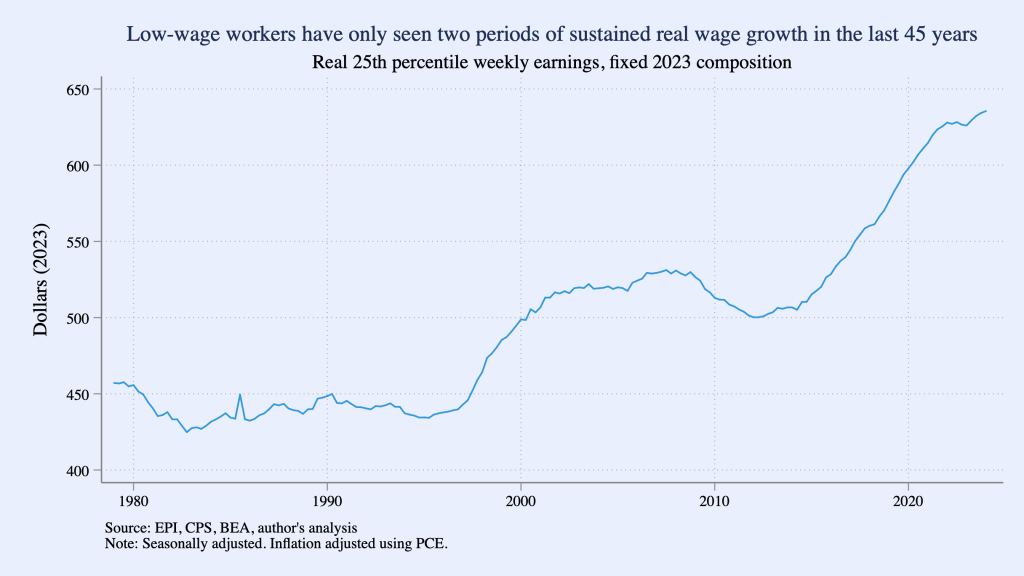
The following figure from Tedeschi’sSubstack post shows movements in his low-wage index during each quarter from the first quarter of 1979 to the first quarter of 2024, with “low wage” defined as workers at the 25th precentile of the distribution of wages. (That is, 24 percent of workers receive lower wages and 75 percent of workers receive higher wages than do these workers.) The index shows that a low-wage worker in 2024 has a much higher real wage than a low-wage worker in 1979, but the increase in the average real wage occurs mainly during two periods: 1997–2007 and 2014–2024. (Tedeschi uses the person consumption expenditures (PCE) price index to convert nominal wages to real wages.)
A more complete discussion of Tedeschi’s methods and results can be found in his blog post.
