Photo courtesy of Lena Buonanno
Today (January 31), the BEA released monthly data on the PCE as part of its Personal Income and Outlays report. In addition, the Bureau of Labor Statistics (BLS) released quarterly data on the Employment Cost Index (ECI).
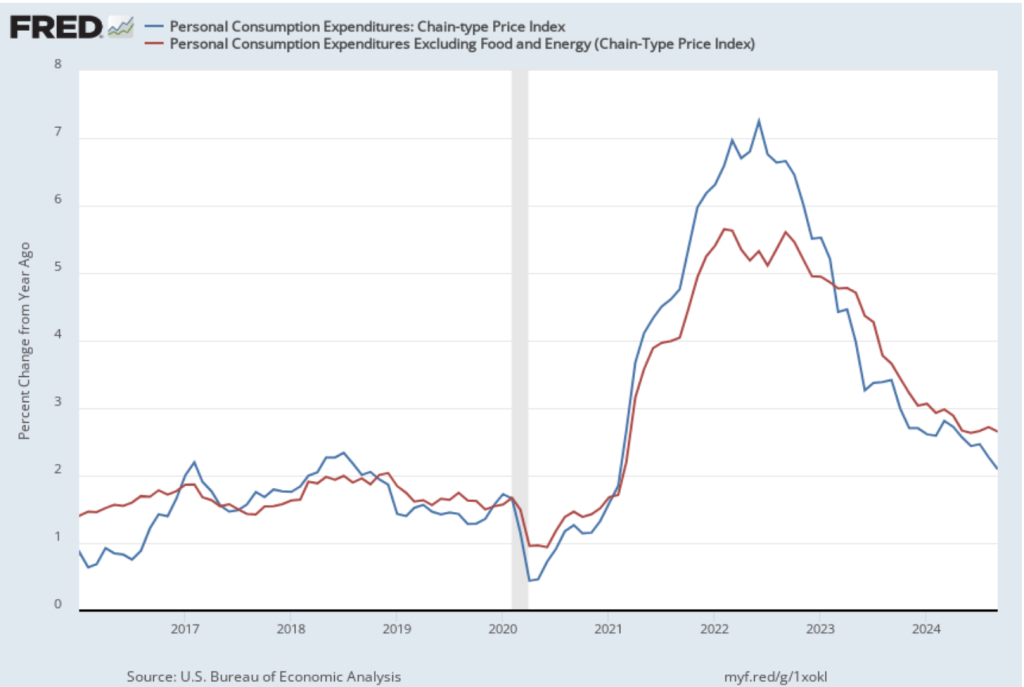
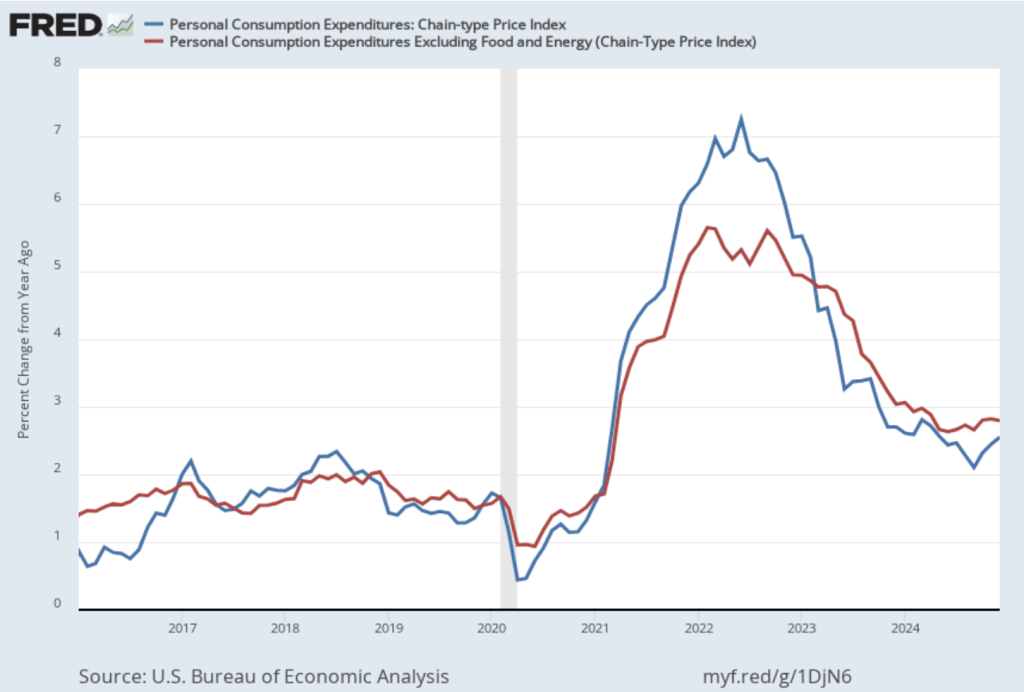
The Fed relies on annual changes in the PCE price index to evaluate whether it’s meeting its 2 percent annual inflation target. The following figure shows PCE inflation (blue line) and core PCE inflation (red line)—which excludes energy and food prices—for the period since January 2016 with inflation measured as the percentage change in the PCE from the same month in the previous year. Measured this way, in December PCE inflation (the blue line) was 2.8 percent, unchanged from November. Core PCE inflation (the red line) in December was also 2.8 percent, unchanged from November.
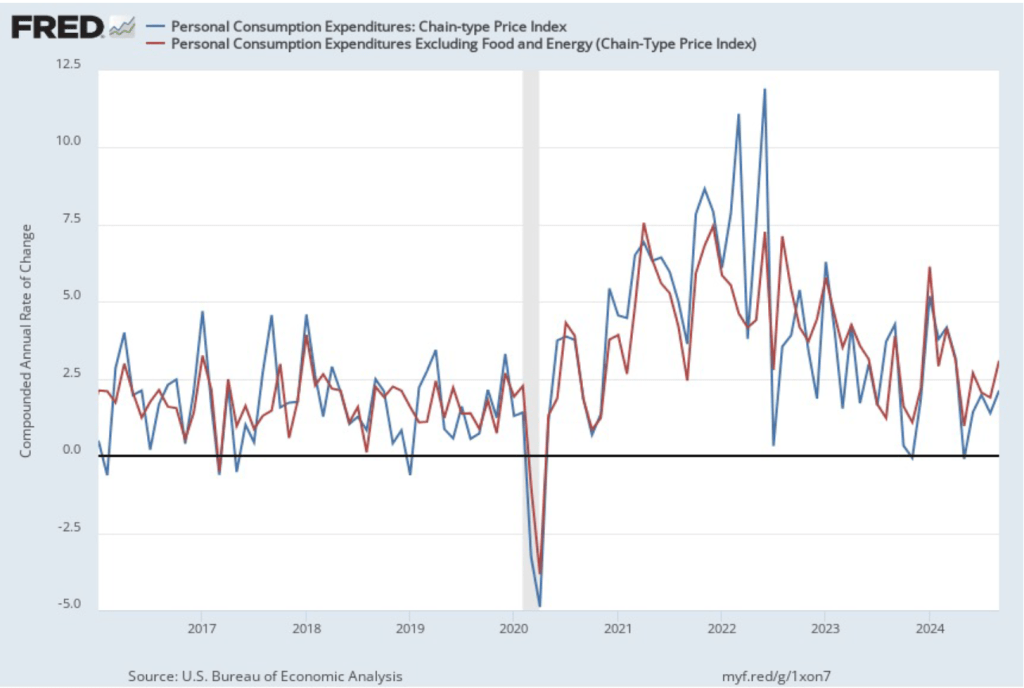
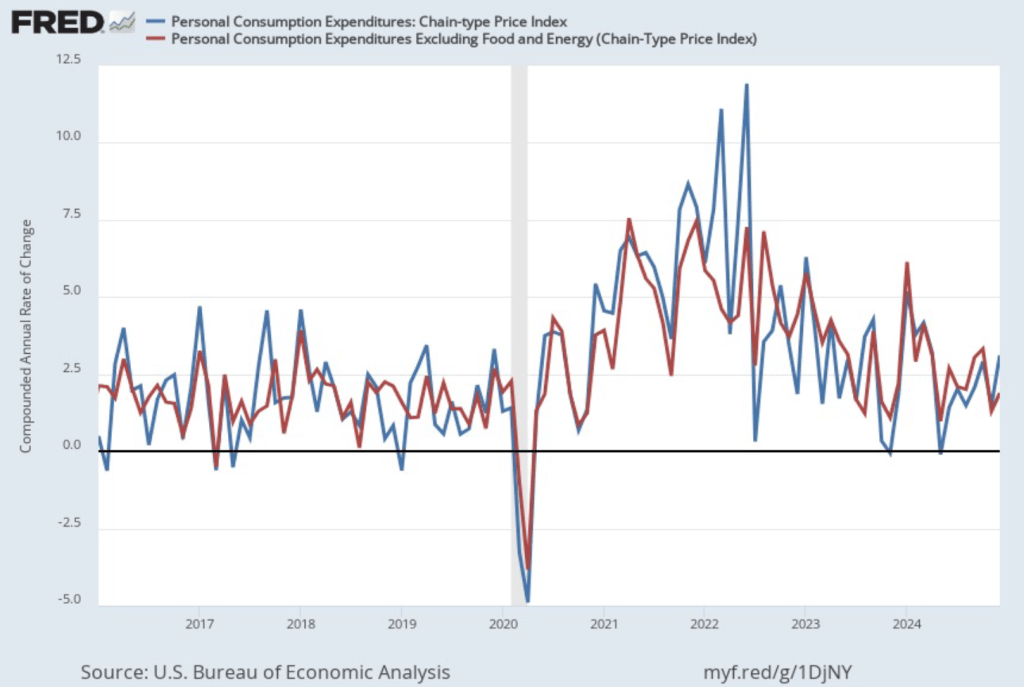
The following figure shows PCE inflation and core PCE inflation calculated by compounding the current month’s rate over an entire year. (The figure above shows what is sometimes called 12-month inflation, while this figure shows 1-month inflation.) Measured this way, PCE inflation rose in December to 3.1 percent from 1.5 percent in November. Core PCE inflation rose in December to 1.9 percent from to 1.3 percent in November. Core inflation is generally a better measure of the underlying trend in inflation. So, 1-month core PCE inflation running below the Fed’s 2 percent target is an encouraging sign. But the usual caution applies that 1-month inflation figures are volatile (as can be seen in the figure), so data from one month shouldn’t be overly relied on.
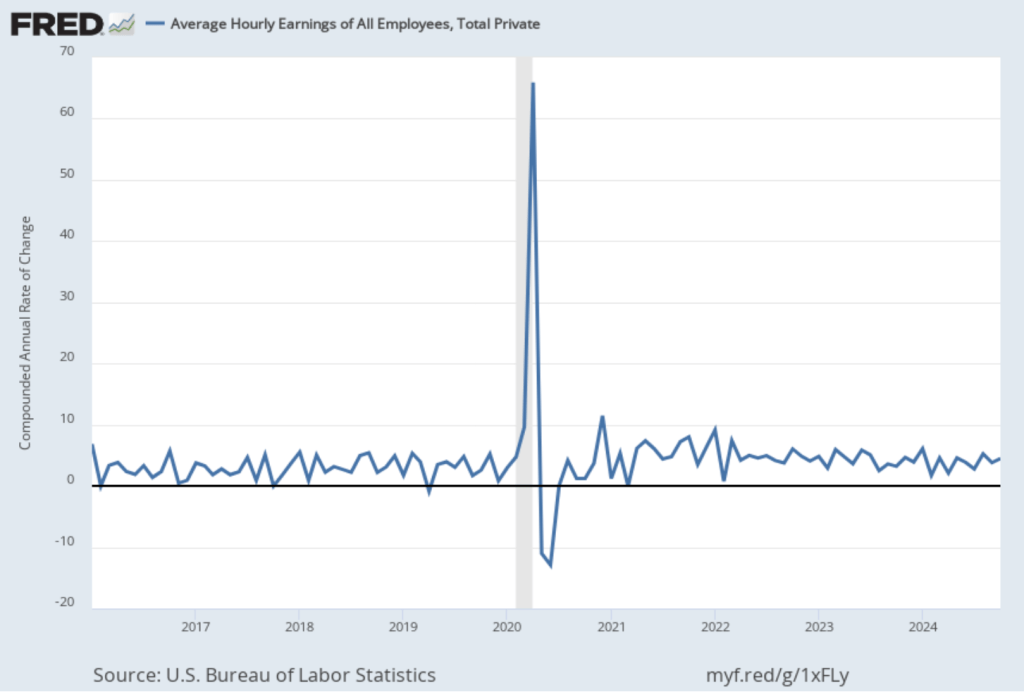
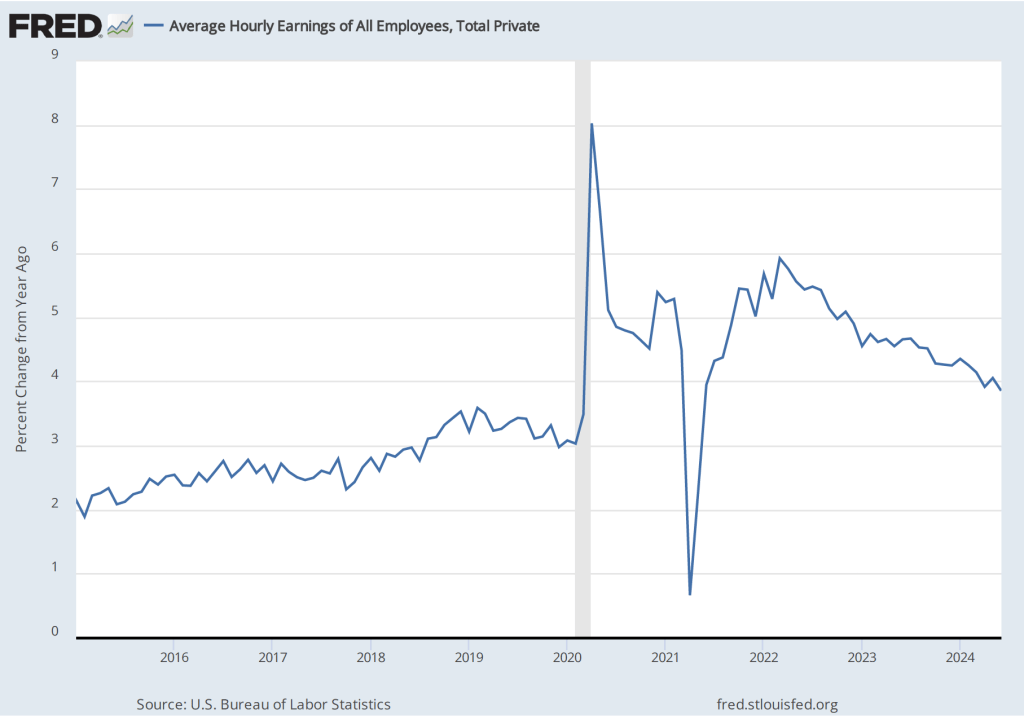
Turning to wages, as we’ve noted in earlier posts, the Fed’s policymaking Federal Open Market Committee (FOMC) prefers the employment cost index (ECI) to average hourly earnings (AHE) as a measure of the increase in labor costs.
The AHE is calculated by adding all of the wages and salaries workers are paid—including overtime and bonus pay—and dividing by the total number of hours worked. As a measure of how wages are increasing or decreasing during a particular period, AHE can suffer from composition effects because AHE data aren’t adjusted for changes in the mix of occupations workers are employed in. For example, during a period in which there is a decline in the number of people working in occupations with higher-than-average wages, perhaps because of a downturn in some technology industries, AHE may show wages falling even though the wages of workers who are still employed have risen. In contrast, the ECI holds constant the mix of occupations in which people are employed. The ECI does have this drawback: It is only available quarterly whereas the AHE is available monthly.
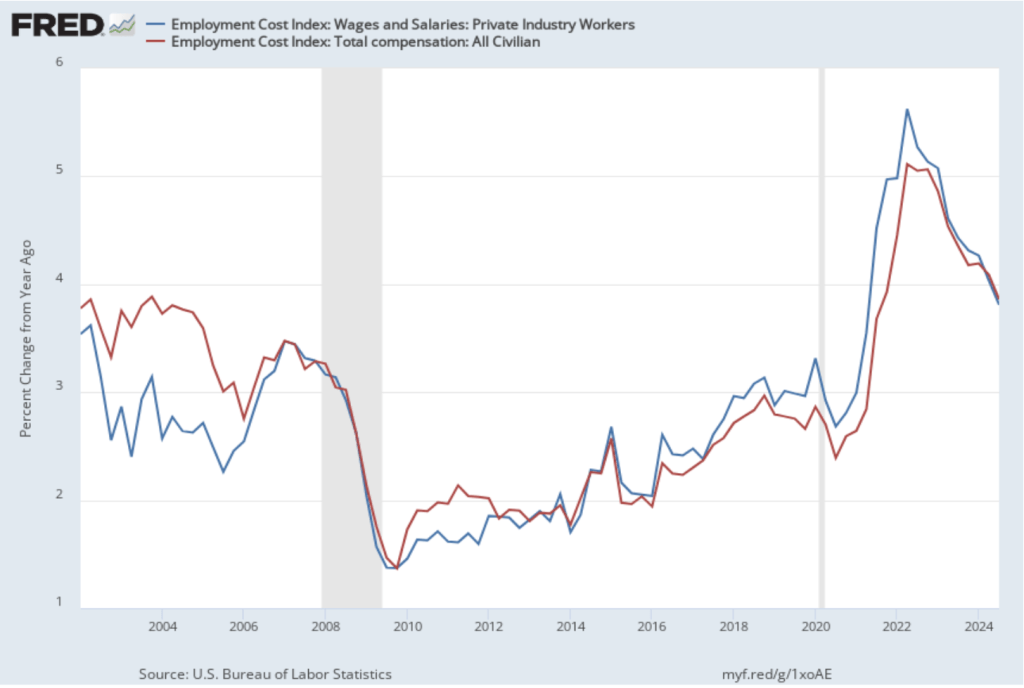
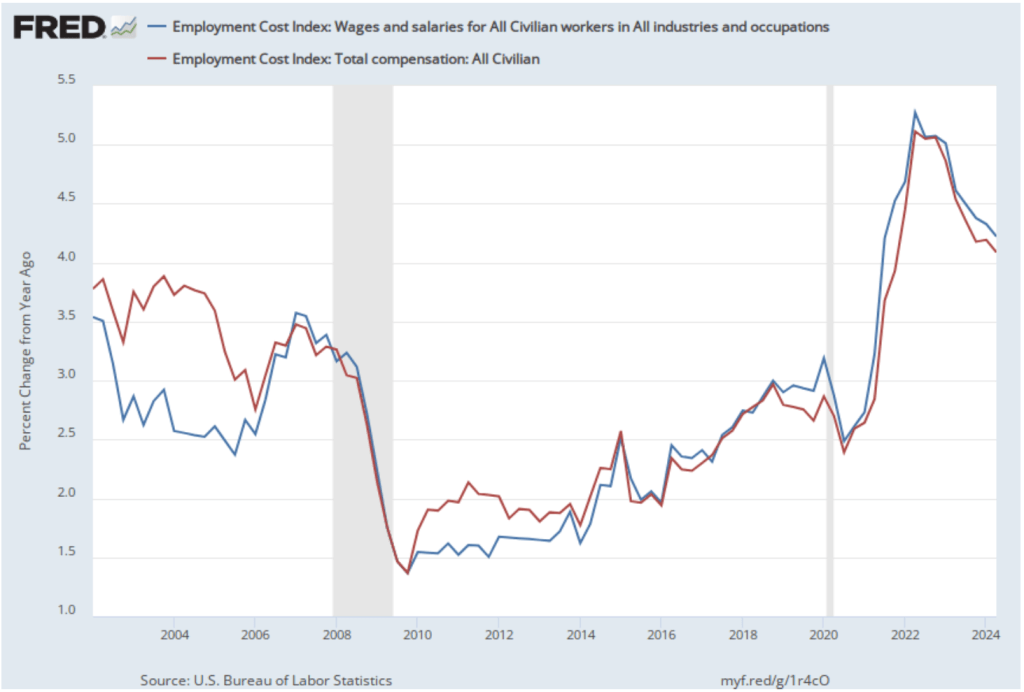
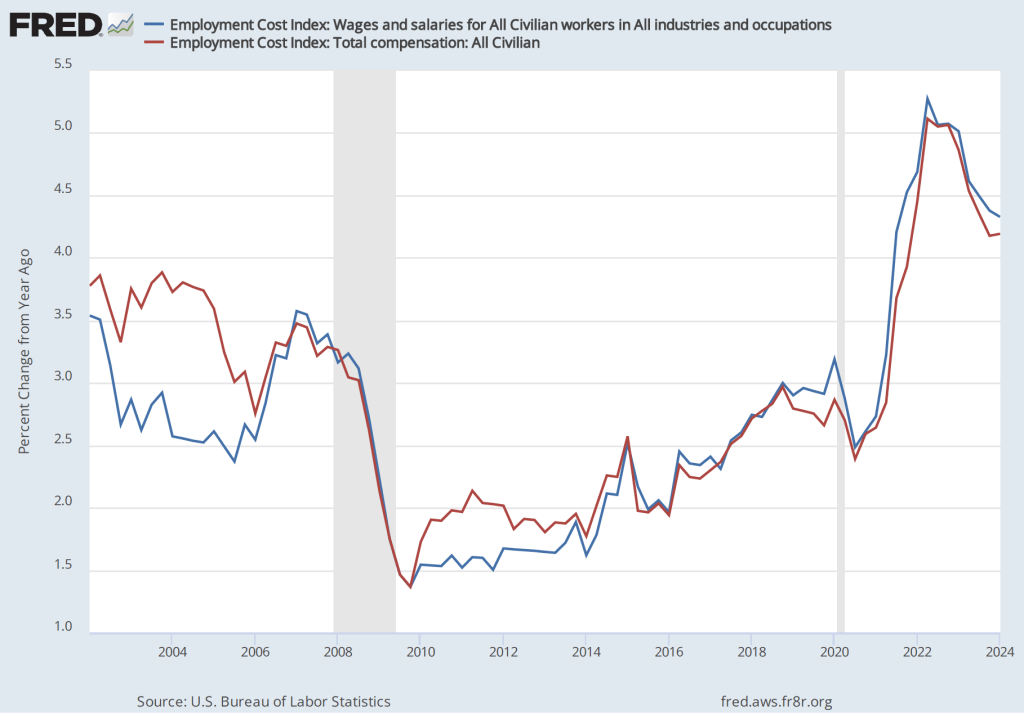
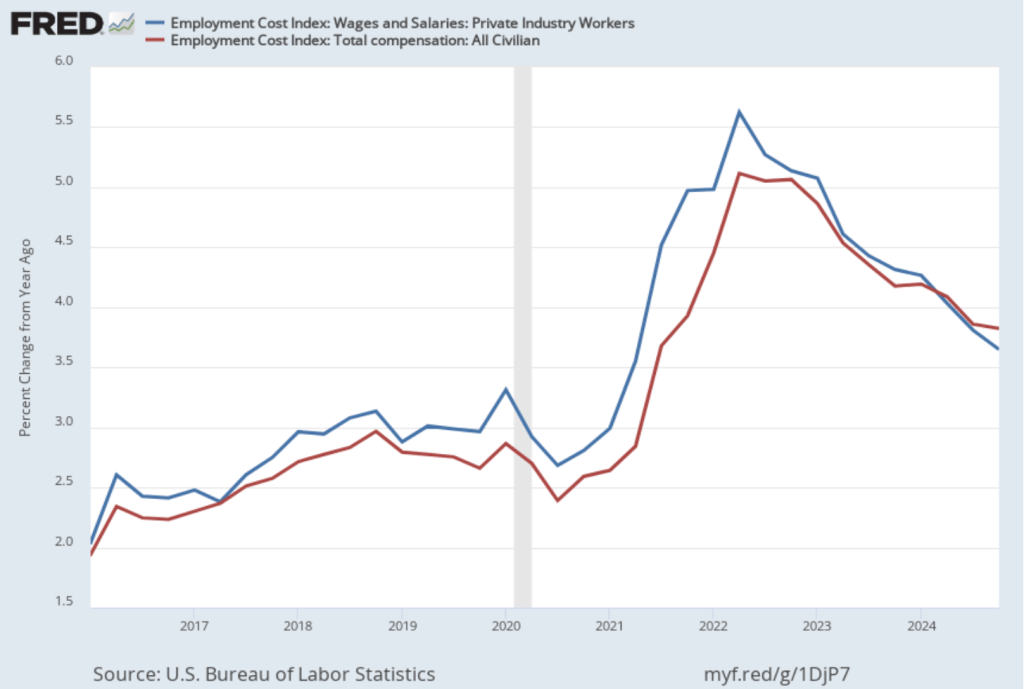
The data released this morning indicate that labor costs continue to increase at a rate that is higher than the rate that is likely needed for the Fed to hit its 2 percent price inflation target. The following figure shows the percentage change in the ECI from the same quarter in the previous year. The blue line shows only wages and salaries of private industry workers, while the red line shows total compensation, including non-wage benefits like employer contributions to health insurance, for all civilian workers. The two measures of wage inflation follow similar paths. The rate of increase in the wage and salary measure decreased slightly from 3.9 percent in the third quarter of 2024 to 3.8 percent in the fourth quarter. The movement in the rate of increase in compensation was very similar, also decreasing from 3.9 percent in the third quarter of 2024 to 3.8 percent in the fourth quarter.
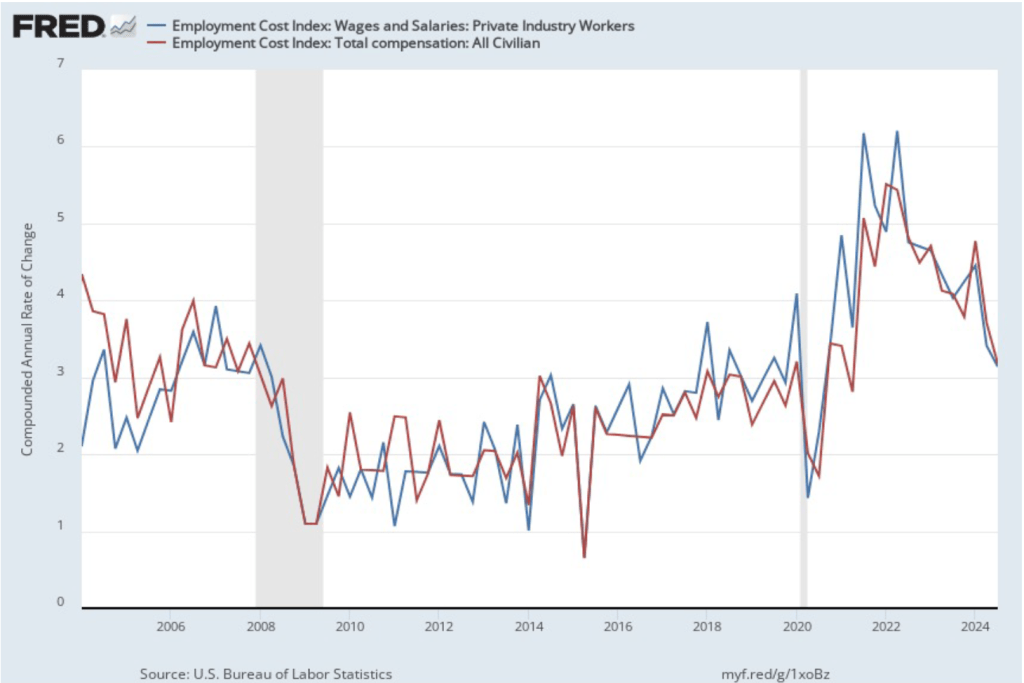
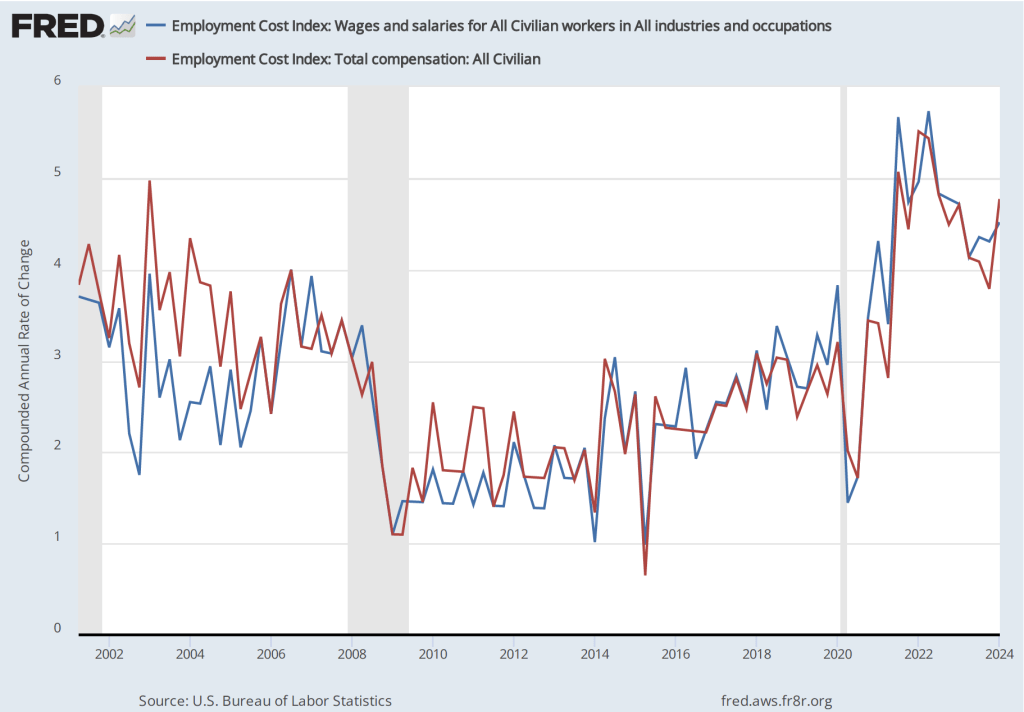
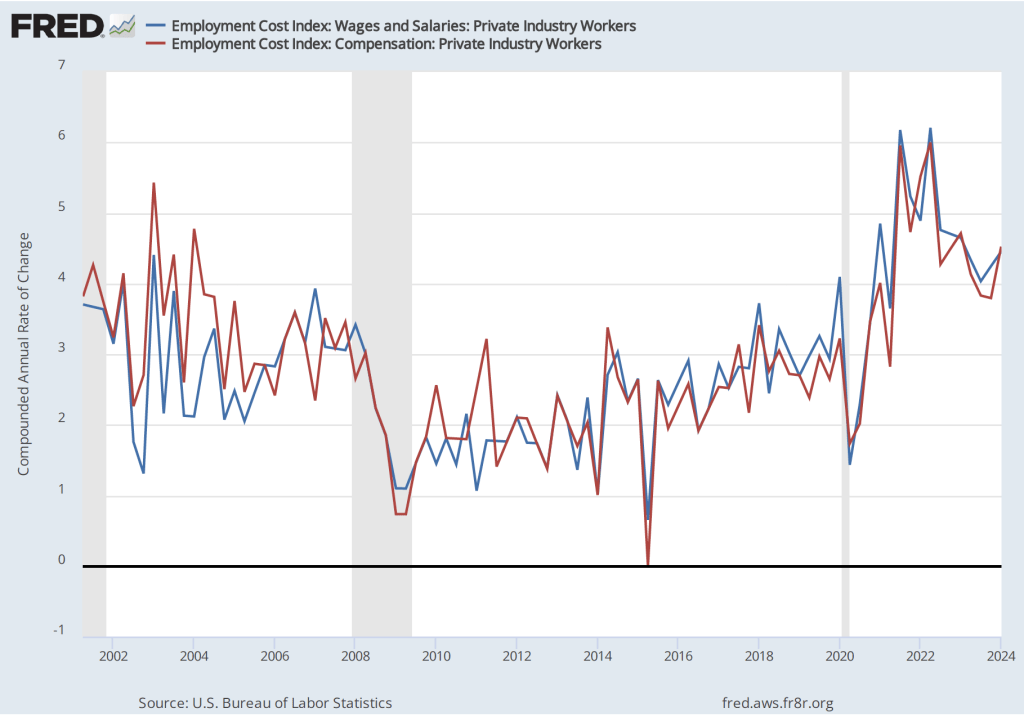
If we look at the compound annual growth rate of the ECI—the annual rate of increase assuming that the rate of growth in the quarter continued for an entire year—we find that the rate of increase in wages and salaries increased from 3.1 percent in the third quarter of 2024 to 3.6 percent in the fourth quarter. Similarly, the rate of increase in compensation increased from 3.2 percent in the fourth quarter of 2024 to 3.6 percent in the fourth quarter. So, this measure indicates that there has been some increase in the rate of wage inflation in the fourth quarter, although, again, we have to use caution in interpreting data from only one quarter.

Taken together, the PCE and ECI data released today indicate that the Fed still has a way to go before bringing about a soft landing—returning inflation to its 2 percent target without pushing the economy into a recession.