Image generated by ChatGTP-4o of someone shopping for clothes.
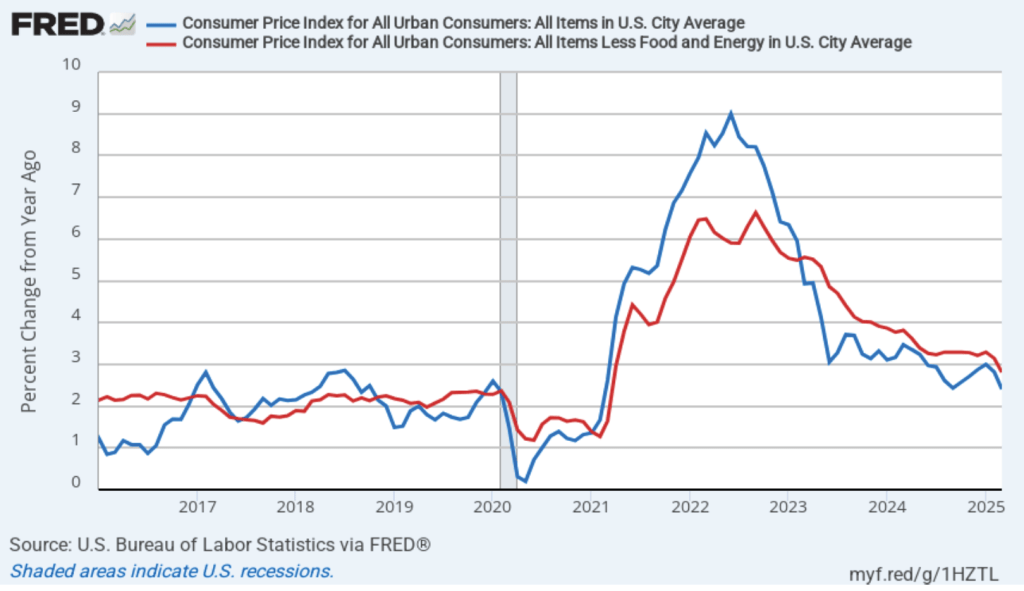
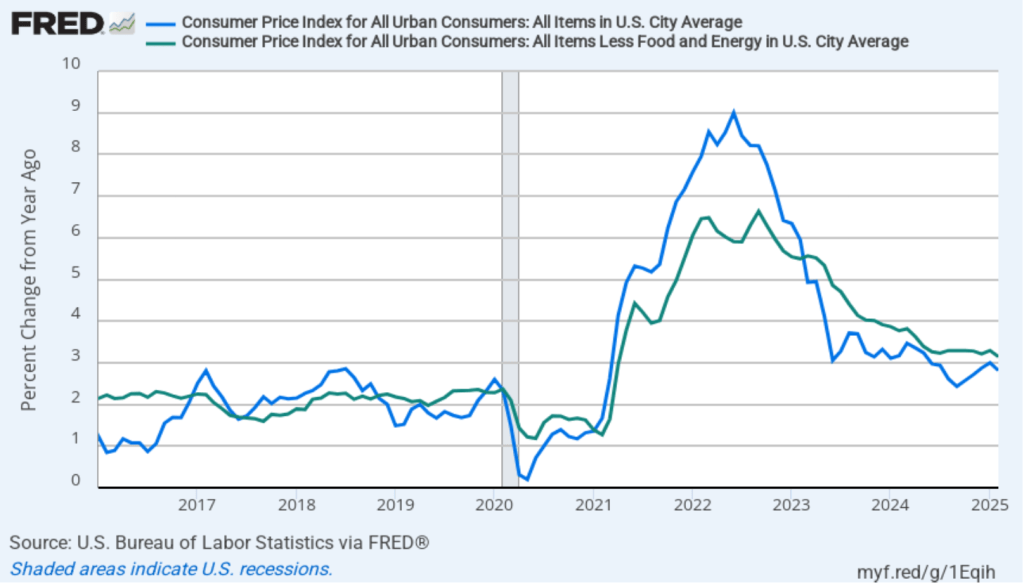
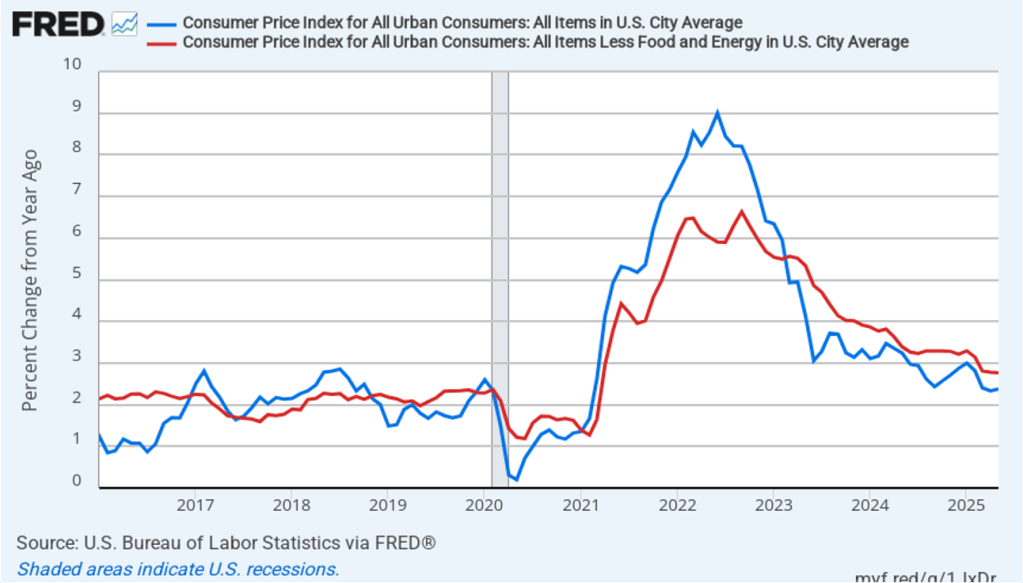
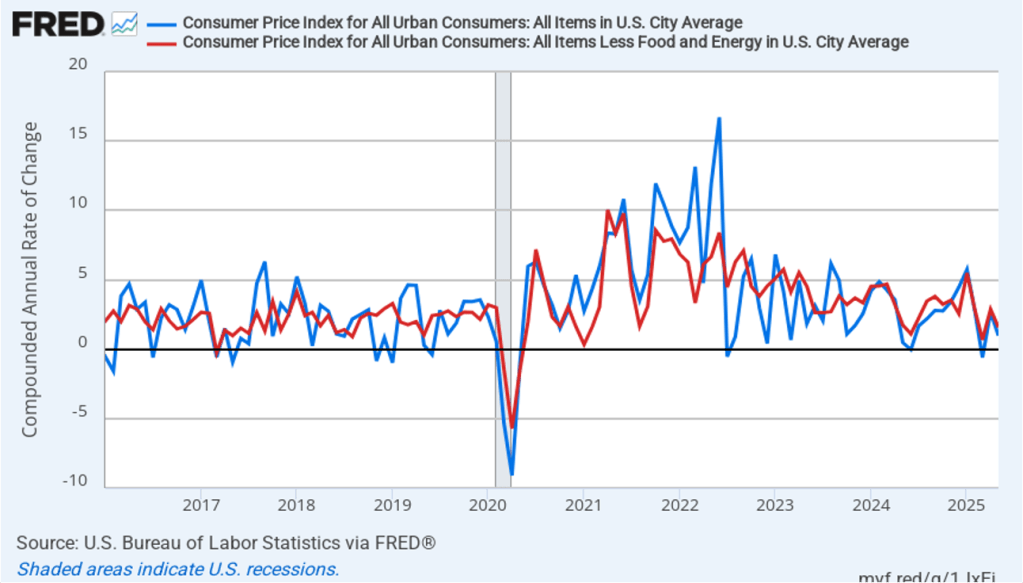
Today (June 11), the Bureau of Labor Statistics (BLS) released its report on the consumer price index (CPI) for May. The following figure compares headline CPI inflation (the blue line) and core CPI inflation (the green line).
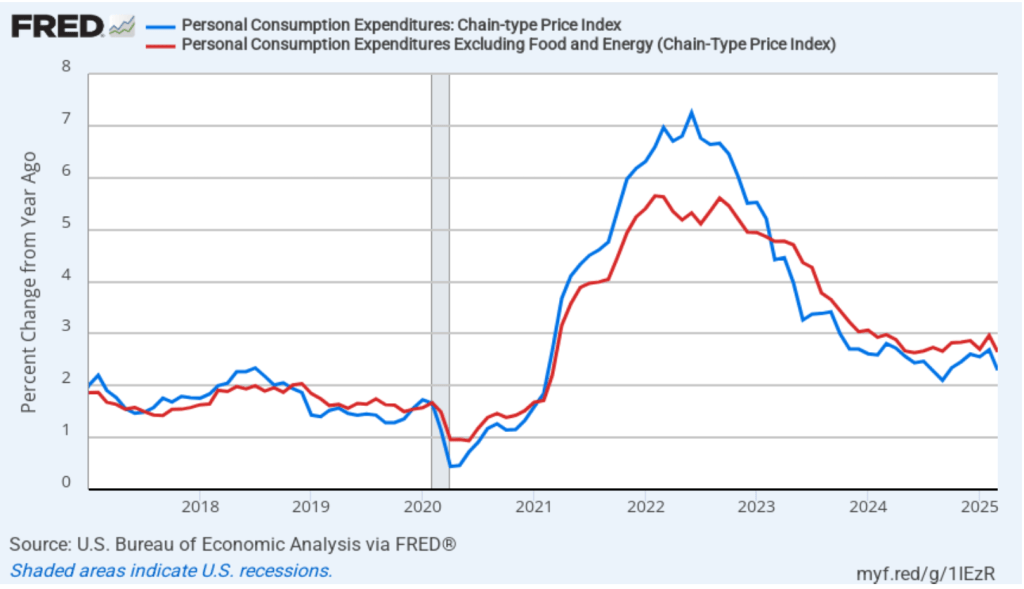
- The headline inflation rate, which is measured by the percentage change in the CPI from the same month in the previous year, was 2.4 percent in May—up slightly from 2.3 percent in April.
- The core inflation rate, which excludes the prices of food and energy, was 2.9 percent in May—up slightly from 2.8 percent in April.
Headline inflation was slightly lower and core inflation was the same as what economists surveyed had expected.
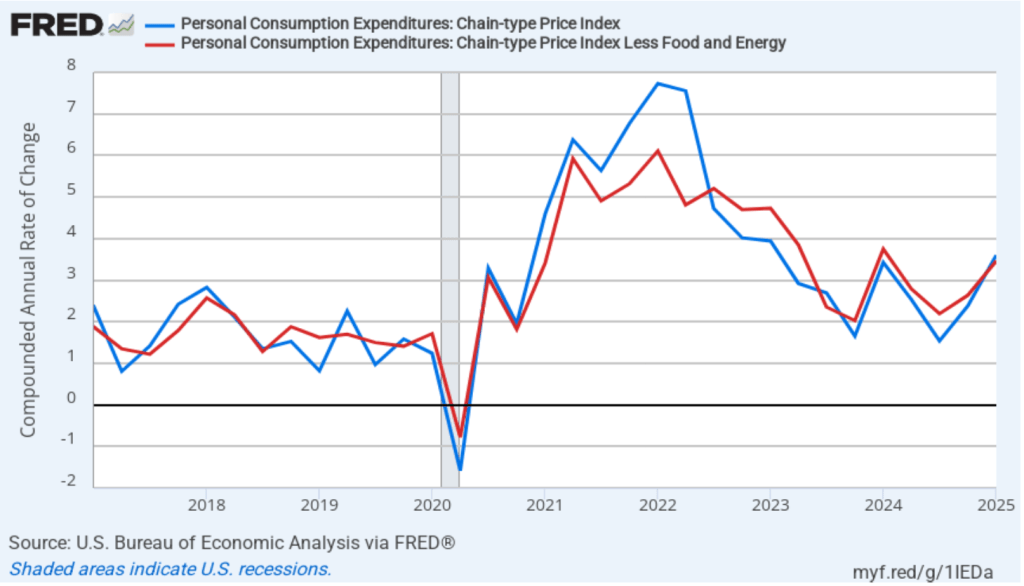
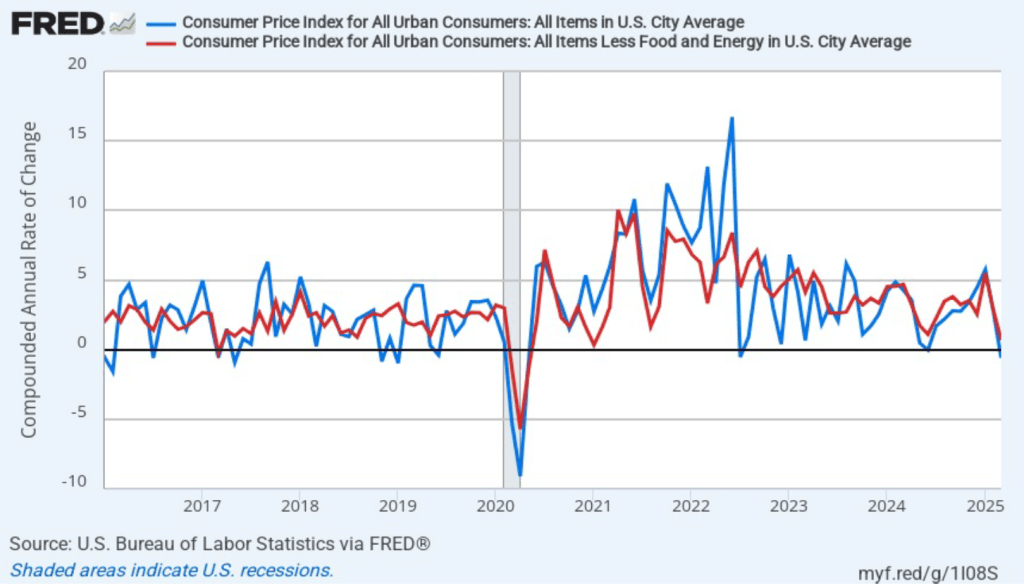
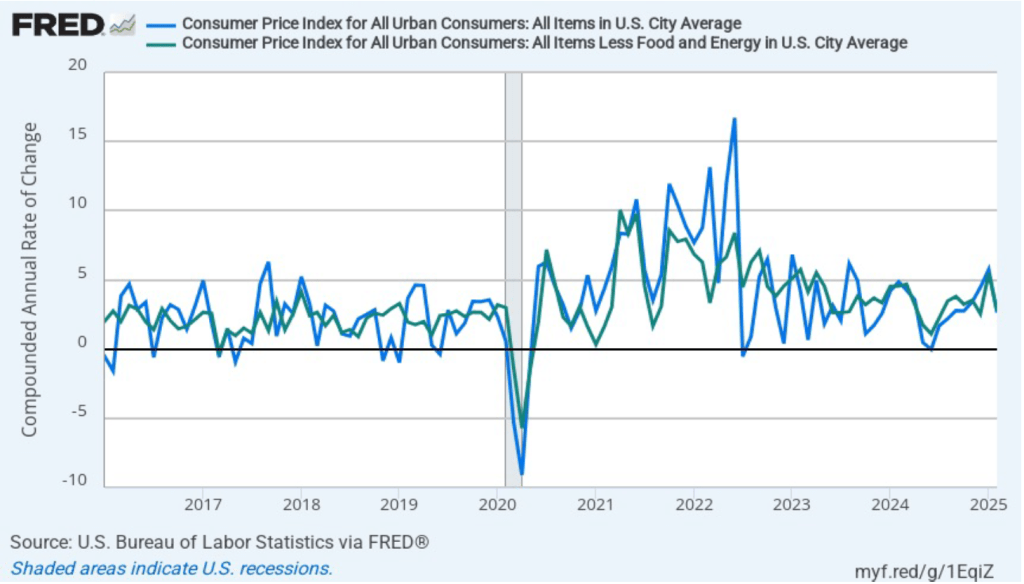
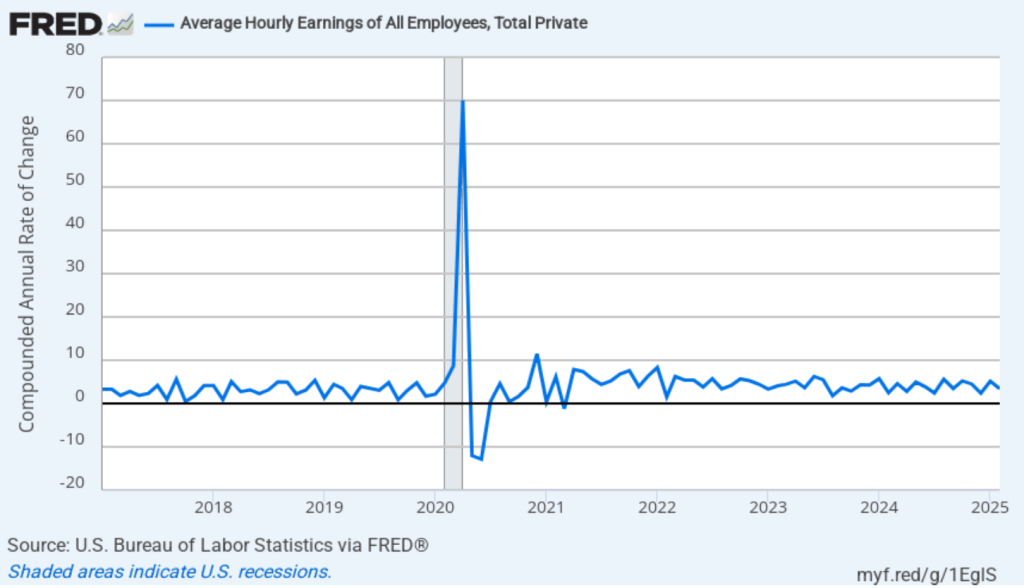
In the following figure, we look at the 1-month inflation rate for headline and core inflation—that is the annual inflation rate calculated by compounding the current month’s rate over an entire year. Calculated as the 1-month inflation rate, headline inflation (the blue line) decreased from 2.7 percent in April to 1.0 percent in May. Core inflation (the red line) decreased from 2.9 percent in April to 1.6 percent in May.
The 1-month and 12-month inflation rates are telling different stories, with 12-month inflation indicating that the rate of price increase is running slightly above the Fed’s 2 percent inflation target. The 1-month inflation rate indicates a significant slowing of inflation during May.
Of course, it’s important not to overinterpret the data from a single month. The figure shows that the 1-month inflation rate is particularly volatile. Also note that the Fed uses the personal consumption expenditures (PCE) price index, rather than the CPI, to evaluate whether it is hitting its 2 percent annual inflation target.
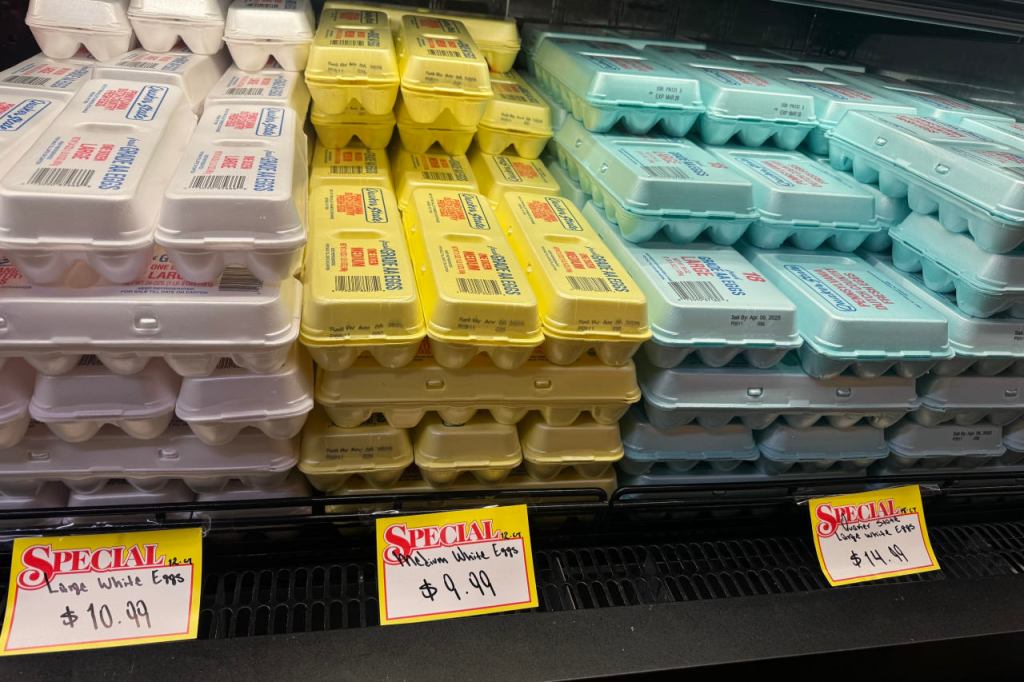
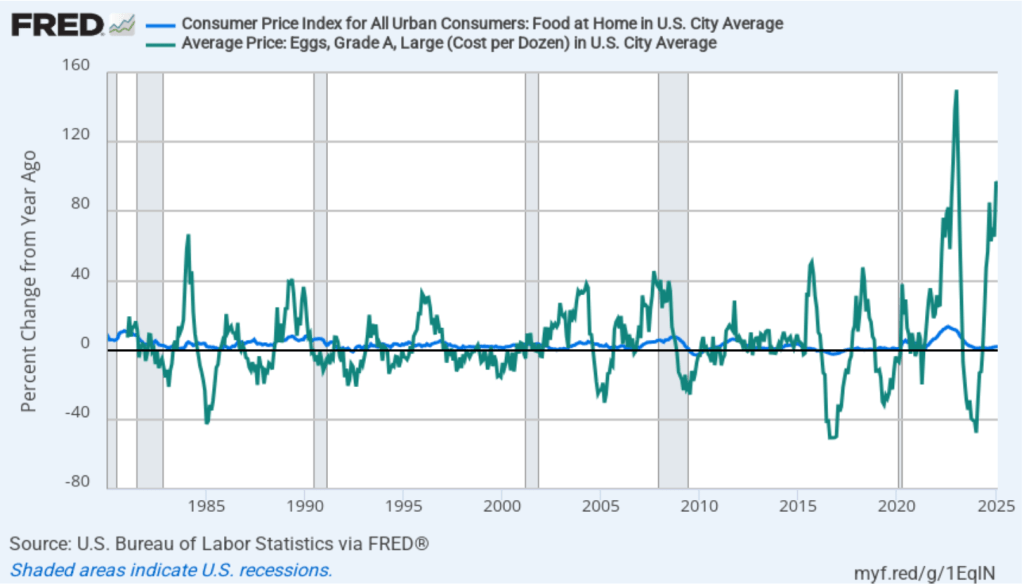
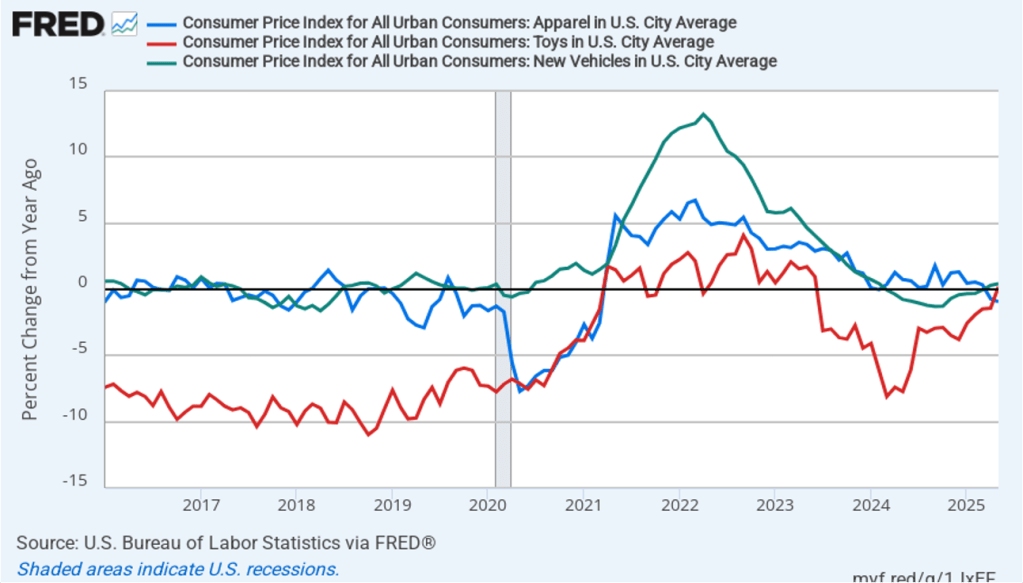
One of the key questions facing Federal Reserve policymakers is to what extent inflation will be affected by the increase in tariffs that the Trump administration announced on April 2. The following figure shows 12-month inflation in three categories of products whose prices are thought to be particularly vulnerable to the effects of tariffs: apparel (the blue line), toys (the red line), and motor vehicles (the green line). In May, prices of apparel fell, while the prices of toys and motor vehicles rose by less than 0.5 percent.
The following figure shows 1-month inflation in these categories. In May, the prices of apparel and motor vehicles fell, while the price of toys soared by 17.4 percent, but that followed a decline of 10.3 percent in April.
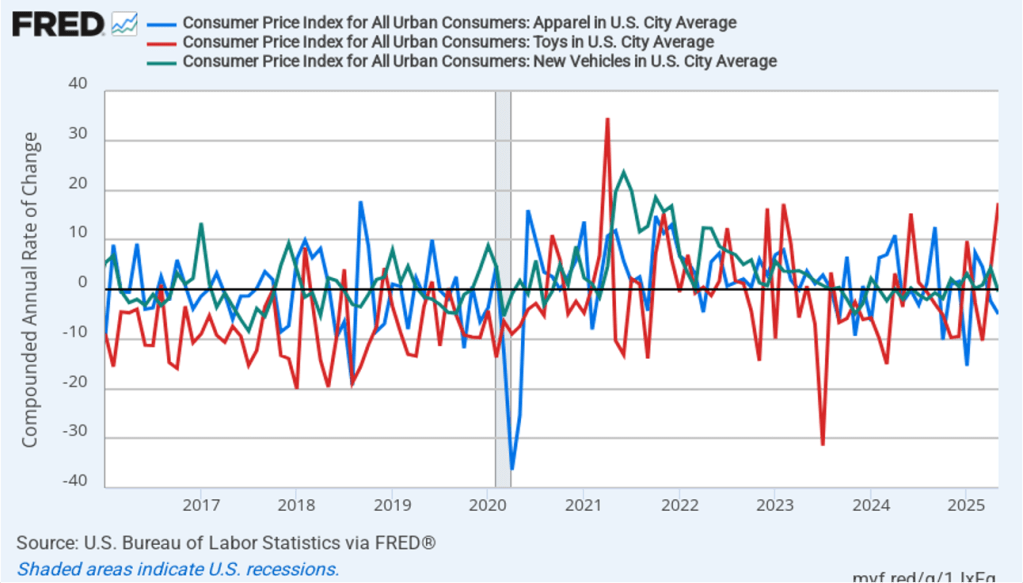
Taken together this month’s CPI data don’t show much effect of tariffs on inflation. It’s possible that some of the effects of the tariffs have been cushioned by firms increasing their inventories earlier in the year in anticipation of price increases resulting from the tariffs. If so, as firms draw down their inventories, we may see tariff-related increases in the prices of some goods later in the year.
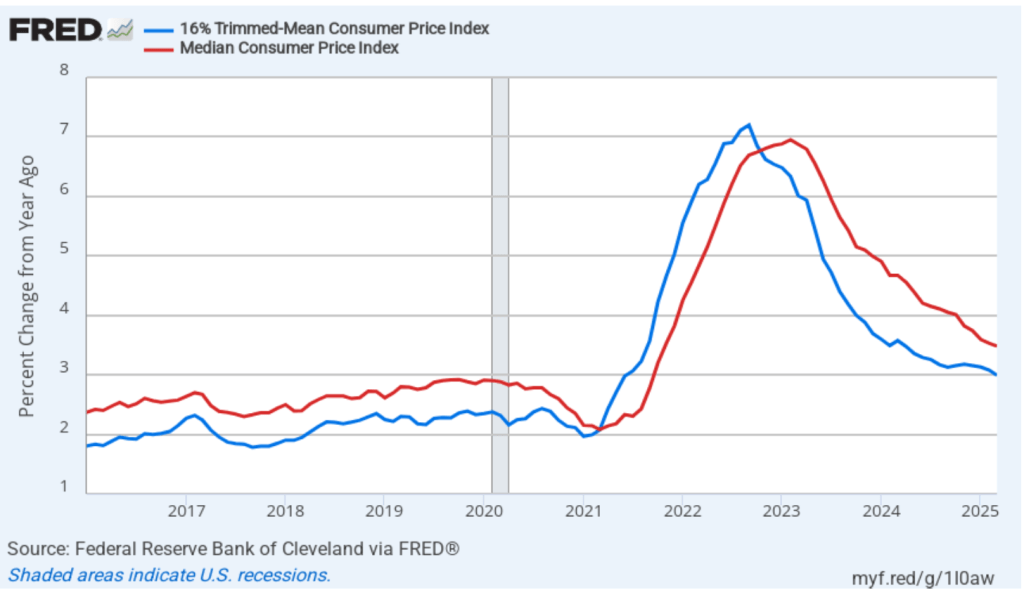
To better estimate the underlying trend in inflation, some economists look at median inflation and trimmed mean inflation.
- Median inflation is calculated by economists at the Federal Reserve Bank of Cleveland and Ohio State University. If we listed the inflation rate in each individual good or service in the CPI, median inflation is the inflation rate of the good or service that is in the middle of the list—that is, the inflation rate in the price of the good or service that has an equal number of higher and lower inflation rates.
- Trimmed-mean inflation drops the 8 percent of goods and services with the highest inflation rates and the 8 percent of goods and services with the lowest inflation rates.
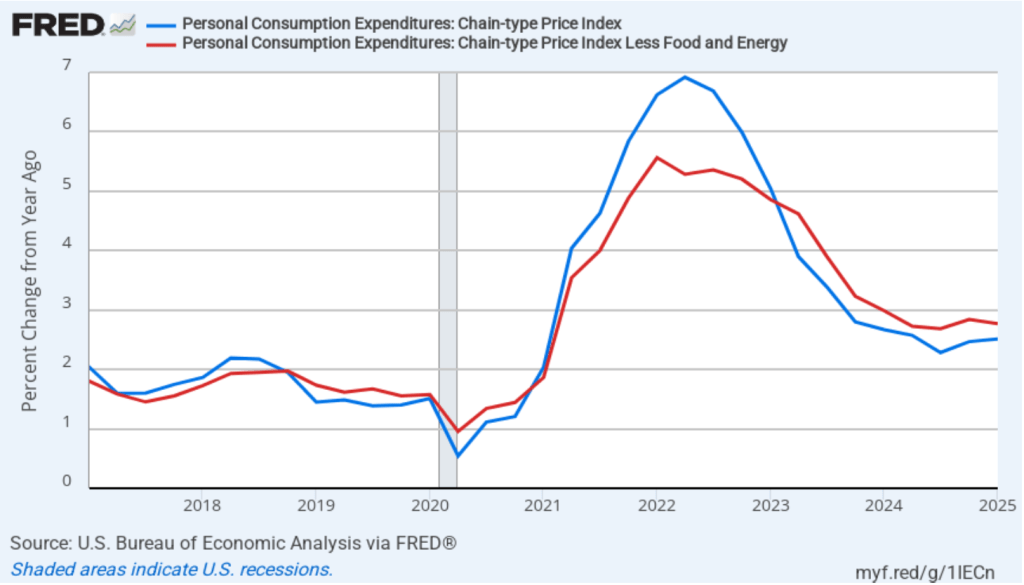
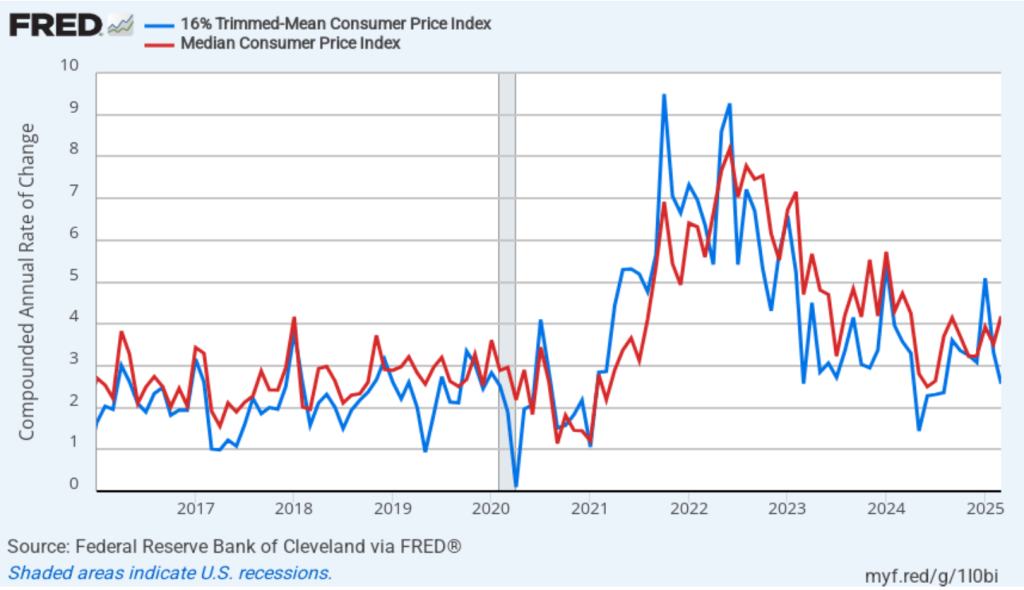
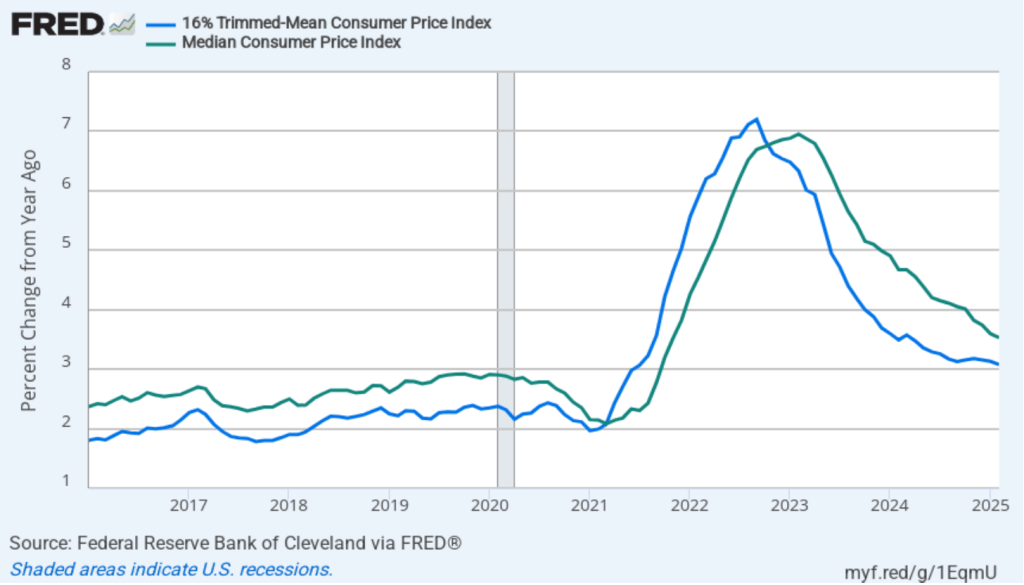
The following figure shows that 12-month trimmed-mean inflation (the blue line) was 3.0 percent in May, unchanged from April. Twelve-month median inflation (the red line) 3.5 percent in May, also unchanged from April.
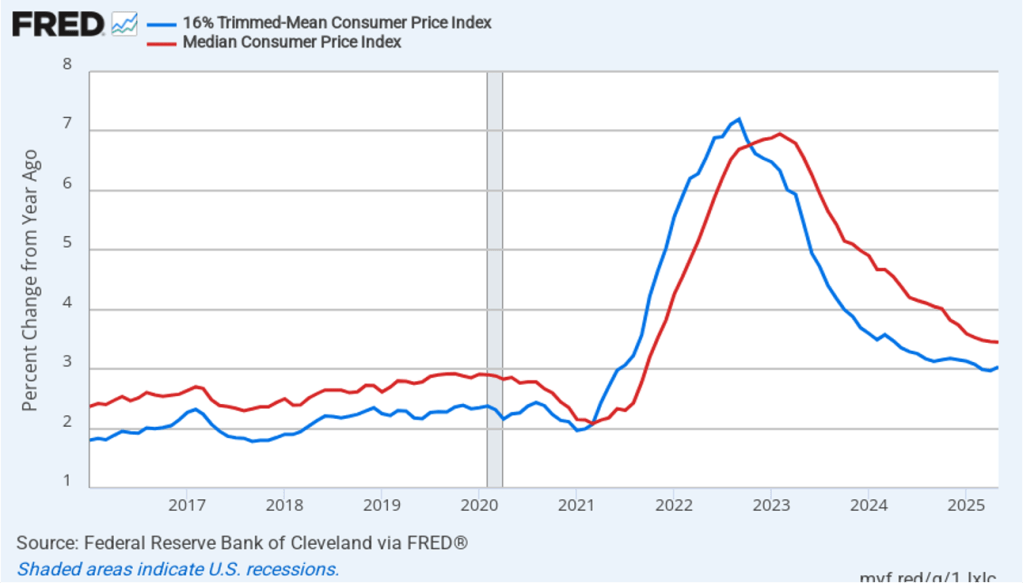
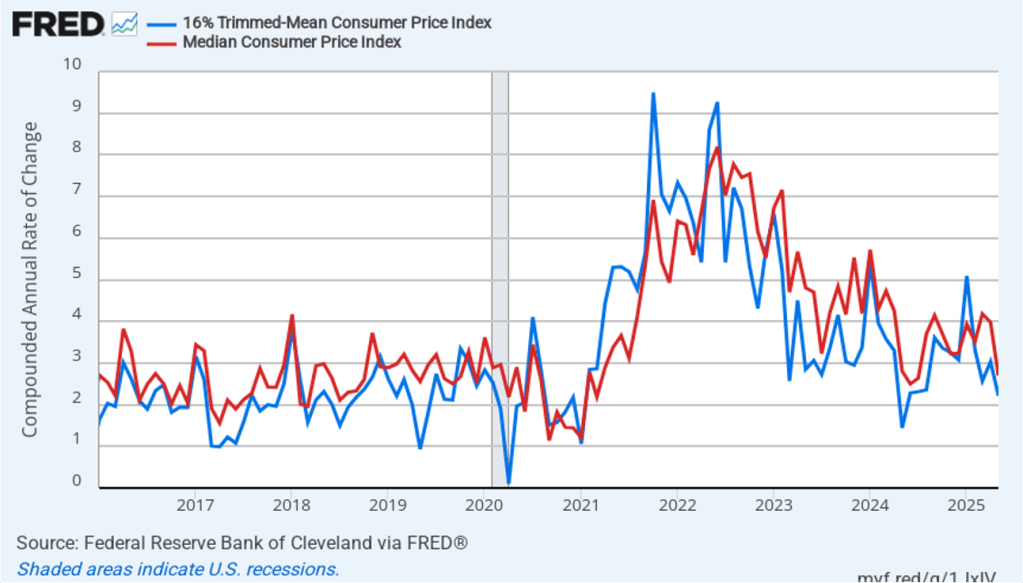
The following figure shows 1-month trimmed-mean and median inflation. One-month trimmed-mean inflation decreased from 3.0 percent in April to 2.2. percent in May. One-month median inflation declined from 4.0 percent in April to 2.7 percent in May. These data provide some confirmation that inflation likely fell somewhat from April to May.
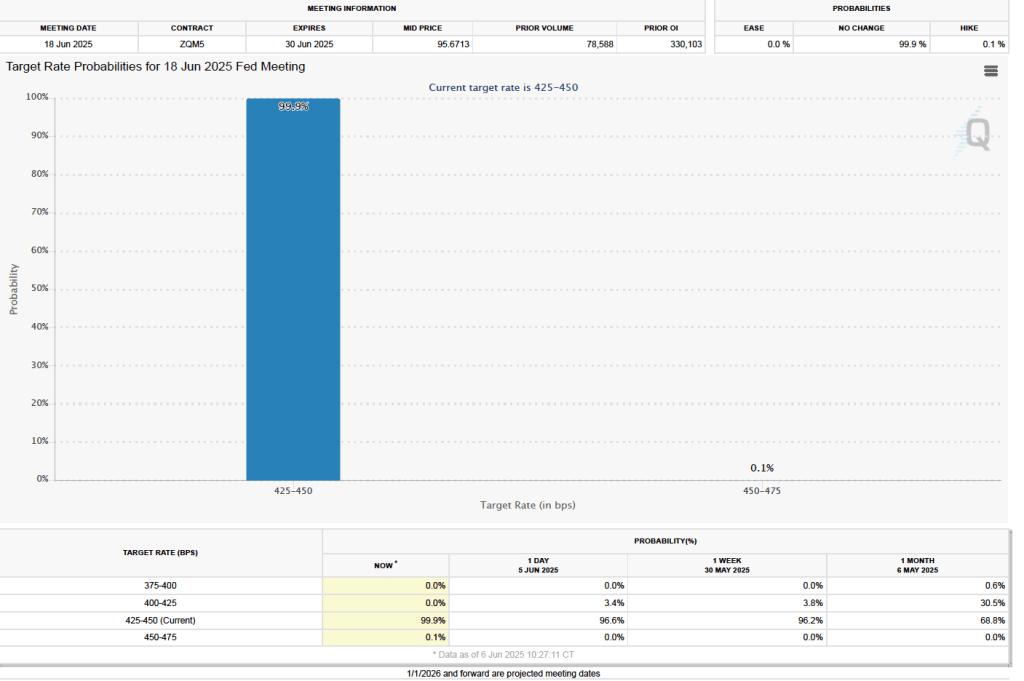
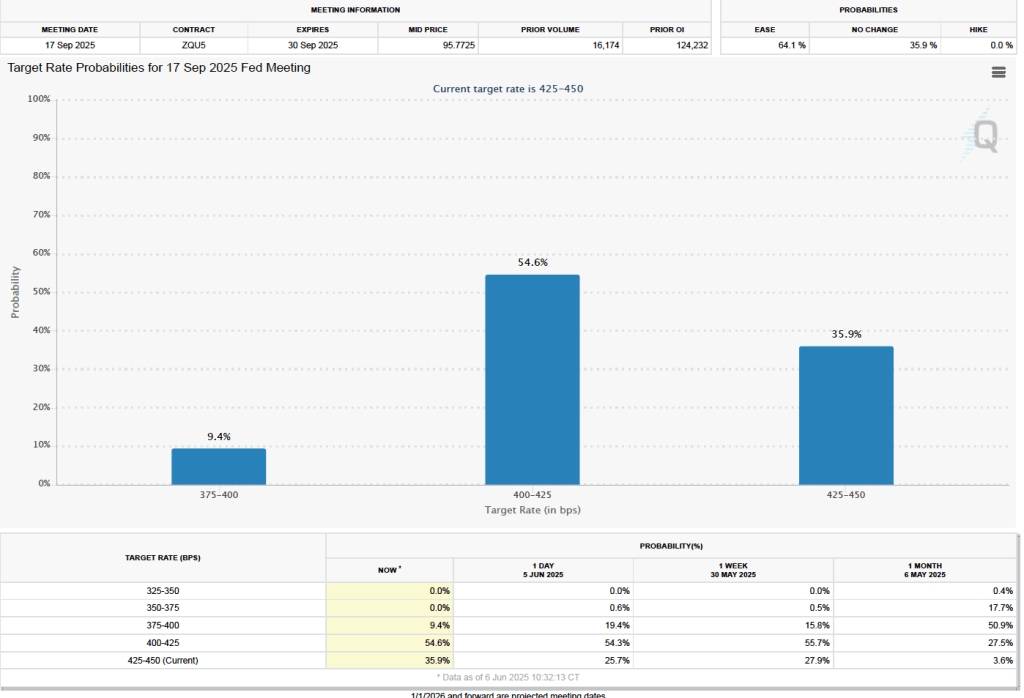
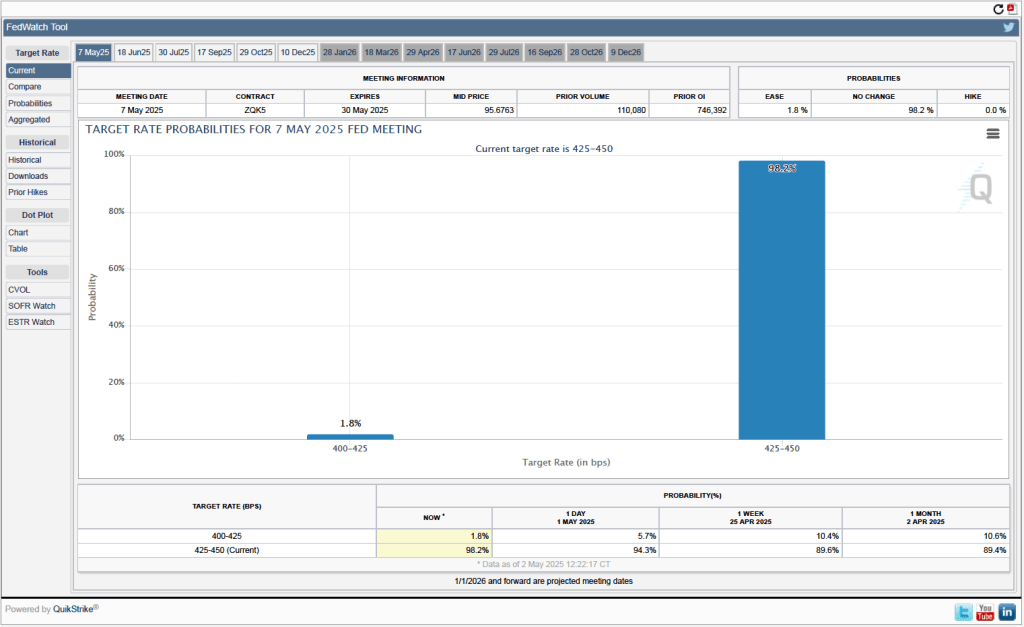
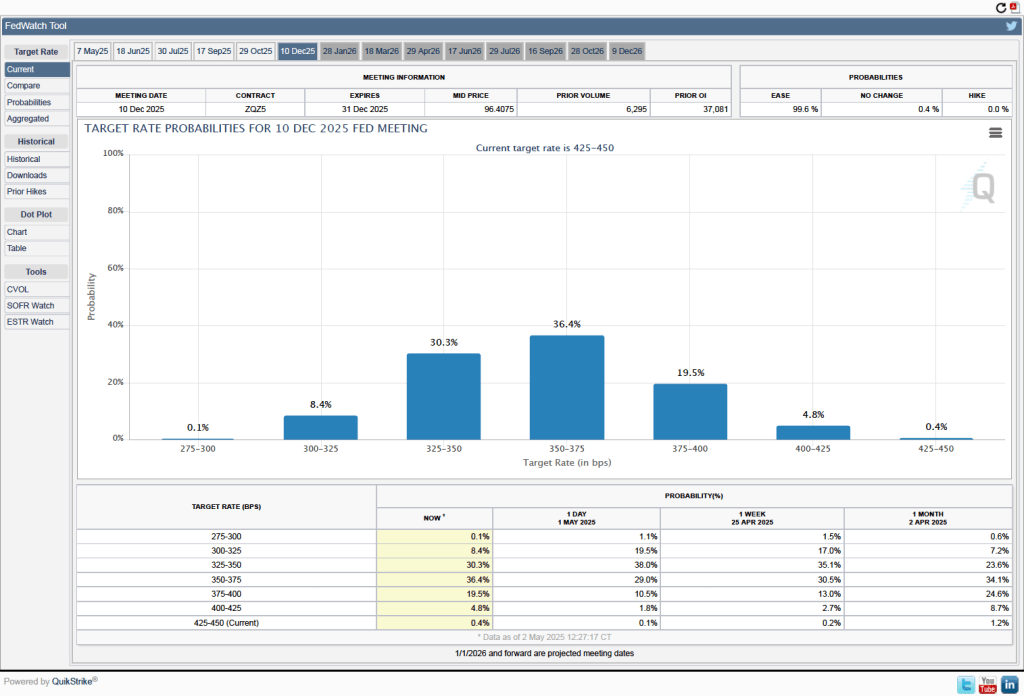
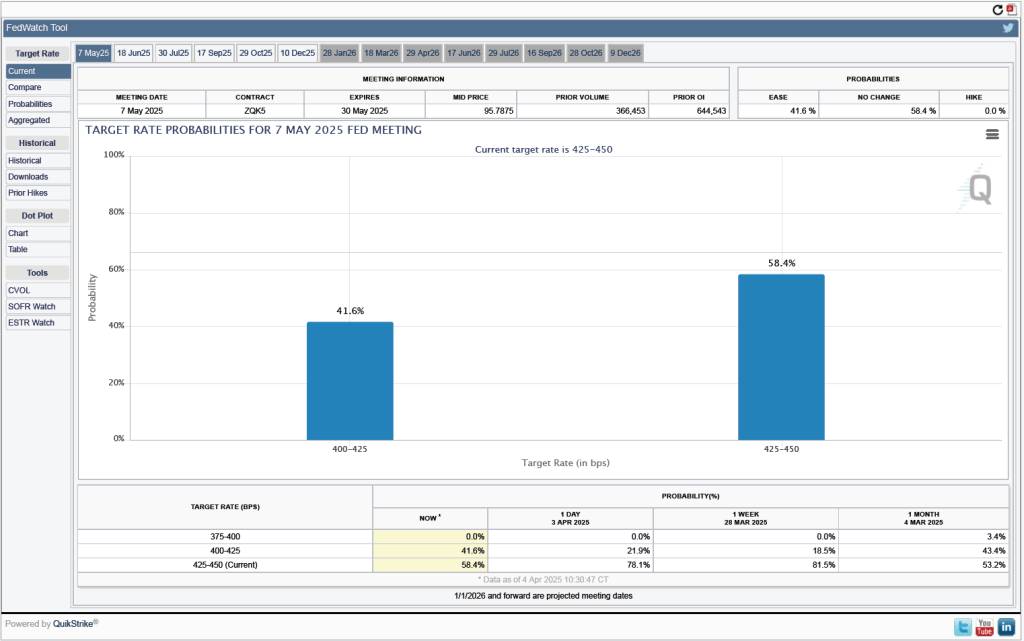
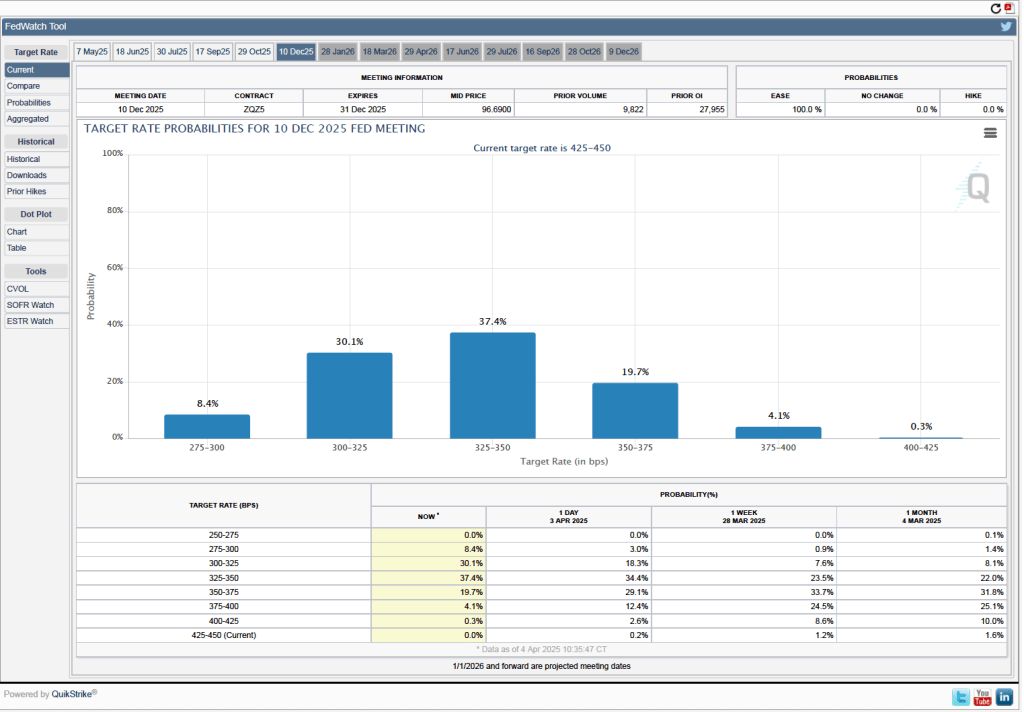
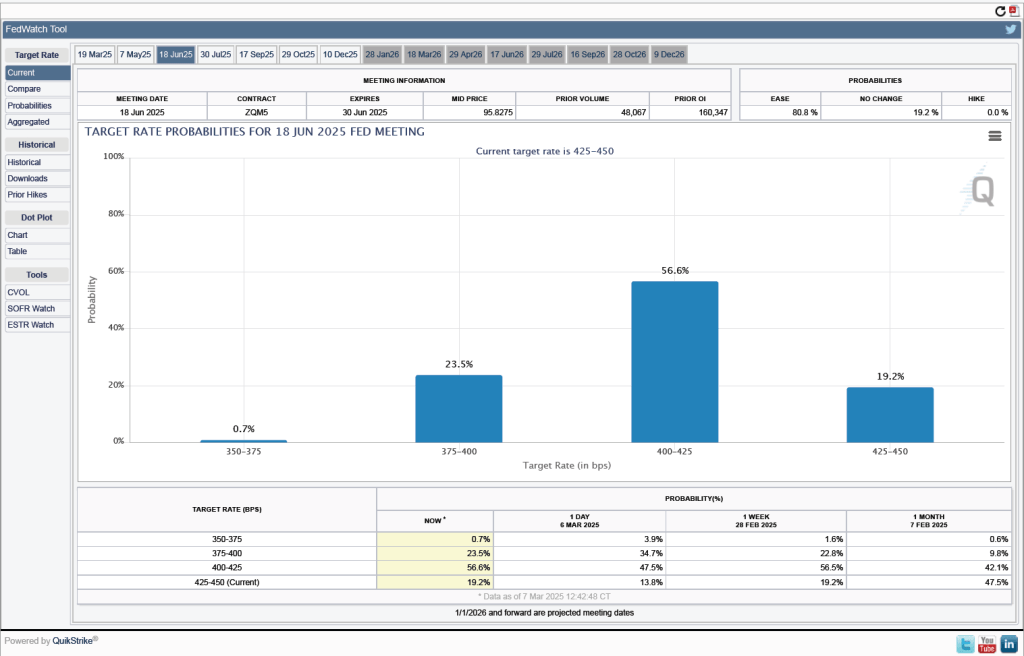
What are the implications of this CPI report for the actions the Federal Reserve’s policymaking Federal Open Market Committee (FOMC) may take at its next several meetings? Investors who buy and sell federal funds futures contracts still do not expect that the FOMC will cut its target for the federal funds rate at its next two meetings. (We discuss the futures market for federal funds in this blog post.) Investors assign the highest probability to the FOMC making two 0.25 percentage point (25 basis points) cuts in its target rate by the end of the year. Those cuts would reduce the target range from the current 4.25 percent to 4.50 percent range to a range of 3.75 to 4.00 percent. The FOMC’s actions will likely depend in part on what the tariff increases will end up being following the conclusion of the current trade negotiations and what the effect on inflation from the tariff increases will be.