On September 27, the Bureau of Economic Analysis (BEA) released its “Personal Income and Outlays” report for August, which includes monthly data on the personal consumption expenditures (PCE) price index. Inflation as measured by annual changes in the consumer price index (CPI) receives the most attention in the media, but the Federal Reserve looks instead to inflation as measured by annual changes in the PCE price index to evaluate whether it’s meeting its 2 percent annual inflation target.
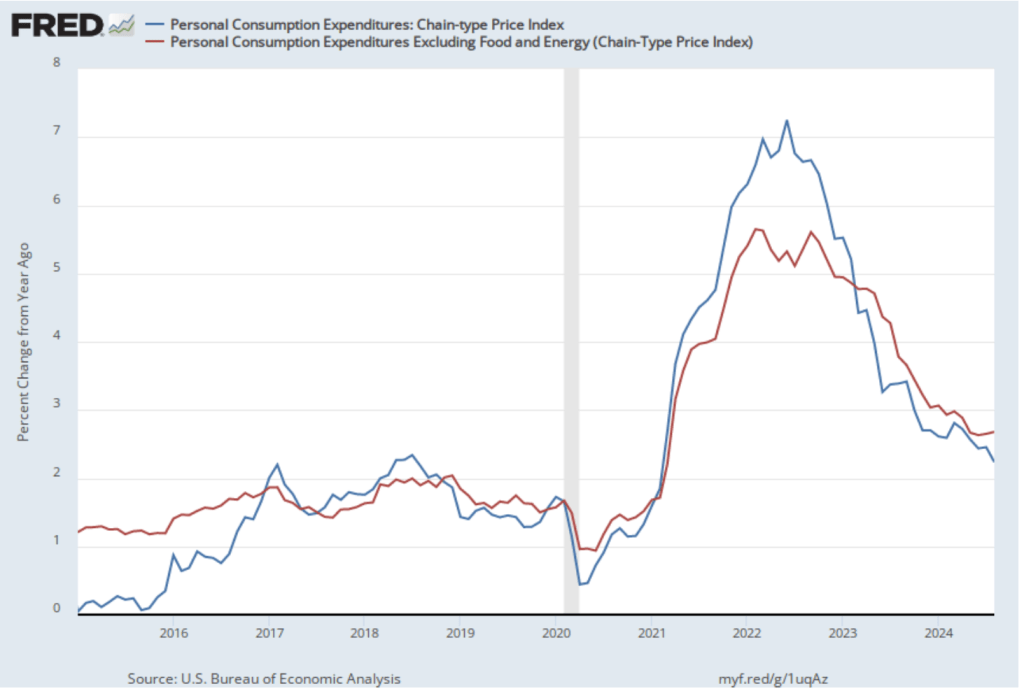
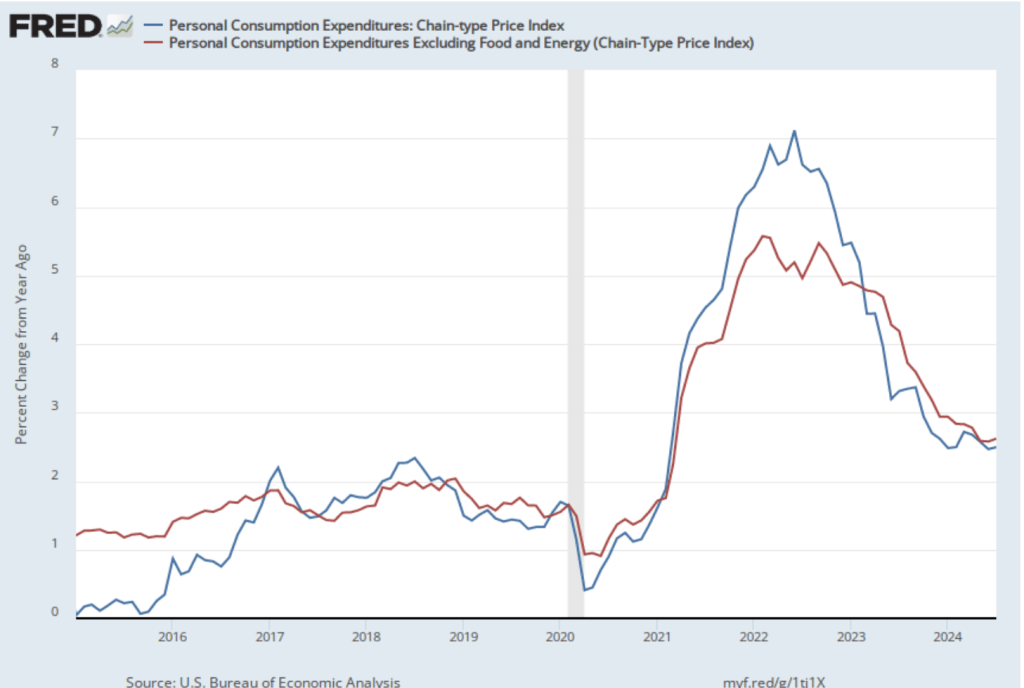
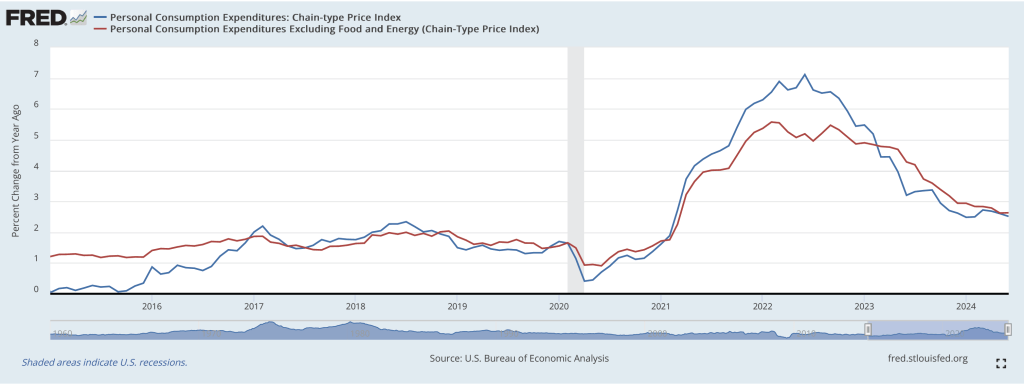
The following figure shows PCE inflation (blue line) and core PCE inflation (red line)—which excludes energy and food prices—for the period since January 2015 with inflation measured as the percentage change in the PCE from the same month in the previous year. Measured this way, PCE inflation (the blue line) was 2.2 percent in August, down from 2.7 percent in July. Core PCE inflation (the red line) ticked up in August to 2.7 percent from 2.6 percent in July.
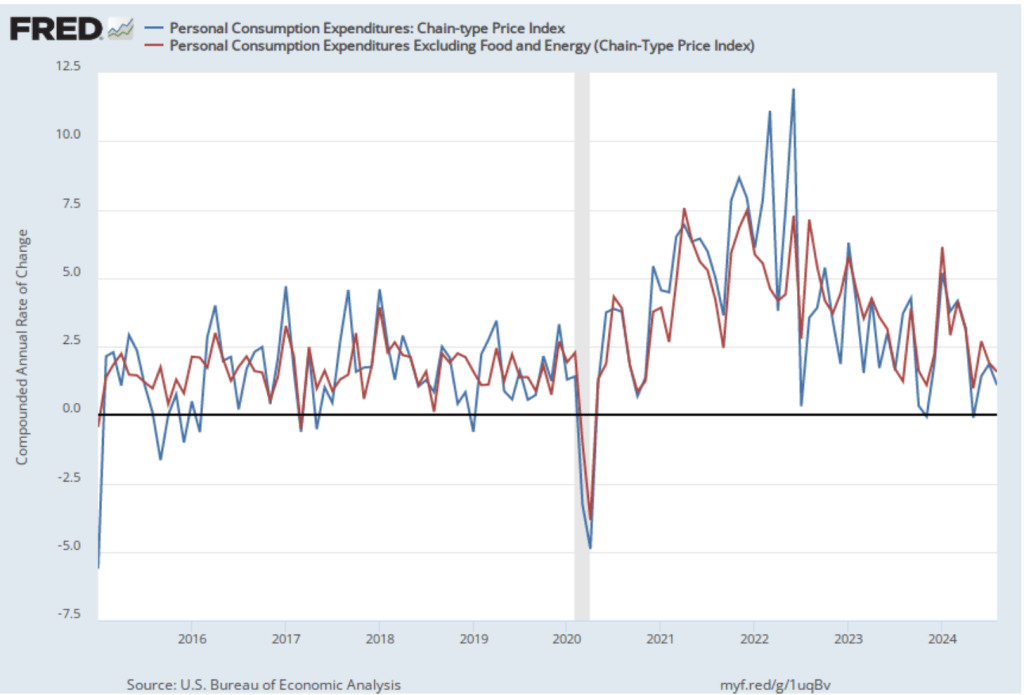
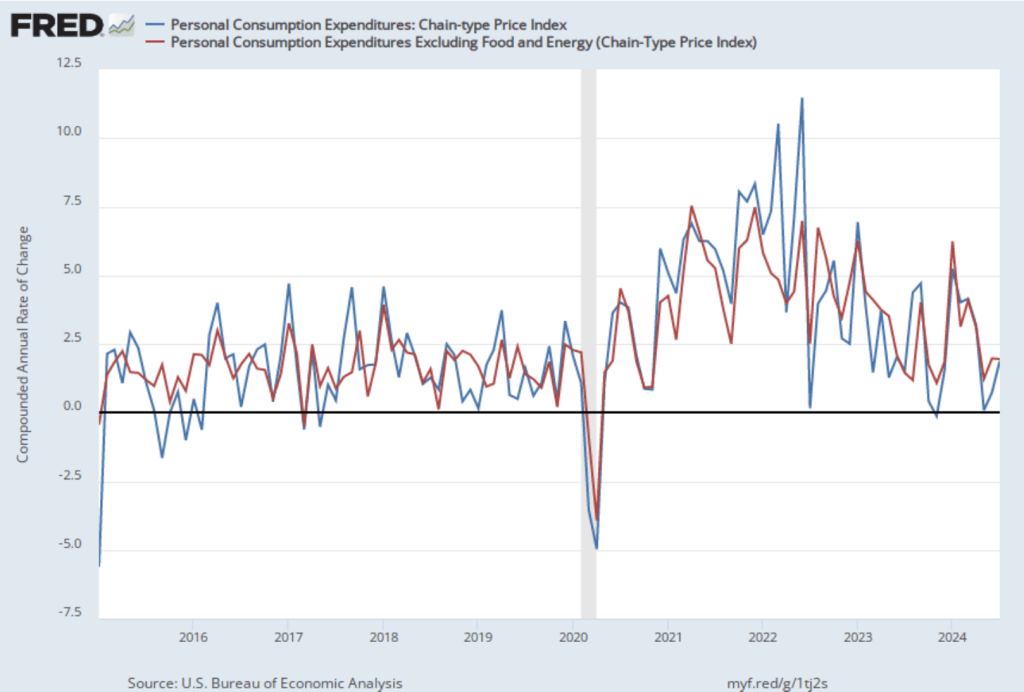
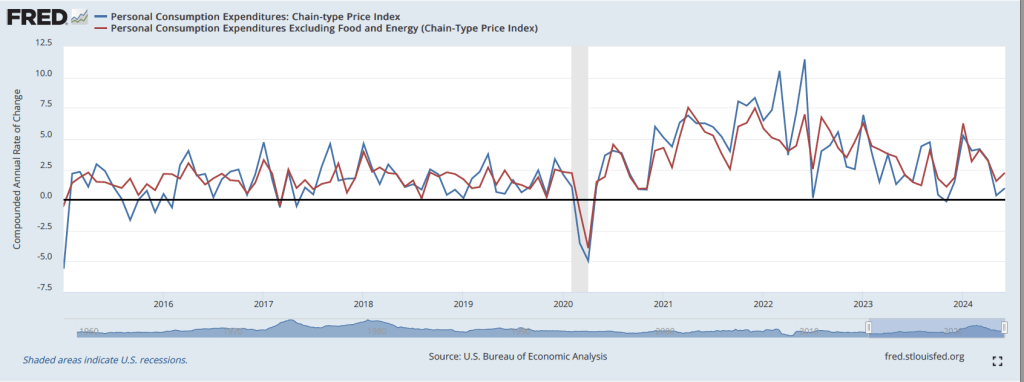
The following figure shows PCE inflation and core PCE inflation calculated by compounding the current month’s rate over an entire year. (The figure above shows what is sometimes called 12-month inflation, while this figure shows 1-month inflation.) Measured this way, PCE inflation declined from 1.9 percent in July to 1.1 percent in August, well below the Fed’s 2 percent inflation target. Core PCE inflation declined from 1.9 percent in July to 1.6 percent in August. Calculating inflation this way focuses only on the most recent data, and so reinforces the conclusion that inflation has slowed significantly from the higher rates seen at the beginning of this year.
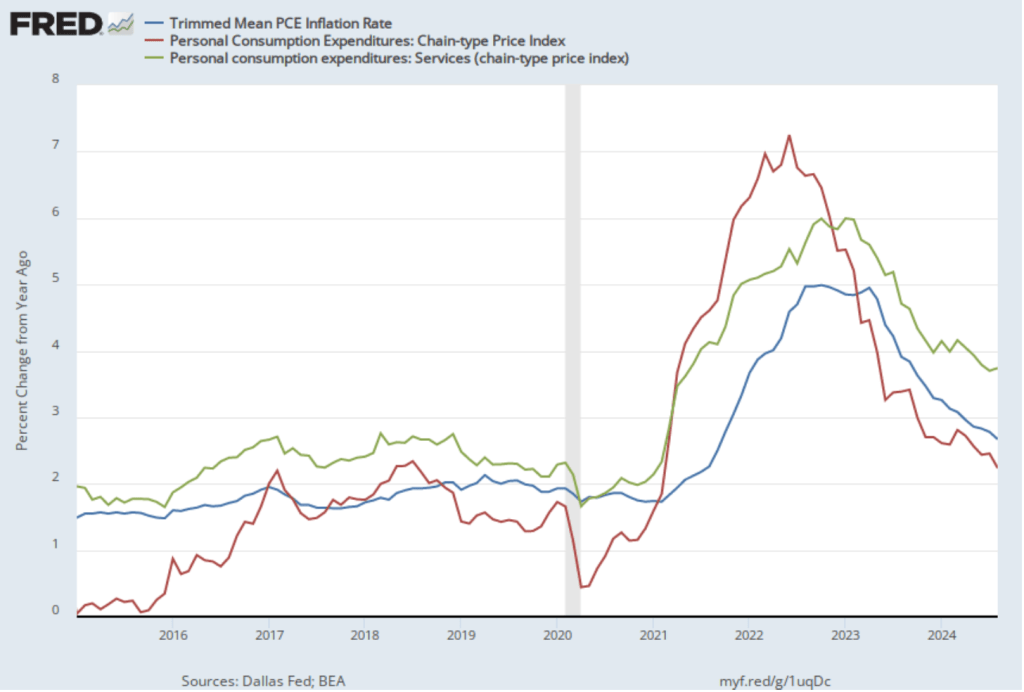
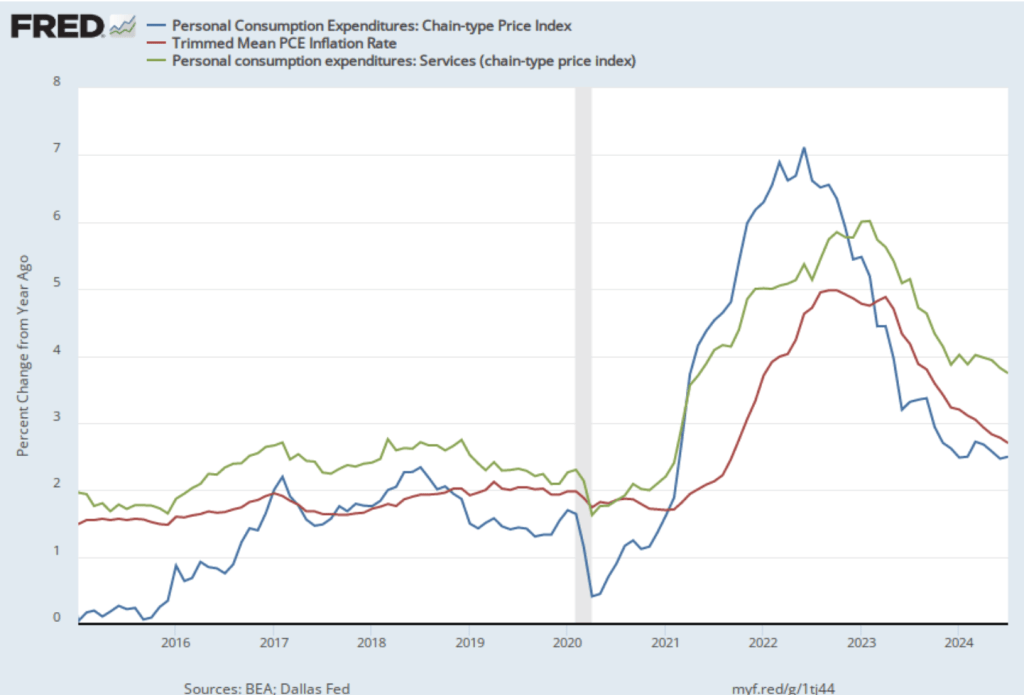
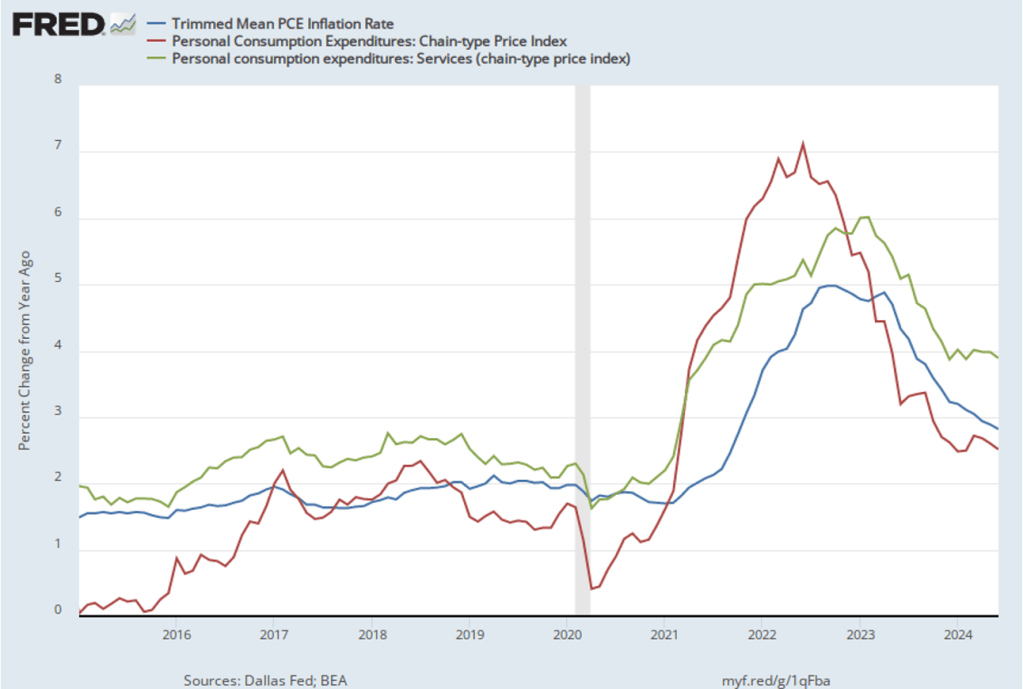
The following figure shows other ways of gauging inflation by including the 12-month inflation rate in the PCE (the same as shown in the figure above—although note that PCE inflation is now the red line rather than the blue line), inflation as measured using only the prices of the services included in the PCE (the green line), and the trimmed mean rate of PCE inflation (the blue line). Fed Chair Jerome Powell and other members of the Federal Open Market Committee (FOMC) have said that they are concerned by the persistence of elevated rates of inflation in services. The trimmed mean measure is compiled by economists at the Federal Reserve Bank of Dallas by dropping from the PCE the goods and services that have the highest and lowest rates of inflation. It can be thought of as another way of looking at core inflation by excluding the prices of goods and services that had particularly high or particularly low rates of inflation during the month.
Inflation using the trimmed mean measure was 2.7 percent in August (calculated as a 12-month inflation rate), down only slightly from 2.6 percent in July—still above the Fed’s target inflation rate of 2 percent. Inflation in services remained high in August at 3.7 percent, the same as in July.
Today’s data indicate that the economy is still on a path for a soft landing in which the inflation rate returns to the Fed’s 2 percent target without the economy slipping into a recession. Looking forward, both the Federal Bank of Atlanta’s GDPNow forecast and the Federal Reserve Bank of New York’s GDP Nowcast project that real GDP will increase at annual rate of more than 3 percent in the third quarter (which ends in three days). So, at this point there is no indication that the economy is slipping into a recession. The next Employment Situation report will be released on October 4 and will provide more information on the state of the labor market.
Today (September 11), the Bureau of Labor Statistics (BLS) released its monthly report on the consumer price index (CPI). This report is the last one that will be released before the Fed’s policy-making Federal Open Market Committee (FOMC) holds its next meeting on September 17-18.
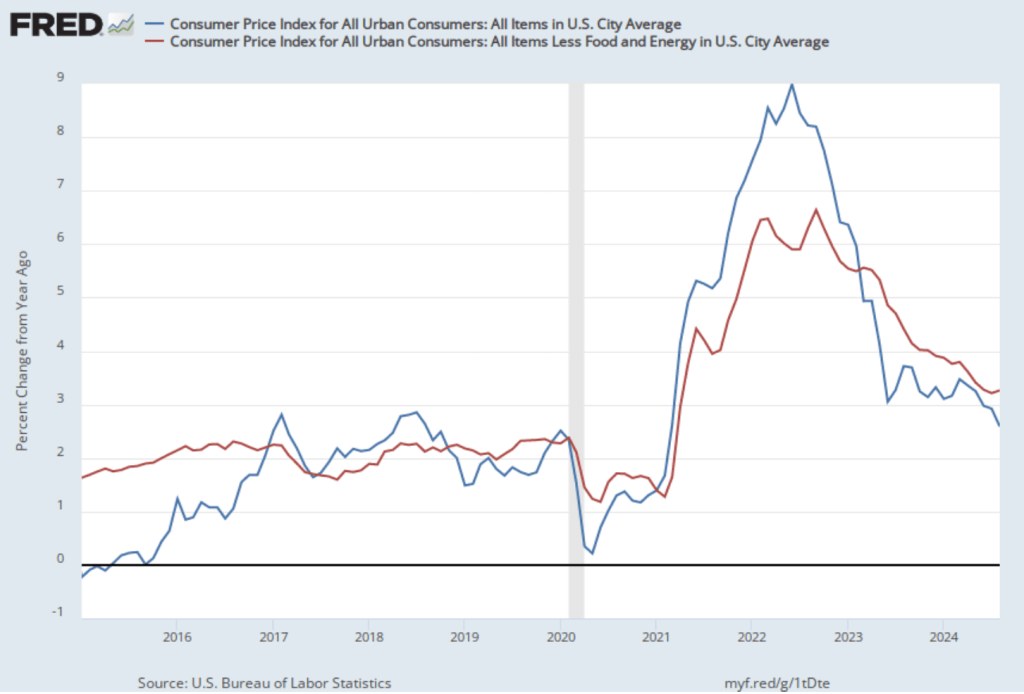
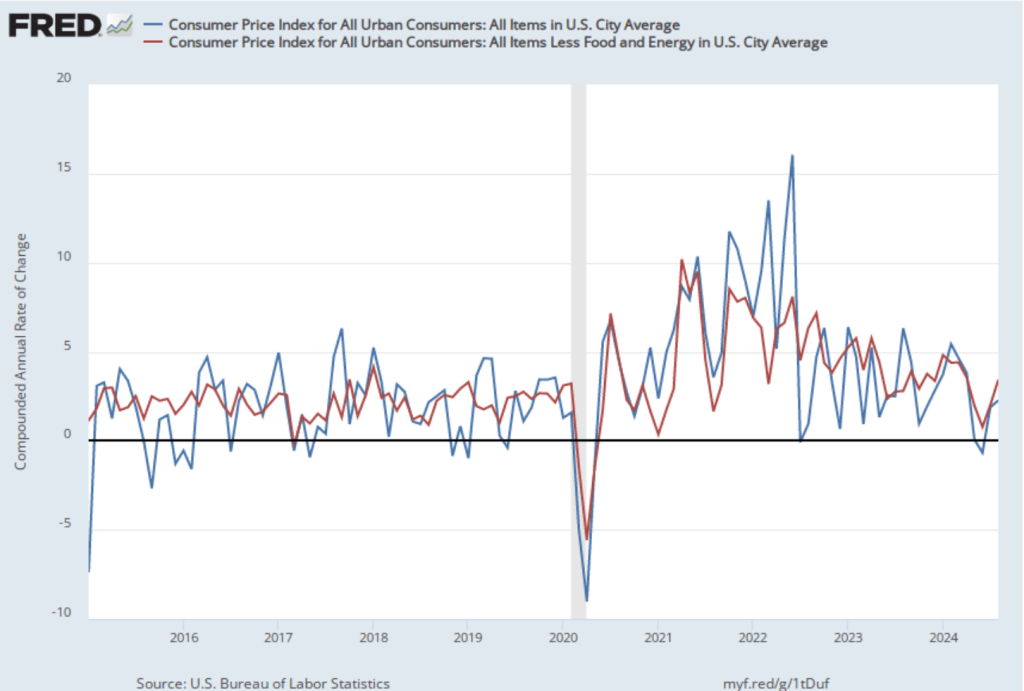
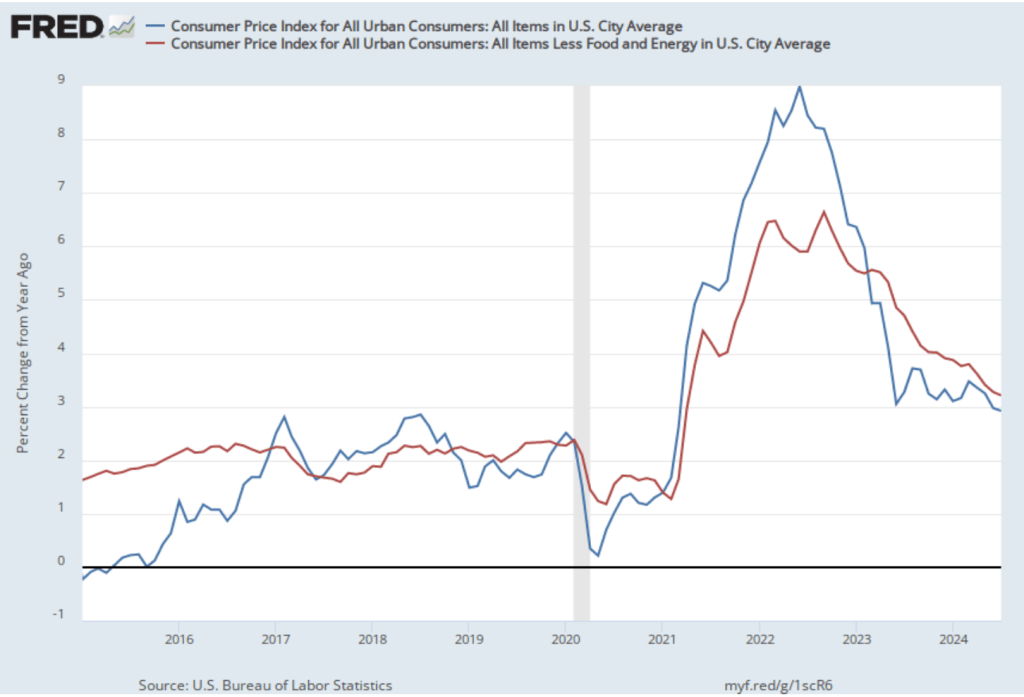
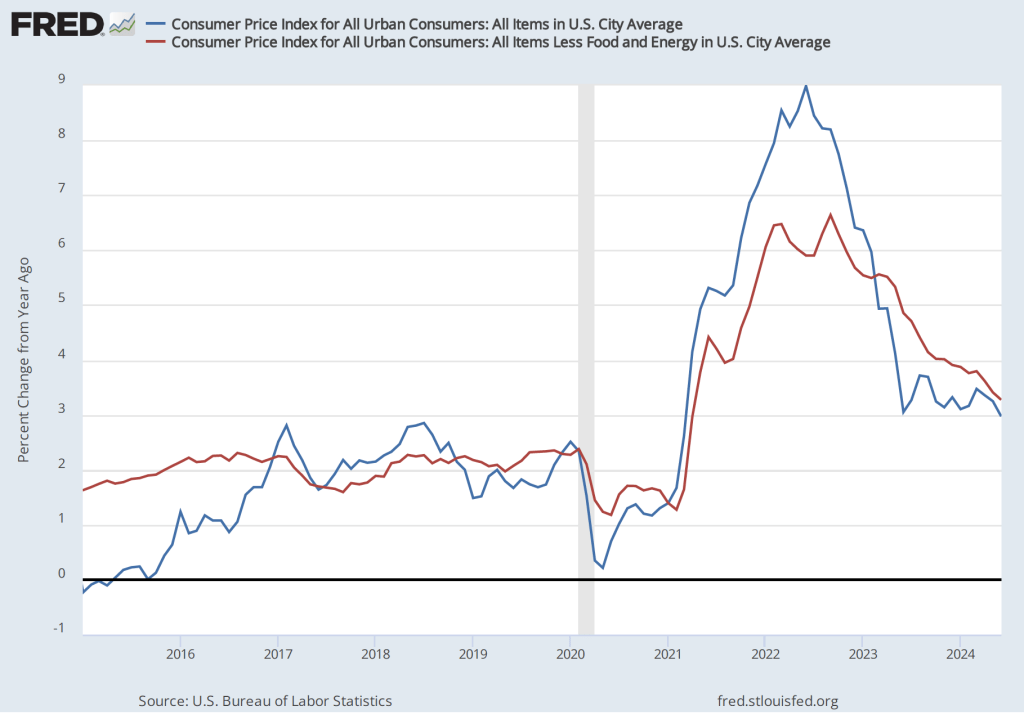
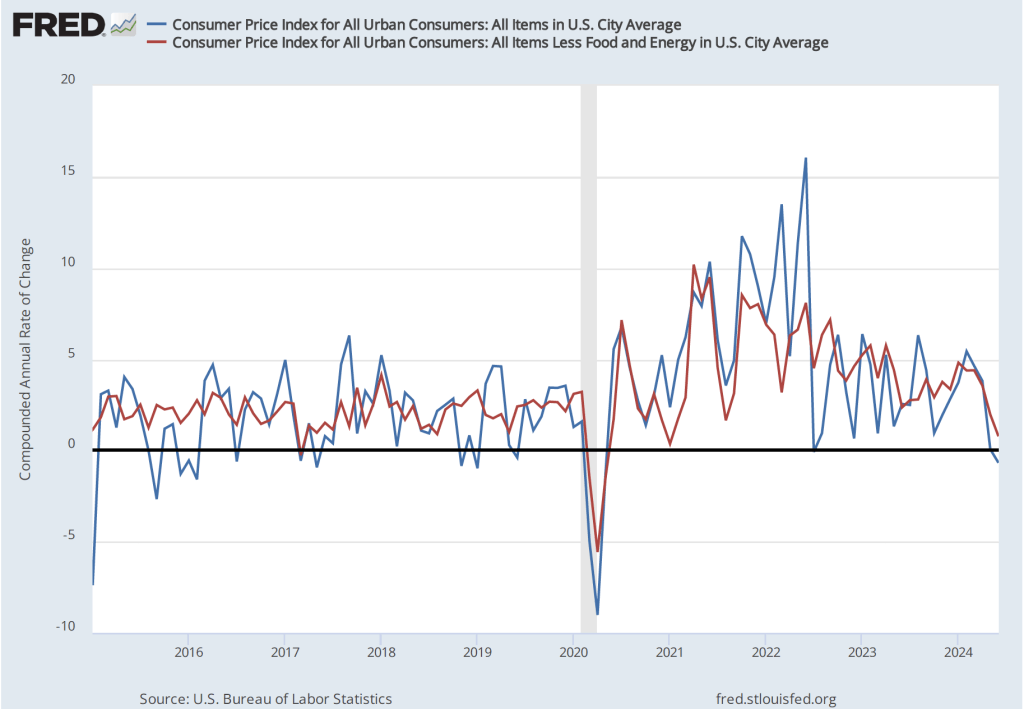
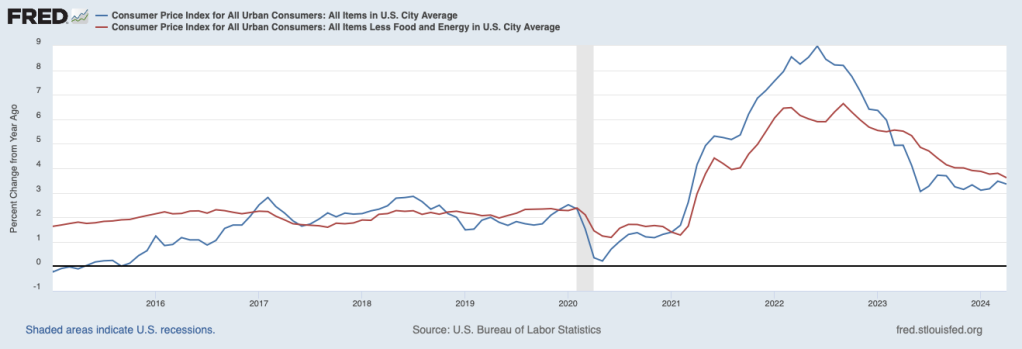
As the following figure shows, the inflation rate for August measured by the percentage change in the CPI from the same month in the previous month—headline inflation (the blue line)—was 2.6 percent down from 2.9 percent in July. Core inflation (the red line)—which excludes the prices of food and energy—increased slightly to 3.3 percent in August from 3.2 percent in July. Headline inflation was slightly below what economists surveyed by the Wall Street Journal had expected, while core inflation was slightly higher.
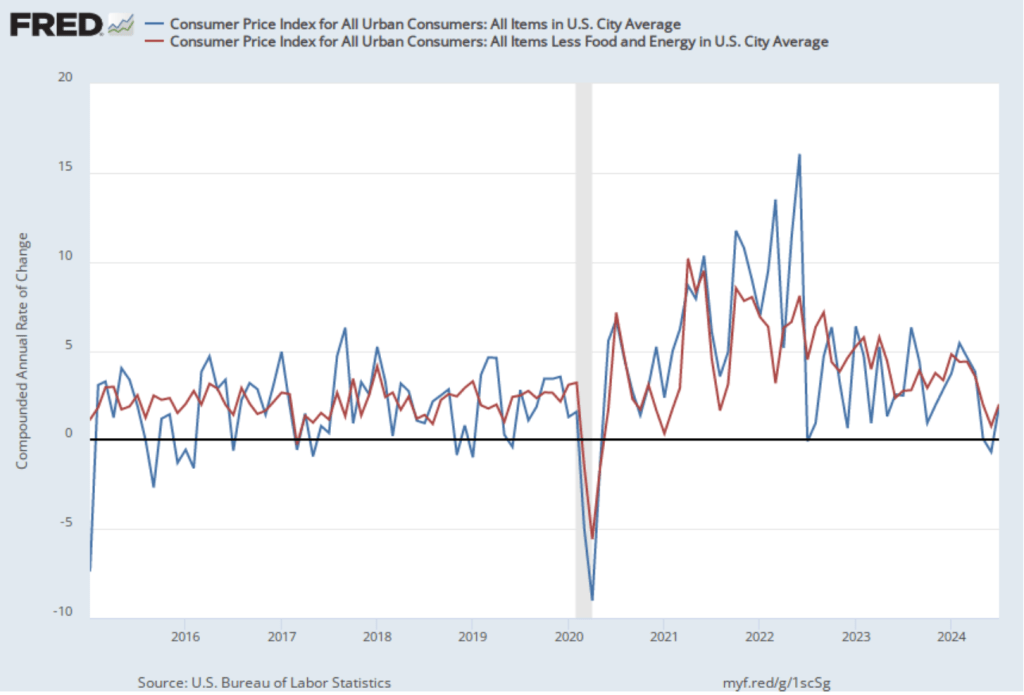
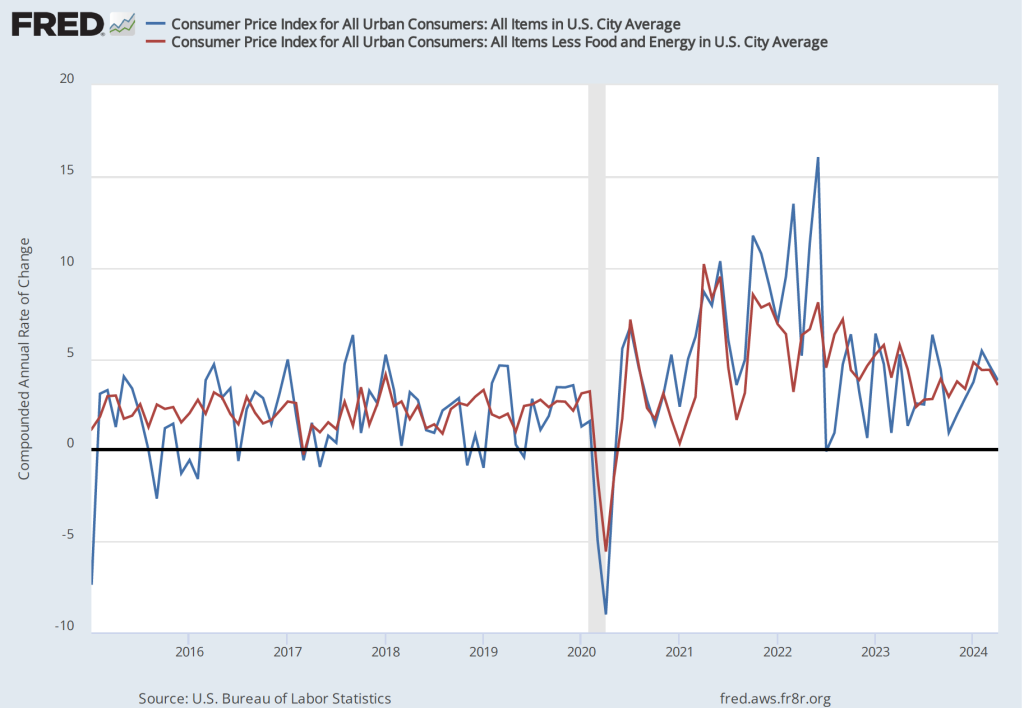
As the following figure shows, if we look at the 1-month inflation rate for headline and core inflation—that is the annual inflation rate calculated by compounding the current month’s rate over an entire year—we see that both headline and core inflation increased. Headline inflation (the blue line) increased from 1.8 percent in July to 2.3 percent in August. Core inflation (the red line) jumped from 2.0 percent in July to 3.4 percent in August. Overall, we can say that, taking 1-month and 12 month inflation together, the U.S. economy may still be on course for a soft landing—with the annual inflation rate returning to the Fed’s 2 percent target without the economy being pushed into a recession—but the increase in 1-month inflation is concerning. Of course, as always, it’s important not to overinterpret the data from a single month. (Note, also, that the Fed uses the personal consumption expenditures (PCE) price index, rather than the CPI in evaluating whether it is hitting its 2 percent inflation target.)
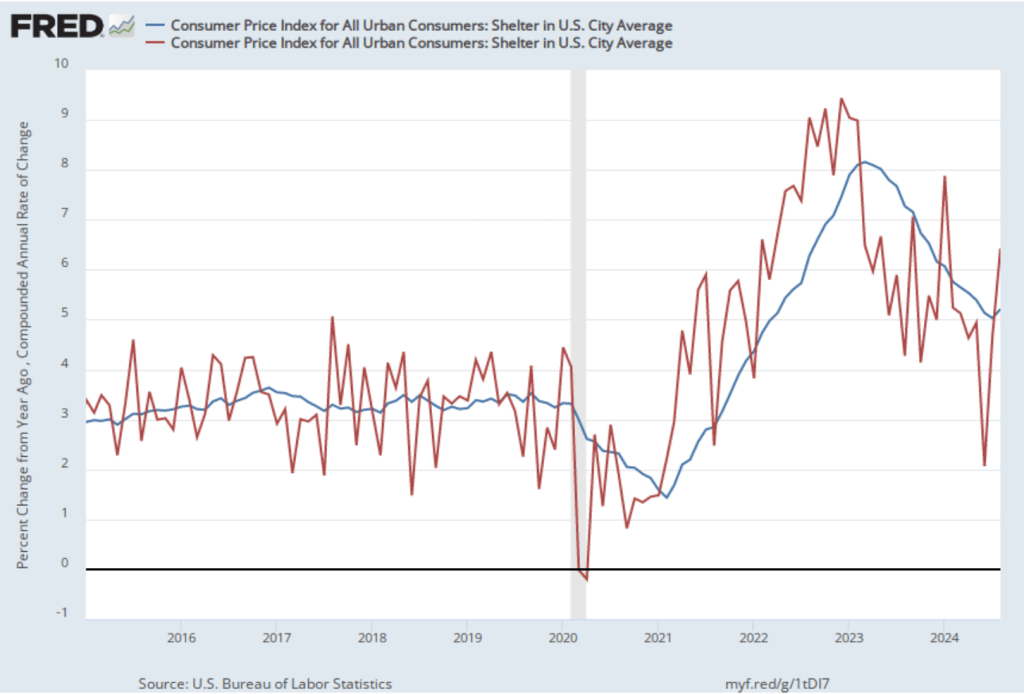
As we’ve discussed in previous blog posts, Federal Reserve Chair Jerome Powell and his colleagues on the FOMC have been closely following inflation in the price of shelter. The price of “shelter” in the CPI, as explained here, includes both rent paid for an apartment or house and “owners’ equivalent rent of residences (OER),” which is an estimate of what a house (or apartment) would rent for if the owner were renting it out. OER is included to account for the value of the services an owner receives from living in an apartment or house.
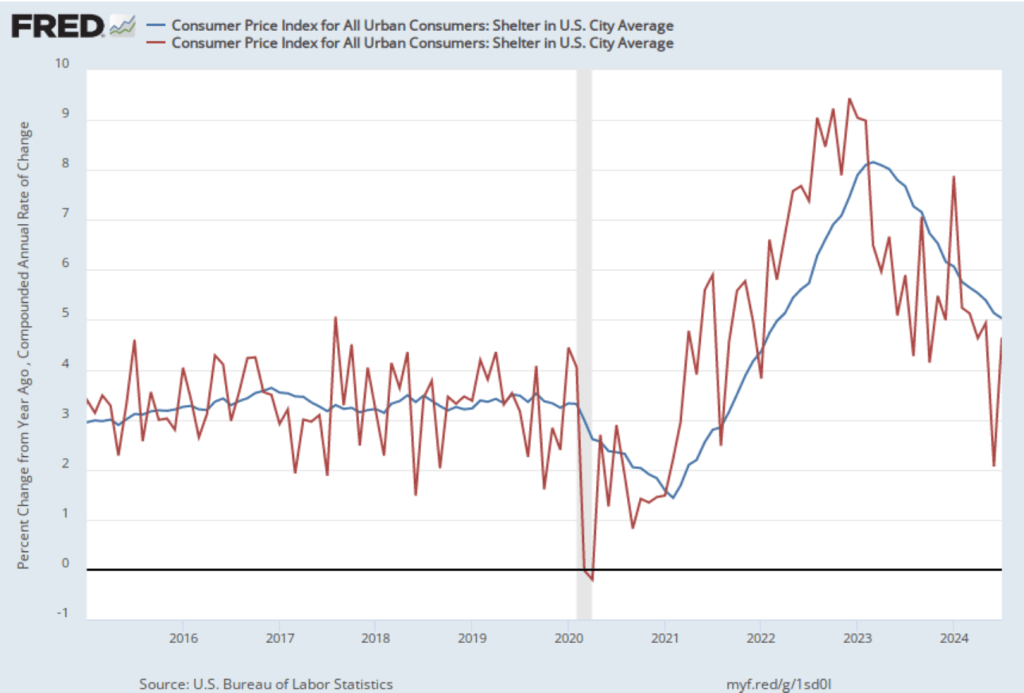
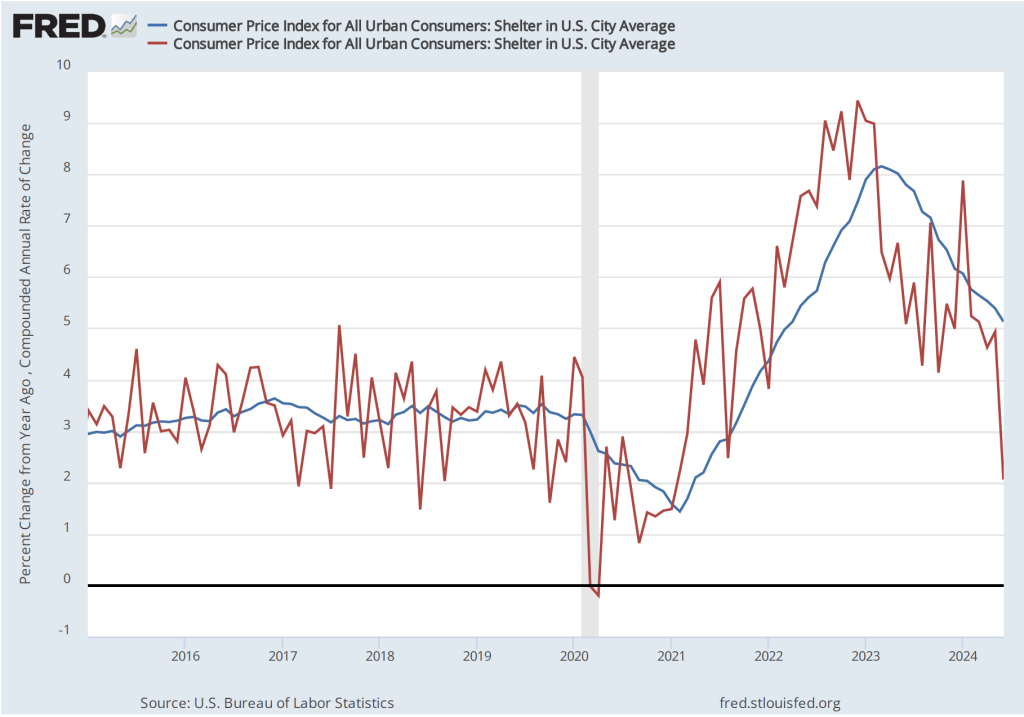
As the following figure shows, inflation in the price of shelter has been a significant contributor to headline inflation. The blue line shows 12-month inflation in shelter and the red line shows 1-month inflation in shelter. Twelve-month inflation in shelter reversed the decline that began in the spring of 2023, rising from 5.0 percent in July to 5.2 percent August. One-month inflation in shelter—which is much more volatile than 12-month inflation in shelter—increased from 4.6 percent in July to 5.2 percent in August, continuing an increase that began in June. The increase in 1-month inflation in shelter may concern the members of the FOMC, as may, to a lesser extent, the increase in 12-month inflation in shelter. Shelter has a smaller weight of 15 percent in the PCE price index that the Fed uses to gauge whether it is hitting its 2 percent inflation target in contrast with the 33 percent weight that shelter has in the CPI. But persistent shelter inflation in the 5 percent range would make a soft landing more difficult.
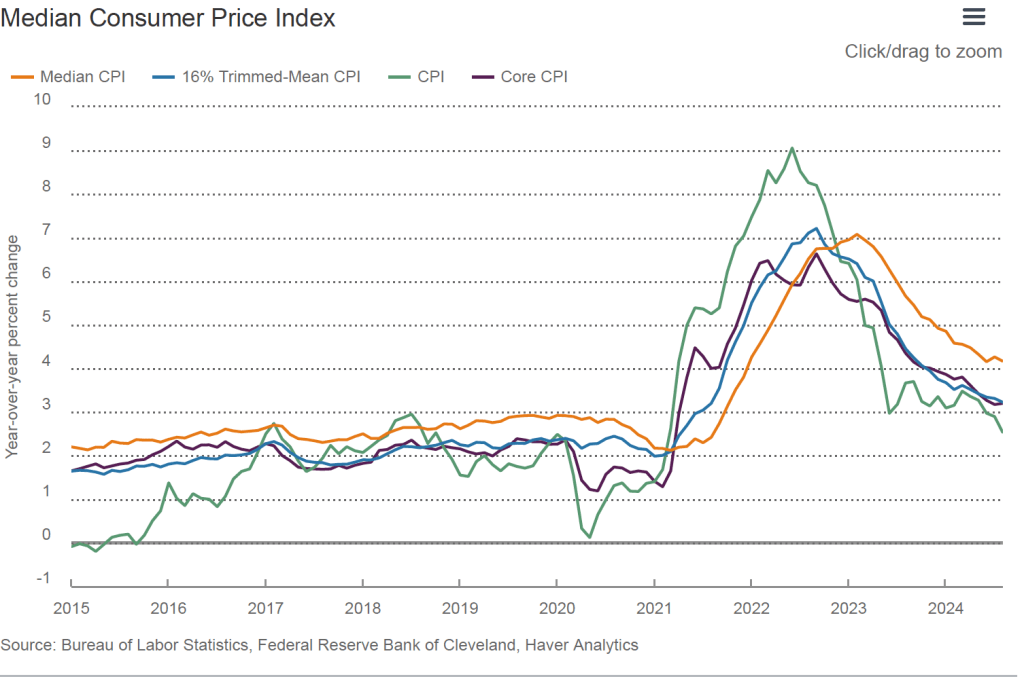
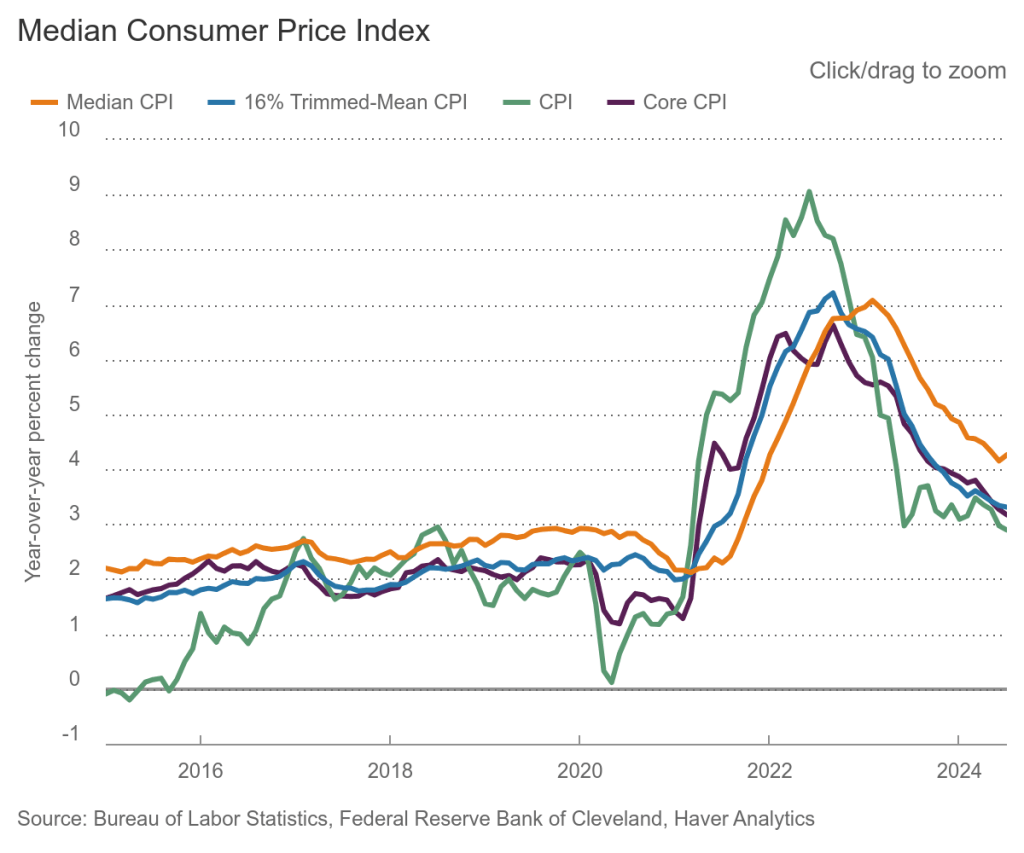
Finally, in order to get a better estimate of the underlying trend in inflation, some economists look at median inflation and trimmed mean inflation. Median inflation is calculated by economists at the Federal Reserve Bank of Cleveland and Ohio State University. If we listed the inflation rate in each individual good or service in the CPI, median inflation is the inflation rate of the good or service that is in the middle of the list—that is, the inflation rate in the price of the good or service that has an equal number of higher and lower inflation rates. Trimmed mean inflation drops the 8 percent of good and services with the higherst inflation rates and the 8 percent of goods and services with the lowest inflation rates.
As the following figure (from the Federal Reserve Bank of Cleveland) shows, median inflation (the orange line) declined slightly from 4.3 percent in July to 4.2 percent in August. Trimmed mean inflation (the blue line) also declined slightly from 3.3 in July to 3.2 percent in August. These data provide confirmation that core CPI inflation is likely running higher than a rate that would be consistent with the Fed achieving its inflation target.
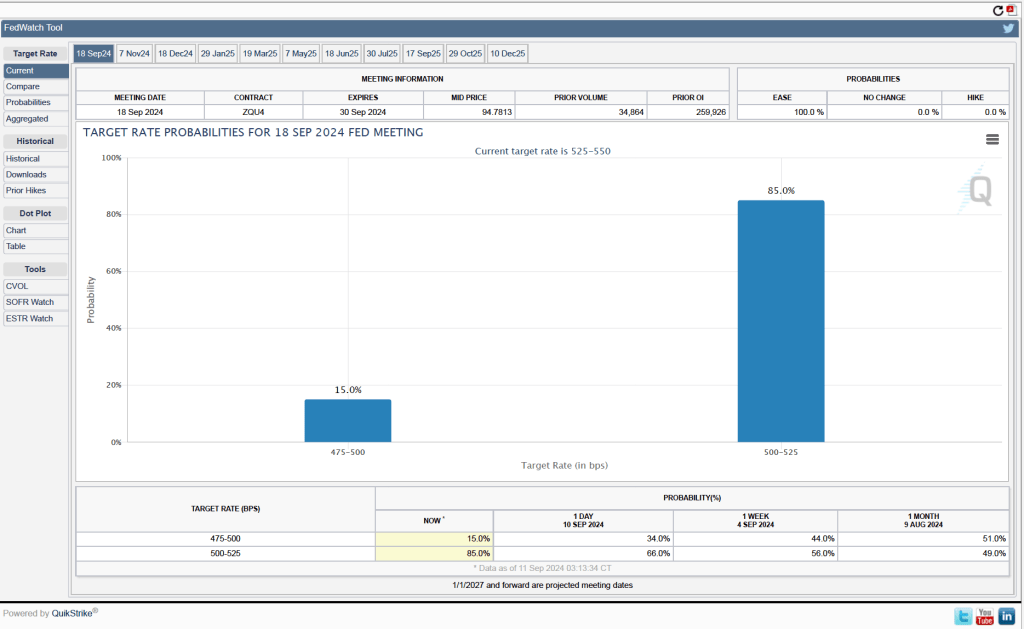
For the past few weeks Fed officials have been indicating that the FOMC is likely to cut its target for the federal funds at its next meeting on Septembe 17-18. Investors who buy and sell federal funds futures contracts expect that the FOMC will cut its target for the federal funds rate by 0.25 percentage point from the current range of 5.50 percent to 5.25 percent. (We discuss the futures market for federal funds in this blog post.) As shown in the following figure, today these investors assign a probability of 85.0 percent to the FOMC cutting its target for the federal funds rate by 0.25 percentage point at its next meeting and a probability of only 15.0 percent that the cut will be 0.50 percentage point.
The FOMC has to balance the risk of leaving its target for the federal funds rate at its current level for too long—increasing the risk of slowing demand so much that the economy slips into recession—against the risk of cutting its target too soon—increasing the risk that inflation persists above the Fed’s 2 percent target. We’ll see at the committee’s next meeting how Fed Chair Jerome Powell and the other members assess the current state of the economy as they consider when and by how much to cut their target for the federal funds rate.
The result when asking GTP-4o to generate “an image illustrating inflation.”
Inflation, as measured by changes in the personal consumption expenditures (PCE) price index, continued a slow decline that began in March. (The Fed uses annual changes in the PCE price index to evaluate whether it’s meeting its 2 percent annual inflation target.) On August 30, the Bureau of Economic Analysis (BEA) released its “Personal Income and Outlays” report for July, which contains monthly PCE data.
The following figure shows PCE inflation (blue line) and core PCE inflation (red line)—which excludes energy and food prices—for the period since January 2015 with inflation measured as the percentage change in the PCE from the same month in the previous year. Measured this way, in July PCE inflation (the blue line) was 2.5 percent, the same as in June. Core PCE inflation (the red line) in July was 2.6 percent, which was also unchanged from June.
The following figure shows PCE inflation and core PCE inflation calculated by compounding the current month’s rate over an entire year. (The figure above shows what is sometimes called 12-month inflation, while this figure shows 1-month inflation.) Measured this way, PCE inflation rose in July to 1.7 percent from 0.7 percent in July—although higher in July, inflation was below the Fed’s 2 percent target in both months. Core PCE inflation was 2.0 percent in July, which was unchanged from June. These data indicate that inflation has been at or below the Fed’s target for the last three months.
The following figure shows another way of gauging inflation by including the 12-month inflation rate in the PCE (the same as shown in the figure above), inflation measured using only the prices of the services included in the PCE (the green line), and the trimmed mean rate of PCE inflation (the red line). Fed Chair Jerome Powell and other members of the Federal Open Market Committee (FOMC) have said that they are concerned by the persistence of elevated rates of inflation in services. The trimmed mean measure is compiled by economists at the Federal Reserve Bank of Dallas by dropping from the PCE the goods and services that have the highest and lowest rates of inflation. It can be thought of as another way of looking at core inflation by excluding the prices of goods and services that had particularly high or particularly low rates of inflation during the month.
Inflation using the trimmed mean measure was 2.7 percent in July (calculated as a 12-month inflation rate), down only slightly from 2.8 percent in June—and still above the Fed’s target inflation rate of 2 percent. Inflation in services remained high in July at 3.7 percent, although down from 3.9 percent in June.
On balance, taking together these various measures, inflation seems on track to return to the Fed’s 2 percent target. As we noted in this earlier post, last week in a speech at the Federal Reserve Bank of Atlanta’s monetary policy symposium in Jackson Hole, Wyoming , Fed Chair Jerome Powell all but confirmed that the the Fed’s policy-maiking Federal Open Market Committee (FOMC) will cut its target for the federal funds rate at its next meeting on September 17-18. There was nothing in this latest PCE report to reduce the likelihood of the FOMC cutting its target at that meeting by an expected 0.25 percent point from a range of 5.25 percent to 5.50 percent to a range of 5.00 percent to 5.25 percent. There also is nothing in the report that would increase likelihood that the committee will cut its target by 0.50 percentage point, as many investors expected following the weak employment report released by the Bureau of labor Statistics (BLS) at the beginning of August. (We discuss this report and the reaction among investors in this post.)
Today (August 14), the Bureau of Labor Statistics (BLS) released its monthly report on the consumer price index (CPI), which showed inflation falling below 3 percent for the first time since March 2021.
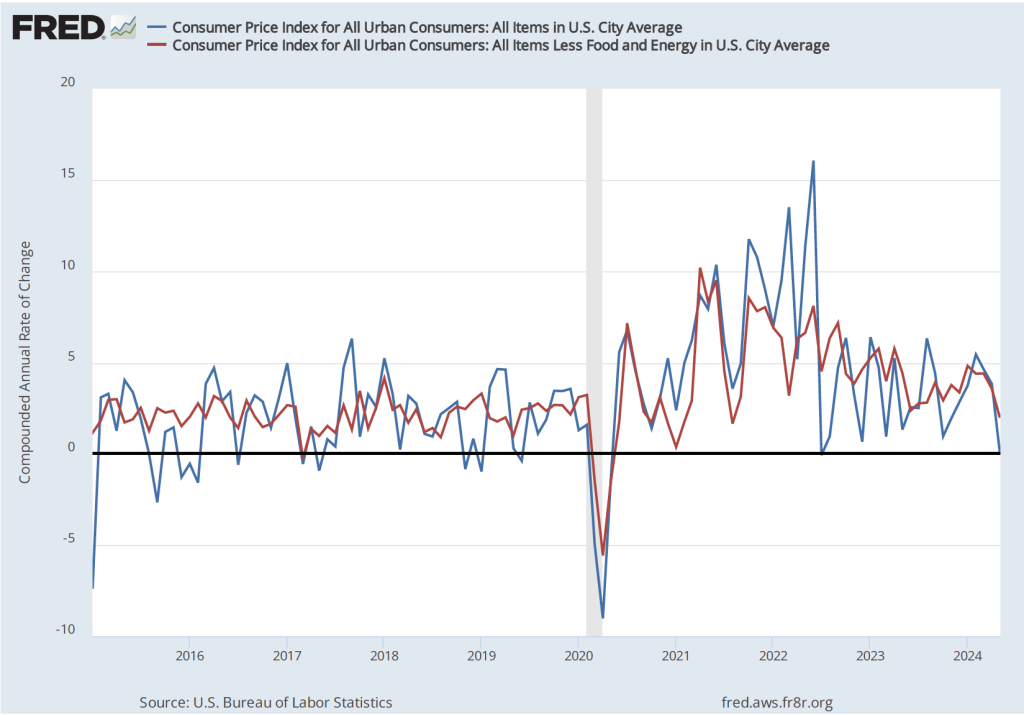
As the following figure shows, the inflation rate for July measured by the percentage change in the CPI from the same month in the previous month—headline inflation (the blue line)—was 2.9 percent down from 3.0 percent in June. Core inflation (the red line)—which excludes the prices of food and energy—was 3.2 percent in July, down from 3.3 percent in June.
As the following figure shows, if we look at the 1-month inflation rate for headline and core inflation—that is the annual inflation rate calculated by compounding the current month’s rate over an entire year—we see an increase in the inflation rate in July, but the increase is from the very low levels in June. Headline inflation (the blue line) increased from –0.7 percent in June (which means that consumer price actually fell that month) to 1.9 percent in July. Core inflation (the red line) increased from 0.8 percent in June to 2.o percent in July. Overall, we can say that, taking 1-month and 12 month inflation together, the U.S. economy seems on course for a soft landing—with the annual inflation rate returning to the Fed’s 2 percent target without the economy being pushed into a recession. (Note, though, that the Fed uses the personal consumption expenditures (PCE) price index, rather than the CPI in evaluating whether it is hitting its 2 percent inflation target.)
Federal Reserve Chair Jerome Powell and his colleagues on the policy-making Federal Open Market Committee (FOMC) have been closely following inflation in the price of shelter. The price of “shelter” in the CPI, as explained here, includes both rent paid for an apartment or house and “owners’ equivalent rent of residences (OER),” which is an estimate of what a house (or apartment) would rent for if the owner were renting it out. OER is included to account for the value of the services an owner receives from living in an apartment or house.
As the following figure shows, inflation in the price of shelter has been a significant contributor to headline inflation. The blue line shows 12-month inflation in shelter and the red line shows 1-month inflation in shelter. Twelve-month inflation in shelter continued its decline that began in the spring of 2023, falling from 5.1 percent in June to 5.0 percent July. One-month inflation in shelter—which is much more volatile than 12-month inflation in shelter—increased from 2.1 percent in June to 4.6 percent in July. The value for 1-month inflation in shelter may concern the members of the FOMC, but the continuing decline in in the less volatile 12-month inflation in shelter provides some reassurance that inflation in shelter is likely continuing to decline.
Finally, in order to get a better estimate of the underlying trend in inflation, some economists look at median inflation and trimmed mean inflation. Median inflation is calculated by economists at the Federal Reserve Bank of Cleveland and Ohio State University. If we listed the inflation rate in each individual good or service in the CPI, median inflation is the inflation rate of the good or service that is in the middle of the list—that is, the inflation rate in the price of the good or service that has an equal number of higher and lower inflation rates. Trimmed mean inflation drops the 8 percent of good and services with the higherst inflation rates and the 8 percent of goods and services with the lowest inflation rates.
As the following figure (from the Federal Reserve Bank of Cleveland) shows, median inflation (the brown line) ticked up slightly from 4.2 percent in June to 4.3 percent in July. Trimmed mean inflation (the blue line) was unchanged in July at 3.3 percent. One conclusion from these data is that headline and core inflation may be somewhat understating the underlying rate of inflation.
For the past few weeks investores in financial markets have been expecting that recent inflation and employment data will lead the FOMC to cut its target for the federal funds at its next meeting on Septembe 17-18 .
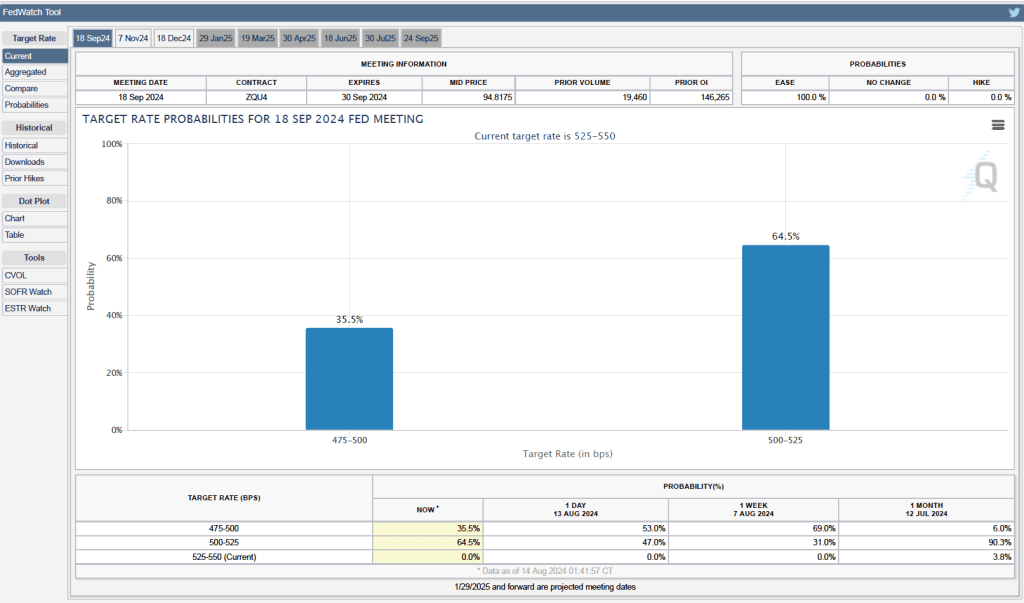
Futures markets allow investors to buy and sell futures contracts on commodities–such as wheat and oil–and on financial assets. Investors can use futures contracts both to hedge against risk—such as a sudden increase in oil prices or in interest rates—and to speculate by, in effect, betting on whether the price of a commodity or financial asset is likely to rise or fall. (We discuss the mechanics of futures markets in Chapter 7, Section 7.3 of Money, Banking, and the Financial System.) The CME Group was formed from several futures markets, including the Chicago Mercantile Exchange, and allows investors to trade federal funds futures contracts. The data that result from trading on the CME indicate what investors in financial markets expect future values of the federal funds rate to be. The following chart from the CME’s FedWatch Tool shows the current values from trading of federal funds futures.
The probabilities in the chart reflect investors’ predictions of what the FOMC’s target for the federal funds rate will be after the committee’s September meeting. The chart indicates that investors assign a probability of 35.5 percent to the FOMC cutting its target range for the federal funds rate by 0.50 percentage point from the current 5.25 prcent to 5.50 percent to 4.75 percent to 5.25 percent. Investors assign a much larger probability—64.5 percent—to the FOMC cutting its target range for the federal funds rate by 0.25 percentage point to 5.00 percent to 5.25 percent.
It would most likely require the next BLS “Employment Situation” report—which is scheduled for release on September 6—to show unexpected weakness for the FOMC to cut its target for the federal funds rate by more than 0.25 percentage point.
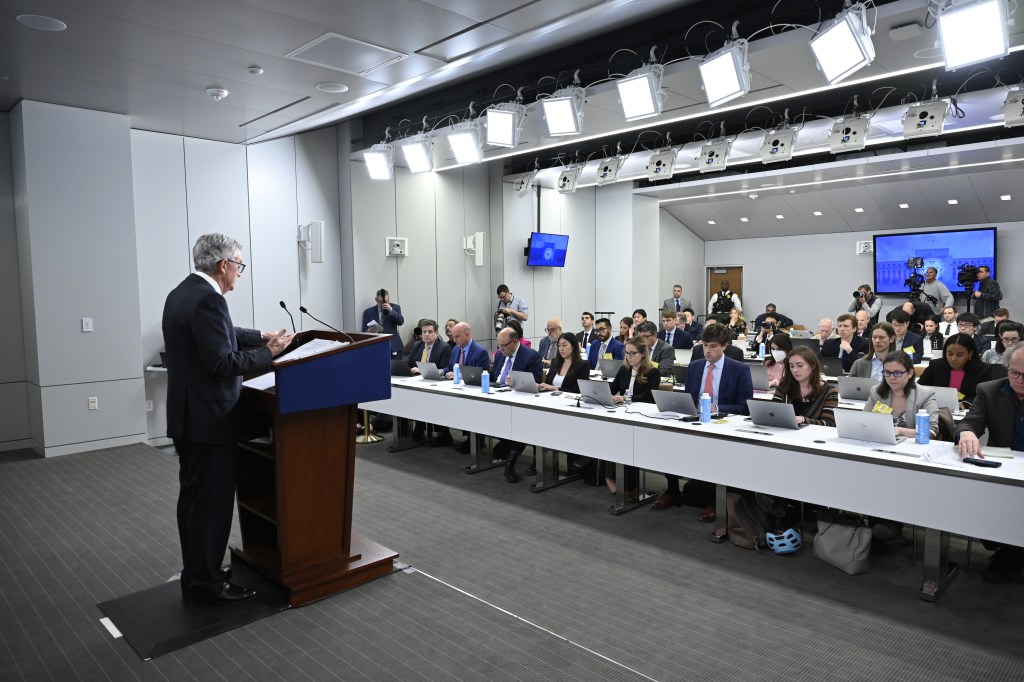
Federal Reserve Chair Jerome Powell at a press conference following a meeting of the Federal Open Market Committee (Photo from federal reserve.gov)
Inflation in 2024 is a tale of two quarters. During the first quarter of 2024, inflation ran higher than expected considering the falling inflation rates at the end of 2023. As a result, although at the beginning of the year many economists and Wall Street analysts had expected the Federal Reserve’s policy-making Federal Open Market Committee (FOMC) would cut its target for the federal funds rate at least once in the first half of 2024, the FOMC left its target unchanged.
On July 26, the Bureau of Economic Analysis (BEA) released its “Personal Income and Outlays” report for June. The report includes monthly data on the personal consumption expenditures (PCE) price index. The Fed relies on annual changes in the PCE price index to evaluate whether it’s meeting its 2 percent annual inflation target. The report confirmed that PCE inflation slowed in the second quarter, bringing it closer to the Fed’s 2 percent target.
The following figure shows PCE inflation (blue line) and core PCE inflation (red line)—which excludes energy and food prices—for the period since January 2015 with inflation measured as the percentage change in the PCE from the same month in the previous year. Measured this way, in June PCE inflation (the blue line) was 2.5 percent, down slightly from PCE inflation of 2.6 percent in May. Core PCE inflation (the red line) in June was also 2.5 percent, which was unchanged from May.
The following figure shows PCE inflation and core PCE inflation calculated by compounding the current month’s rate over an entire year. (The figure above shows what is sometimes called 12-month inflation, while this figure shows 1-month inflation.) Measured this way, PCE inflation rose in June to 0.9 percent from 0.4 percent in May—although higher in June, inflation was well below the Fed’s 2 percent target in both months. Core PCE inflation rose from 1.5 percent in May to 2.0 percent in June. These data indicate that inflation has been at or below the Fed’s target for the last two months.
The following figure shows another way of gauging inflation by including the 12-month inflation rate in the PCE (the same as shown in the figure above—although note that PCE inflation is now the red line rather than the blue line), inflation as measured using only the prices of the services included in the PCE (the green line), and the trimmed mean rate of PCE inflation (the blue line). Fed Chair Jerome Powell and other members of the Federal Open Market Committee (FOMC) have said that they are concerned by the persistence of elevated rates of inflation in services. The trimmed mean measure is compiled by economists at the Federal Reserve Bank of Dallas by dropping from the PCE the goods and services that have the highest and lowest rates of inflation. It can be thought of as another way of looking at core inflation by excluding the prices of goods and services that had particularly high or particularly low rates of inflation during the month.
Inflation using the trimmed mean measure was 2.8 percent in June (calculated as a 12-month inflation rate), down only slightly from 2.9 percent in May—and still above the Fed’s target inflation rate of 2 percent. Inflation in services remained high in June at 3.9 percent, down only slightly from 4.0 percent in May.
This month’s PCE inflation data indicate that the inflation rate is still declining towards the Fed’s target, with the low 1-month inflation rates being particularly encouraging. It now seems likely that the FOMC will soon lower the committee’s target for the federal funds rate, which is currently 5.25 percent to 5.50 percent. Remarks by Fed Chair Powell have been interpreted as hinting as much. The next meeting of the FOMC is July 30-31. What do financial markets think the FOMC will decide at that meeting?
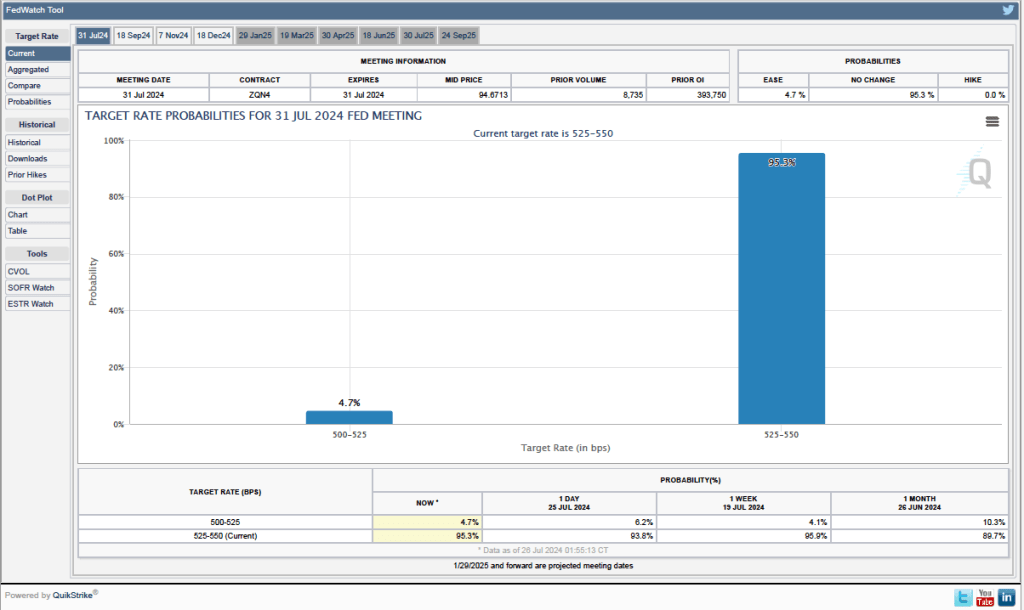
Futures markets allow investors to buy and sell futures contracts on commodities–such as wheat and oil–and on financial assets. Investors can use futures contracts both to hedge against risk—such as a sudden increase in oil prices or in interest rates—and to speculate by, in effect, betting on whether the price of a commodity or financial asset is likely to rise or fall. (We discuss the mechanics of futures markets in Chapter 7, Section 7.3 of Money, Banking, and the Financial System.) The CME Group was formed from several futures markets, including the Chicago Mercantile Exchange, and allows investors to trade federal funds futures contracts. The data that result from trading on the CME indicate what investors in financial markets expect future values of the federal funds rate to be. The following chart from the CME’s FedWatch Tool shows the current values from trading of federal funds futures.
The probabilities in the chart reflect investors’ predictions of what the FOMC’s target for the federal funds rate will be after the committee’s July meeting. The chart indicates that investors assign a probability of only 4.7 percent to the FOMC cutting its federal funds rate target by 0.25 percentage point at its July 30-31 meeting and an 95.3 percent probability of the commitee leaving the target unchanged.
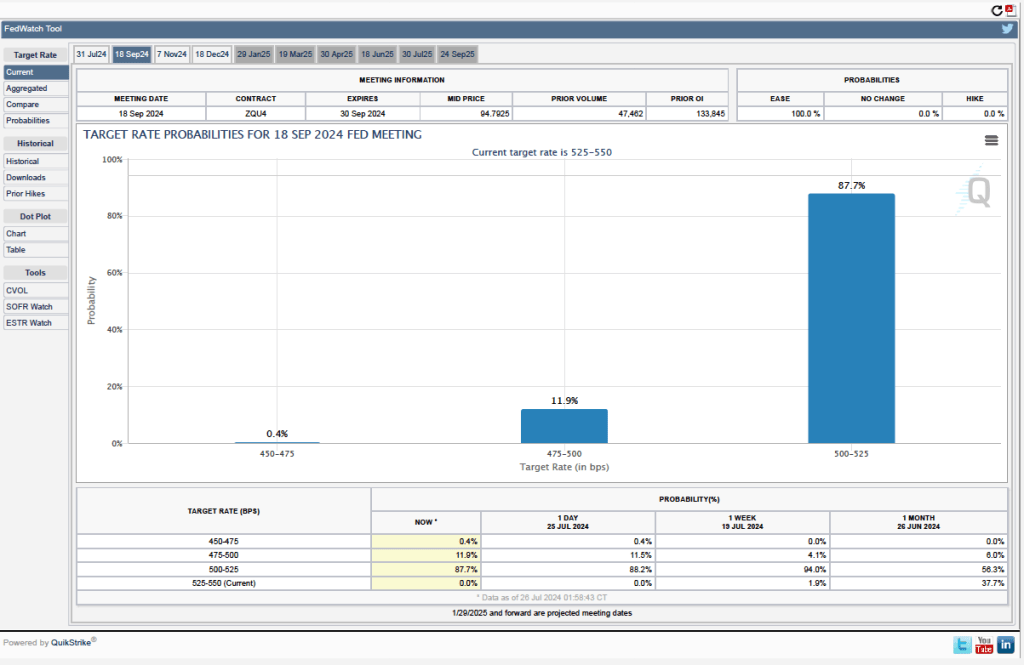
In contrast, the following figure shows that investors expect that the FOMC will cut its federal funds rate at the meeting scheduled for September 17-18. Investors assign an 87.7 percent probability of a 0.25 percentage point cut and a 11.9 percent probability of a 0.50 percentage point cut. The committee deciding to leave the target unchanged at 5.25 percent to 5.50 percent is effectively assigned a zero probability. In other words, investors believe with near certainty that the FOMC will reduce its target for the federal funds rate for the first time since the current round of rate increases ended in July 2023.
Image of “a family shopping in a supermarket” generated by ChatGTP 4o.
In testifying before Congress this week, Federal Reserve Chair Jerome Powell indicated that the Fed’s policy-making Federal Open Market Committee (FOMC) was becoming more concerned that it not be too late in reducing its target for the federal funds rate:
“[I]n light of the progress made both in lowering inflation and in cooling the labor market over the past two years, elevated inflation is not the only risk we face. Reducing policy restraint too late or too little could unduly weaken economic activity and employment.”
Powell also noted that: “more good data would strengthen our confidence that inflation is moving sustainably toward 2 percent.” Today (July 11), Powell received more good data as the Bureau of Labor Statistics (BLS) released its monthly report on the consumer price index (CPI), which showed a further slowing in inflation.
As the following figure shows, the inflation rate for June measured by the percentage change in the CPI from the same month in the previous month—headline inflation (the blue line)—was 3.o percent down from 3.3 percent in May. Core inflation (the red line)—which excludes the prices of food and energy—was 3.3 percent in June, down from 3.4 percent in May.
As the following figure shows, if we look at the 1-month inflation rate for headline and core inflation—that is the annual inflation rate calculated by compounding the current month’s rate over an entire year—the declines in the inflation rate are much larger. Headline inflation (the blue line) declined from 0.1 percent in May to –0.7 in June—consumer prices fell during June. Core inflation (the red line) declined from 2.0 percent in May to 0.8 percent in June. Overall, we can say that inflation has cooled further in June, bringing the U.S. economy closer to a soft landing—with the annual inflation rate returning to the Fed’s 2 percent target without the economy being pushed into a recession. (Note, though, that the Fed uses the personal consumption expenditures (PCE) price index, rather than the CPI in evaluating whether it is hitting its 2 percent inflation target.)
The FOMC has been looking closely at inflation in the price of shelter. The price of “shelter” in the CPI, as explained here, includes both rent paid for an apartment or house and “owners’ equivalent rent of residences (OER),” which is an estimate of what a house (or apartment) would rent for if the owner were renting it out. OER is included to account for the value of the services an owner receives from living in an apartment or house.
As the following figure shows, inflation in the price of shelter has been a significant contributor to headline inflation. The blue line shows 12-month inflation in shelter and the red line shows 1-month inflation in shelter. Twelve-month inflation in shelter continued its decline that began in the spring of 2023. One-month inflation in shelter declined substantially from 4.9 percent in May to 2.1 percent in June. These values indicate that the price of shelter may no longer be a significant driver of headline inflation.
Finally, in order to get a better estimate of the underlying trend in inflation, some economists look at median inflation and trimmed mean inflation. Meadin inflation is calculated by economists at the Federal Reserve Bank of Cleveland and Ohio State University. If we listed the inflation rate in each individual good or service in the CPI, median inflation is the inflation rate of the good or service that is in the middle of the list—that is, the inflation rate in the price of the good or service that has an equal number of higher and lower inflation rates. Trimmed mean inflation drops the 8 percent of good and services with the higherst inflation rates and the 8 percent of goods and services with the lowest inflation rates.
As the following figure (from the Federal Reserve Bank of Cleveland) shows, both median inflation (the brown line) and trimmed mean inflation (the blue line) were somewhat higher than either headline CPI inflation or core CPI inflation. One conclusion from these data is that headline and core inflation may be somewhat understating the underlying rate of inflation.
Financial markets are interpreting the most inflation and employment data as indicating that at its meeting on Septembe 17-18 the FOMC is likely to cut its target range for the federal funds rate from the current 5.25 percent to 5.50 to 5.00 percent to 5.25 percent.
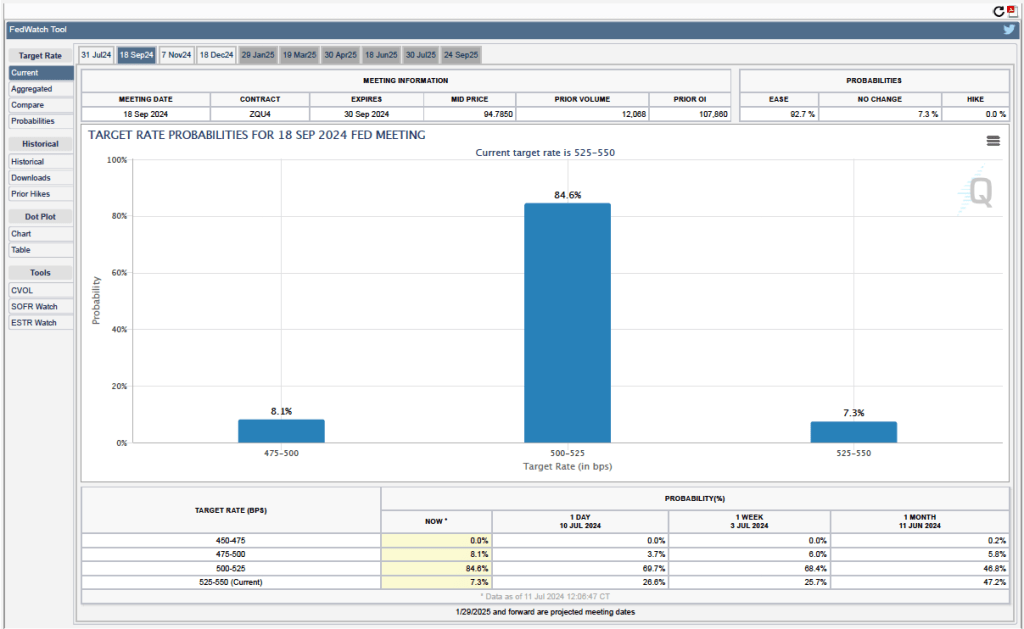
Futures markets allow investors to buy and sell futures contracts on commodities–such as wheat and oil–and on financial assets. Investors can use futures contracts both to hedge against risk—such as a sudden increase in oil prices or in interest rates—and to speculate by, in effect, betting on whether the price of a commodity or financial asset is likely to rise or fall. (We discuss the mechanics of futures markets in Chapter 7, Section 7.3 of Money, Banking, and the Financial System.) The CME Group was formed from several futures markets, including the Chicago Mercantile Exchange, and allows investors to trade federal funds futures contracts. The data that result from trading on the CME indicate what investors in financial markets expect future values of the federal funds rate to be. The following chart from the CME’s FedWatch Tool shows the current values from trading of federal funds futures.
The probabilities in the chart reflect investors’ predictions of what the FOMC’s target for the federal funds rate will be after the committee’s September meeting. The chart indicates that investors assign a probability of only 8.1 percent to the FOMC leaving its federal funds rate target unchanged at its September meeting, but a 84.6 percent probability of the committee cutting its target by 0.25 percentage point (and a 7.3 percent probability of the committee cutting its target by 0.50 percent age point).
Chair Jerome Powell and other members of the Federal Open Market Committee (Photo from federalreserve.gov)
On Friday, June 28, the Bureau of Economic Analysis (BEA) released its “Personal Income and Outlays” report for April, which includes monthly data on the personal consumption expenditures (PCE) price index. Inflation as measured by annual changes in the consumer price index (CPI) receives the most attention in the media, but the Federal Reserve looks instead to inflation as measured by annual changes in the PCE price index to evaluate whether it’s meeting its 2 percent annual inflation target.
The following figure shows PCE inflation (blue line) and core PCE inflation (red line)—which excludes energy and food prices—for the period since January 2015 with inflation measured as the change in the PCE from the same month in the previous year. Measured this way, in May PCE inflation (the blue line) was 2.6 percent in May, down slightly from PCE inflation of 2.7 percent in April. Core PCE inflation (the red line) in May was also 2.6 percent, down from 2.8 percent in April.
The following figure shows PCE inflation and core PCE inflation calculated by compounding the current month’s rate over an entire year. (The figure above shows what is sometimes called 12-month inflation, while this figure shows 1-month inflation.) Measured this way, PCE inflation sharply declined from 3.2 percent in April to -0.1 percent in in May—meaning that consumer prices actually fell during May. Core PCE inflation declined from 3.2 percent in April to 1.0 percent in May. This decline indicates that inflation by either meansure slowed substantially in May, but data for a single month should be interpreted with caution.
The following figure shows another way of gauging inflation by including the 12-month inflation rate in the PCE (the same as shown in the figure above—although note that PCE inflation is now the red line rather than the blue line), inflation as measured using only the prices of the services included in the PCE (the green line), and the trimmed mean rate of PCE inflation (the blue line). Fed Chair Jerome Powell and other members of the Federal Open Market Committee (FOMC) have said that they are concerned by the persistence of elevated rates of inflation in services. The trimmed mean measure is compiled by economists at the Federal Reserve Bank of Dallas by dropping from the PCE the goods and services that have the highest and lowest rates of inflation. It can be thought of as another way of looking at core inflation by excluding the prices of goods and services that had particularly high or particularly low rates of inflation during the month.
Inflation using the trimmed mean measure was 2.8 percent in May (calculated as a 12-month inflation rate), down only slightly from 2.9 percent in April—and still well above the Fed’s target inflation rate of 2 percent. Inflation in services remained high in May at 3.9 percent, down only slightly from 4.0 percent in April.
This month’s PCE inflation data indicate that the inflation rate is still declining towards the Fed’s target, with the low 1-month inflation rates being particularly encouraging. But the FOMC will likely need additional data before deciding to lower the committee’s target for the federal funds rate, which is currently 5.25 percent to 5.50 percent. The next meeting of the FOMC is July 30-31. What do financial markets think the FOMC will decide at that meeting?
Futures markets allow investors to buy and sell futures contracts on commodities–such as wheat and oil–and on financial assets. Investors can use futures contracts both to hedge against risk—such as a sudden increase in oil prices or in interest rates—and to speculate by, in effect, betting on whether the price of a commodity or financial asset is likely to rise or fall. (We discuss the mechanics of futures markets in Chapter 7, Section 7.3 of Money, Banking, and the Financial System.) The CME Group was formed from several futures markets, including the Chicago Mercantile Exchange, and allows investors to trade federal funds futures contracts. The data that result from trading on the CME indicate what investors in financial markets expect future values of the federal funds rate to be. The following chart from the CME’s FedWatch Tool shows the current values from trading of federal funds futures.
The probabilities in the chart reflect investors’ predictions of what the FOMC’s target for the federal funds rate will be after the committee’s July meeting. The chart indicates that investors assign a probability of only 10.3 percent to the FOMC cutting its federal funds rate target by 0.25 percentage point at that meeting and an 89.7 percent probability of the commitee leaving the target unchanged.
In contrast, the following figure shows that investors expect that the FOMC will cut its federal funds rate at the meeting scheduled for September 17-18. Investors assign a 57.9 percent probability of a 0.25 percentage point cut and a 6.2 percent probability of a 0.50 percentage point cut. The committee deciding to leave the target unchanged at 5.25 percent to 5.50 percent is assigned a probability of only 35.9 percent.
Image of “a woman shopping in a grocery store” generated by ChatGTP 4o.
Today (June 12) we had the unusual coincidence of the Bureau of Labor Statistics (BLS) releasing its monthly report on the consumer price index (CPI) on the same day that the Federal Open Market Committee (FOMC) concluded a meeting. The CPI report showed that the inflation rate had slowed more than expected. As the following figure shows, the inflation rate for May measured by the percentage change in the CPI from the same month in the previous month—headline inflation (the blue line)—was 3.3 percent—slightly below the 3.4 percent rate that economists surveyed by the Wall Street Journal had expected, and slightly lower than the 3.4 percent rate in April. Core inflation (the red line(—which excludes the prices of food and energy—was 3.4 percent in May, down from 3.6 percent in April and slightly lower than the 3.5 percent rate that economists had been expecting.
As the following figure shows, if we look at the 1-month inflation rate for headline and core inflation—that is the annual inflation rate calculated by compounding the current month’s rate over an entire year—the declines in the inflation rate are much larger. Headline inflation (the blue line) declined from 3.8 percent in April to 0.1 percent in May. Core inflation (the red line) declined from 3.6 percent in April to 2.0 percent in May. Overall, we can say that inflation has cooled in May and if inflation were to continue at the 1-month rate, the Fed will have succeeded in bringing the U.S. economy in for a soft landing—with the annual inflation rate returning to the Fed’s 2 percent target without the economy being pushed into a recession.
But two important notes of caution:
1. It’s hazardous to rely to heavily on data from a single month. Over the past year, the BLS has reported monthly inflation rates that were higher than economists expected and rates that was lower than economists expected. The current low inflation rate would have to persist over at least a few more months before we can safely conclude that the Fed has achieved a safe landing.
2. As we discuss in Macroeconomics, Chapter 15, Section 15.5 (Economics, Chapter 25, Section 25.5), the Fed uses the personal consumption expenditures (PCE) price index, rather than the CPI in evaluating whether it is hitting its 2 percent inflation target. So, today’s encouraging CPI data would have to carry over to the PCE data that the Bureau of Economic Analysis (BEA) will release on January 28 before we can conclude that inflation as the Fed tracks it did in fact slow significantly in April.
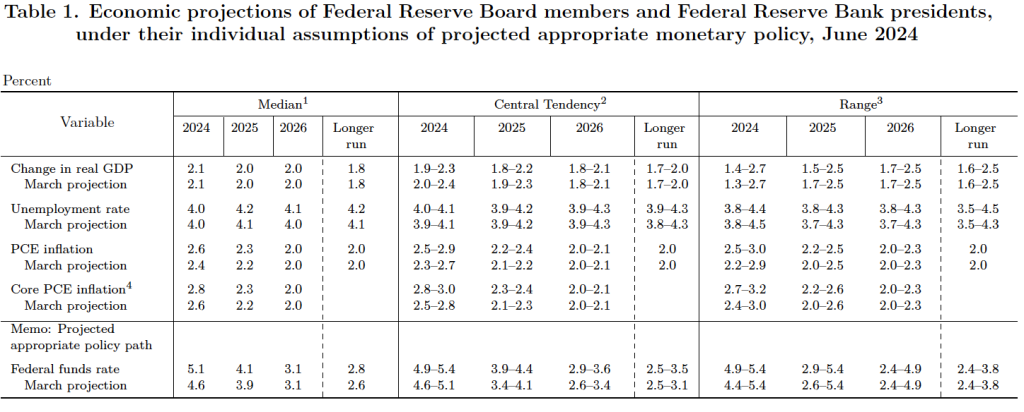
The BLS released the CPI report at 8:30 am eastern time. The FOMC began its meeting later in the day and so committee members were able to include in their deliberations today’s CPI data along with other previously available information on the state of the economy. At the close of the meeting, , the FOMC released a statement in which it stated, as expected, that it would leave its target range for the federal funds rate unchanged at 5.25 percent to 5.50 percent. After the meeting, the committee also released—as it typically does at its March, June, September, and December meetings—a “Summary of Economic Projections” (SEP), which presents median values of the committee members’ forecasts of key economic variables. The values are summarized in the following table, reproduced from the release.
The table shows that compared with their projections in March—the last time the FOMC published the SEP—committee members were expecting higher headline and core PCE inflation and a higher federal funds rate at the end of this year. In the long run, committee members were expecting a somewhat highr unemployment rate and somewhat higher federal funds rate than they had expected in March.
Note, as we discuss in Macreconomics, Chapter 14, Section 14.4 (Economics, Chapter 24, Section 24.4 and Essentials of Economics, Chapter 16, Section 16.4), there are twelve voting members of the FOMC: the seven members of the Board of Governors, the president of the Federal Reserve Bank of New York, and presidents of four of the other 11 Federal Reserve Banks, who serve one-year rotating terms. In 2024, the presidents of the Richmond, Atlanta, San Francisco, and Cleveland Feds are voting members. The other Federal Reserve Bank presidents serve as non-voting members, who participate in committee discussions and whose economic projections are included in the SEP.
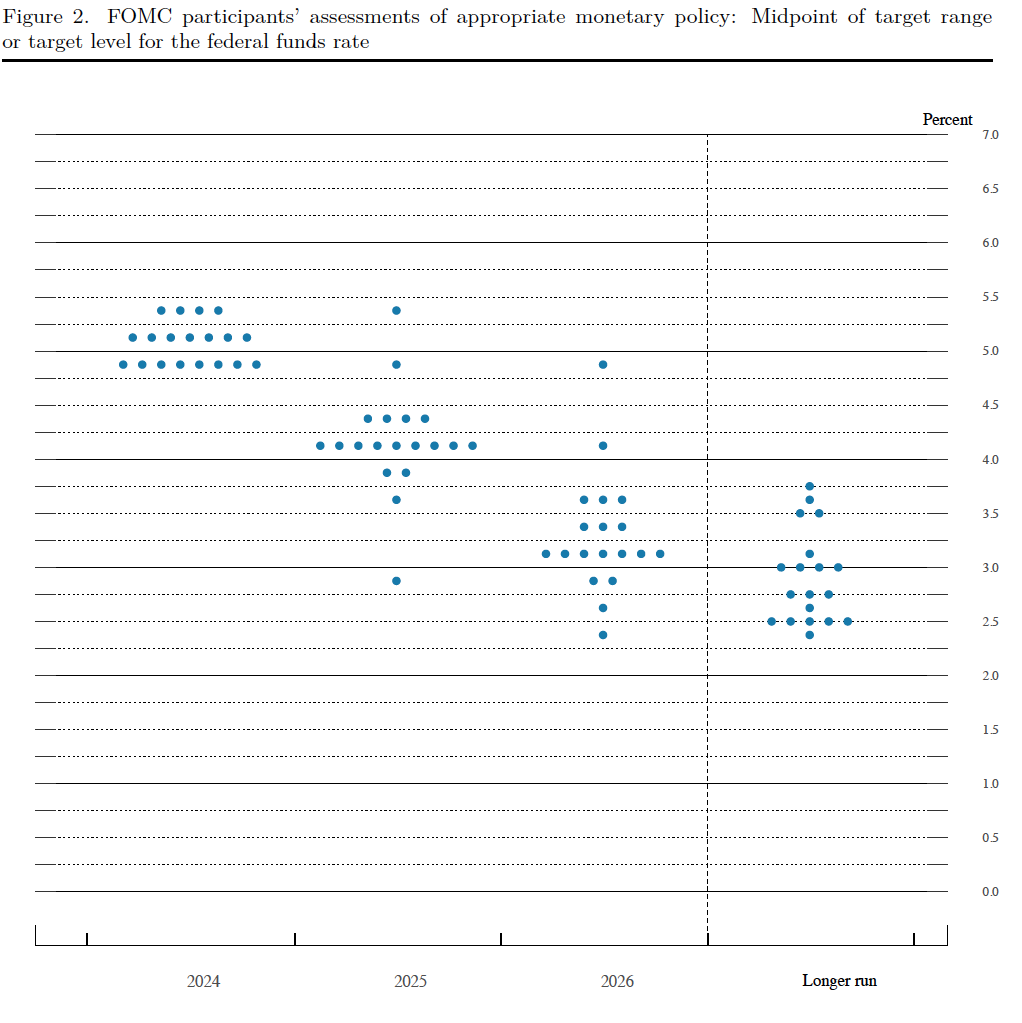
Prior to the meeting there was much discussion in the business press and among investment analysts about the dot plot, shown below. Each dot in the plot represents the projection of an individual committee member. (The committee doesn’t disclose which member is associated with which dot.) Note that there are 19 dots, representing the 7 members of the Fed’s Board of Governors and all 12 presidents of the Fed’s district banks.
The plots on the far left of the figure represent the projections of each of the 19 members of the value of the federal funds rate at the end of 2024. Four members expect that the target for the federal funds rate will be unchanged at the end of the year. Seven members expect that the committee will cut the target range once, by 0.25 percentage point, by the end of the year. And eight members expect that the cut target range twice, by a total of 0.50 percent point, by the end of the year. Members of the business media and financial analysts were expecting tht the dot plot would project either one or two target rate cuts by the end of the year. The committee was closely divided among those two projections, with the median projection being for a single rate cut.
In its statement following the meeting, the committee noted that:
“In considering any adjustments to the target range for the federal funds rate, the Committee will carefully assess incoming data, the evolving outlook, and the balance of risks. The Committee does not expect it will be appropriate to reduce the target range until it has gained greater confidence that inflation is moving sustainably toward 2 percent. In addition, the Committee will continue reducing its holdings of Treasury securities and agency debt and agency mortgage‐backed securities. The Committee is strongly committed to returning inflation to its 2 percent objective.”
In his press conference after the meeting, Fed Chair Jerome Powell noted that the morning’s CPI report was a “Better inflation report than nearly anyone expected.” But, Powell also noted that: “You don’t want to be motivated any one data point.” Reinforcing the view quoted above in the committee’s statement, Powell emphasized that before cutting the target for the federal funds rate, the committee would need “Greater confidence that inflation is moving back to 2% on a sustainable basis.”
In summary, today’s CPI report was an indication that the Fed is on track to bring about a soft landing, but the FOMC will be closely analyzing macroeconomic data over at least the next few months before it is willing to cut its target for the federal funds rate.
A meeting of the Federal Open Market Committee (Photo from federalreserve.gov)
On Friday, May 31, the Bureau of Eeconomic Analysis (BEA) released its “Personal Income and Outlays” report for April, which includes monthly data on the personal consumption expenditures (PCE) price index. Inflation as measured by changes in the consumer price index (CPI) receives the most attention in the media, but the Federal Reserve looks instead to inflation as measured by changes in the PCE price index to evaluate whether it’s meeting its 2 percent annual inflation target.
The following figure shows PCE inflation (blue line) and core PCE inflation (red line)—which excludes energy and food prices—for the period since January 2015 with inflation measured as the change in the PCE from the same month in the previous year. Measured this way, PCE inflation in April was 2.7 percent, which was unchanged since March. Core PCE inflation was also unchanged in April at 2.8 percent. (Note that carried to two digits past the decimal place, both measures decreased slightly in April.)
The following figure shows PCE inflation and core PCE inflation calculated by compounding the current month’s rate over an entire year. (The figure above shows what is sometimes called 12-month inflation, while this figure shows 1-month inflation.) Measured this way, PCE inflation declined from 4.1 percent in March to 3.1 percent in April. Core PCE inflation declined from 4.1 percent in March to 3.0 percent in April. This decline may indicate that inflation is slowing, but data for a single month should be interpreted with caution and, even with this decline, inflation is still above the Fed’s 2 percent target.
The following figure shows another way of gauging inflation by including the 12-month inflation rate in the PCE (the same as shown in the figure above—although note that PCE inflation is now the red line rather than the blue line), inflation as measured using only the prices of the services included in the PCE (the green line), and the trimmed mean rate of PCE inflation (the blue line). Fed Chair Jerome Powell has said that he is particularly concerned by elevated rates of inflation in services. The trimmed mean measure is compiled by economists at the Federal Reserve Bank of Dallas by dropping from the PCE the goods and services that have the highest and lowest rates of inflation. It can be thought of as another way of looking at core inflation by excluding the prices of goods and services that had particularly high or particularly low rates of inflation during the month.
Inflation using the trimmed mean measure was 2.9 percent in April, down from 3.0 percent in March. Inflation in services remained high, although it declined slightly from 4.0 percent in March to 3.9 percent in April.
It seems unlikely that this month’s PCE data will have much effect on when the members of the Fed’s policy-making Federal Open Market Committee (FOMC) will decide to lower the target for the federal funds rate. The next meeting of the FOMC is June 11-12. That meeting is one of the four during the year at which the committee publishes a Summary of Economic Projections (SEP). The SEP should provide greater insight into what committee members expect will happen with inflation during the remained of the year and whether it’s likely that the committee will lower its target for the federal funds rate this year.
Inflation was running higher than expected during the first three months of 2024, indicating that the trend in late 2023 of declining inflation had been interrupted. At the beginning of the year, many economists and analysts had expected that the Federal Reserve’s policy-making Federal Open Market Committee (FOMC) would begin cutting its target for the federal funds rate sometime in the middle of the year. But with inflation persisting above the Fed’s 2 percent inflation target, it has become likely that the FOMC will wait until later in the year to start cutting its target and might decide to leave the target unchanged through the remainder of 2024.
Accordingly, economists and policymakers were intently awaiting the report from the Bureau of Labor Statistics (BLS) on the consumer price index (CPI) for April. The report released this morning showed a slight decrease in inflation, although the inflation rate remains well above the Fed’s 2 percent target. (Note that, as we discuss in Macroeconomics, Chapter 15, Section 15.5 (Economics, Chapter 25, Section 25.5), the Fed uses the personal consumption expenditures (PCE) price index, rather than the CPI in evaluating whether it is hitting its 2 percent inflation target.)
The inflation rate for April measured by the percentage change in the CPI from the same month in the previous month—headline inflation—was 3.4 percent—about the same as economists had expected—down from 3.5 percent in March. As the following figure shows, core inflation—which excludes the prices of food and energy—was 3.6 percent in April, down from 3.8 percent in March.
If we look at the 1-month inflation rate for headline and core inflation—that is the annual inflation rate calculated by compounding the current month’s rate over an entire year—the declines in the inflation rate are larger. Headline inflation declined from 4.6 percent in March to 3.8 percent in April. Core inflation declined from 4.4 percent in March to 3.6 percent in April. Note that the value for core inflation is the same whether we measure over 12 months or over 1 month. Overall, we can say that inflation seems to have cooled in April, but it still remains well above the Fed’s 2 percent target.
As has been true in recent months, the path of inflation in the prices of services has been concerning. As we’ve noted in earlier posts, Federal Reserve Chair Jerome Powell has emphasized that as supply chain problems have gradually been resolved, inflation in the prices of goods has been rapidly declining. But inflaion in services hasn’t declined nearly as much. Powell has been particularly concernd about how slowly the price of housing has been declining, a point he made again in the press conference that followed the most recent FOMC meeting.
The following figure shows the 1-month inflation rate in service prices and in service prices not included including housing rent. The figure shows that inflation in all service prices has been above 4 percent in every month since July 2023, but inflation in service prices slowed markedly from 6.6 percent in March to 4.4 percent in April. Inflation in service prices not including housing rent declined more than 50 percent, from 8.9 percent in March to 3.4 percent in April. But, again, even though inflation in service prices declined in April, as the figure shows, the 1-month inflation in services is volatile and even these smaller increases aren’t yet consistent with the Fed meeting its 2 percent inflation target.
Finally, in order to get a better estimate of the underlying trend in inflation, some economists look at median inflation, which is calculated by economists at the Federal Reserve Bank of Cleveland and Ohio State University. If we listed the inflation rate in each individual good or service in the CPI, median inflation is the inflation rate of the good or service that is in the middle of the list—that is, the inflation rate in the price of the good or service that has an equal number of higher and lower inflation rates. As the following figure shows, at 4.3 percent, median inflation in April was unchanged from its value in March.
Today’s report was good news for the Fed in its attempts to reduce the inflation rate to its 2 percent target without pushing the U.S. economy into a recession. But Fed Chair Jerome Powell and other members of the FOMC have made clear that they are unlikely to begin cutting the target for the federal funds rate until they receive several months worth of data indicating that inflation has clearly resumed the downward path it was on during the last months of 2023. The unexpectedly high inflation data for the first three months of 2024 has clearly had a significant effect on Fed policy. Powell was quoted yesterday as noting that: “We did not expect this to be a smooth road, but these [inflation readings] were higher than I think anybody expected,”