

Image generated by GTP-4o.
The “Employment Situation” report (often referred to as the “jobs report”), which is released monthly by the Bureau of Labor Statistics (BLS), is always closely followed by economists and policymakers because it provides important insight in the current state of the U.S. economy. This month’s report is considered particularly important because last month’s report indicated that the labor market might be weaker than most economists had believed. As we discussed in a recent blog post, late last month Fed Chair Jerome Powell signaled that the Fed’s policy-making Federal Open Market Committee (FOMC) was likely to cut its target for the federal funds rate at its next meeting on September 17-18.
Economists and investment analysts had speculated that following August’s unexpectedly weak jobs report, another weak report might lead the FOMC to cut its federal funds target by 0.50 percentage rate rather than by the more typical 0.25 percent point. The jobs report the BLS released this morning (September 6) was mixed, showing a somewhat lower than expected increase in employment as measured by the establishment survey, but higher wage growth.
The jobs report has two estimates of the change in employment during the month: one estimate from the establishment survey, often referred to as the payroll survey, and one from the household survey. As we discuss in Macroeconomics, Chapter 9, Section 9.1 (Economics, Chapter 19, Section 19.1), many economists and policymakers at the Federal Reserve believe that employment data from the establishment survey provides a more accurate indicator of the state of the labor market than do either the employment data or the unemployment data from the household survey. (The groups included in the employment estimates from the two surveys are somewhat different, as we discuss in this post.)
According to the establishment survey, there was a net increase of 142,000 jobs during August. This increase was below the increase of 161,000 that economists had forecast in a survey by the Wall Street Journal. The following figure, taken from the BLS report, shows the monthly net changes in employment for each month during the past two years. The BLS revised lower its estimates of the net increase in jobs during June and July by a total of 86,000. (The BLS notes that: “Monthly revisions result from additional reports received from businesses and government agencies since the last published estimates and from the recalculation of seasonal factors.”)
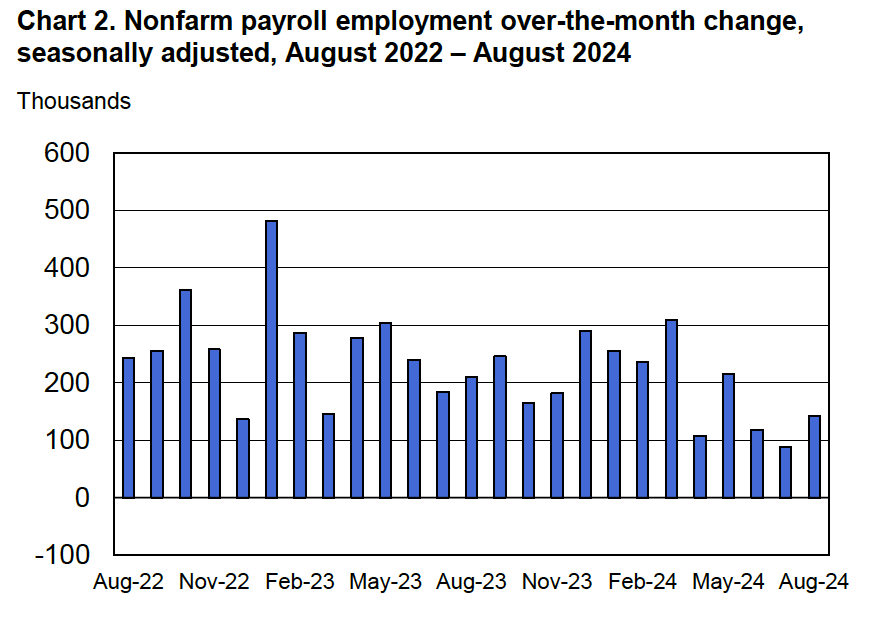
The BLS’s estimate of average monthly job growth during the last three months is now 116,000, a significant decline from an average of 211,000 per month during the previous three months and 251,000 per month during 2023.
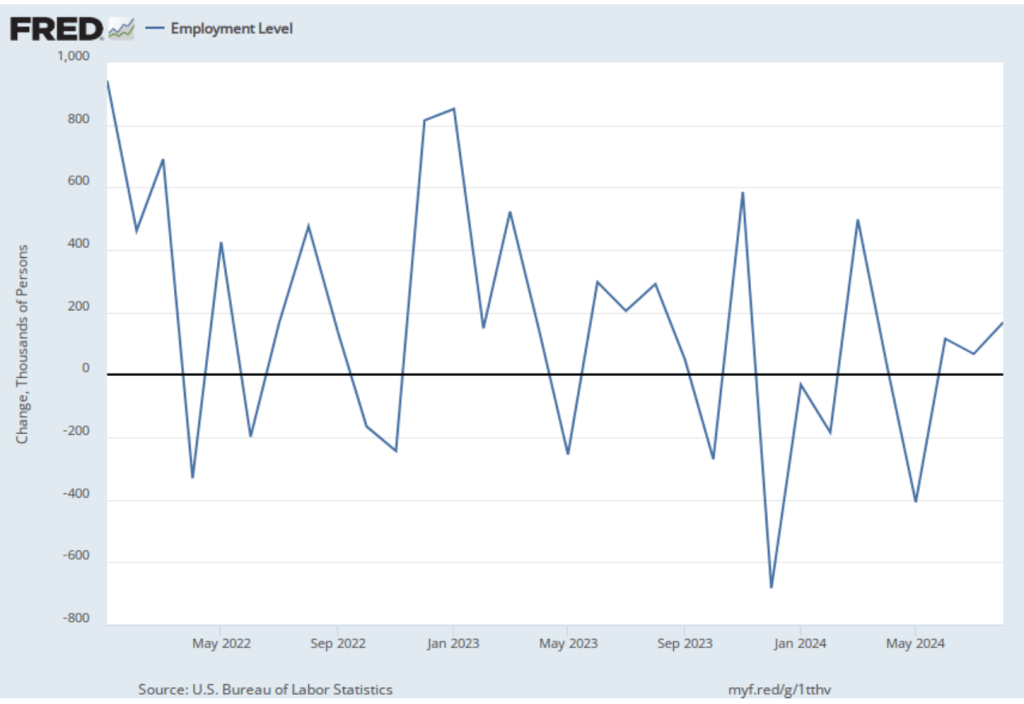
As the following figure shows, the net change in jobs from the household survey moves much more erratically than does the net change in jobs in the establishment survey. The net change in jobs as measured by the household survey increased from 67,000 in July to 168,000 in August. So, in this case the direction of change in the two surveys was the same—an increase in the net number of jobs created in August compared with July.
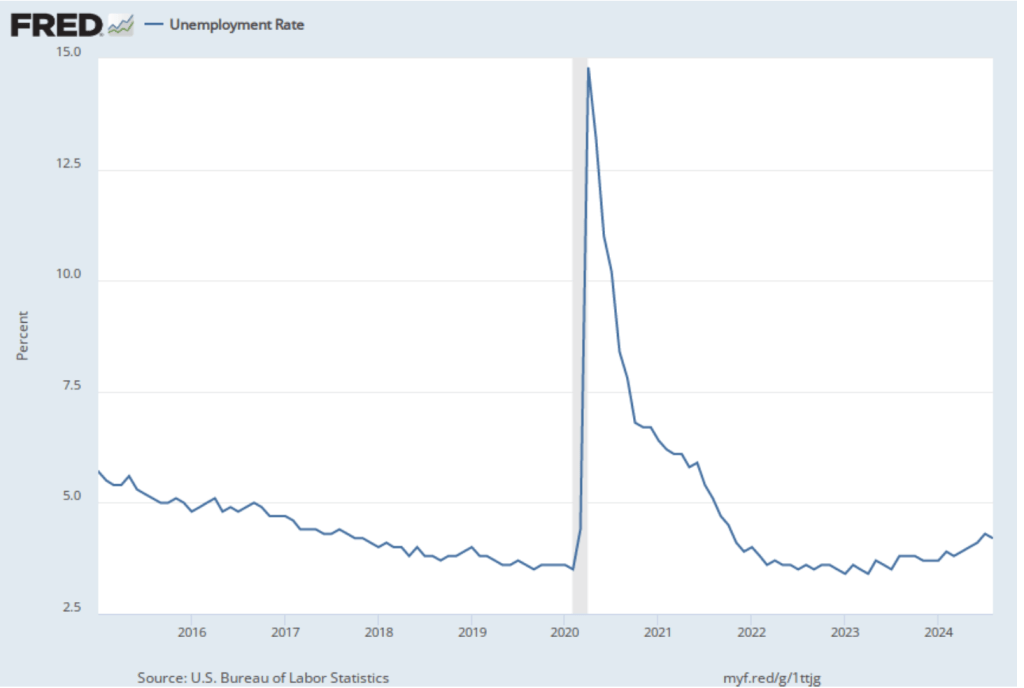
As the following figure shows, the unemployment rate, which is also reported in the household survey, decreased from 4.3 percent to 4.2 percent—breaking what had been a five month string of unemployment rate increases.
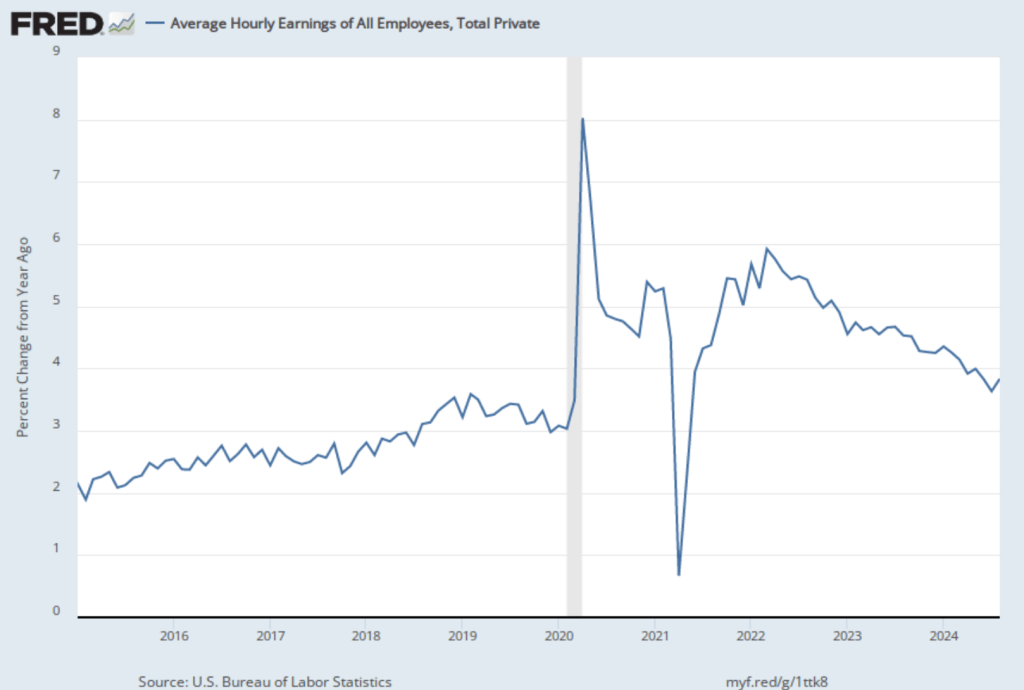
The establishment survey also includes data on average hourly earnings (AHE). As we note in this post, many economists and policymakers believe the employment cost index (ECI) is a better measure of wage pressures in the economy than is the AHE. The AHE does have the important advantage that it is available monthly, whereas the ECI is only available quarterly. The following figure shows the percentage change in the AHE from the same month in the previous year. AHE increased 3.8 percent in August, up from a 3.6 percent increase in July.
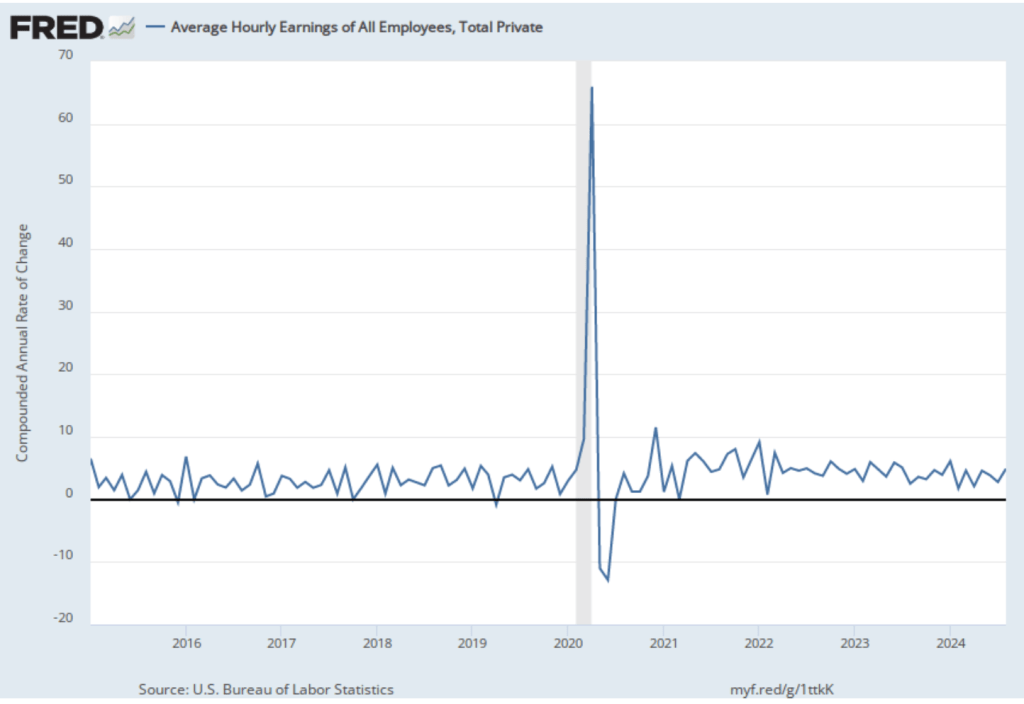
The following figure shows wage inflation calculated by compounding the current month’s rate over an entire year. (The figure above shows what is sometimes called 12-month wage inflation, whereas this figure shows 1-month wage inflation.) One-month wage inflation is much more volatile than 12-month inflation—note the very large swings in 1-month wage inflation in April and May 2020 during the business closures caused by the Covid pandemic.
The 1-month rate of wage inflation of 4.9 percent in August is a significant increase from the 2.8 percent rate in July, although it’s unclear whether the increase represented renewed upward wage pressure in the labor market or reflected the greater volatility in wage inflation when calculated this way.
What effect is this jobs report likely to have on the FOMC’s actions at its September meeting? One indication comes from investors who buy and sell federal funds futures contracts. (We discuss the futures market for federal funds in this blog post.) As shown in the following figure, today these investors assign a probability of 73.0 percent to the FOMC cutting its target for the federal funds rate by 0.25 percentage point at its next meeting and a probability of only 27.0 percent that the cut will be 0.50 percentage point. In contrast, after the last jobs report was interpreted to indicate a dramatic slowing of the economy, investors assigned a probability of 79.5 percent to a 0.50 cut in the federal funds rate target.
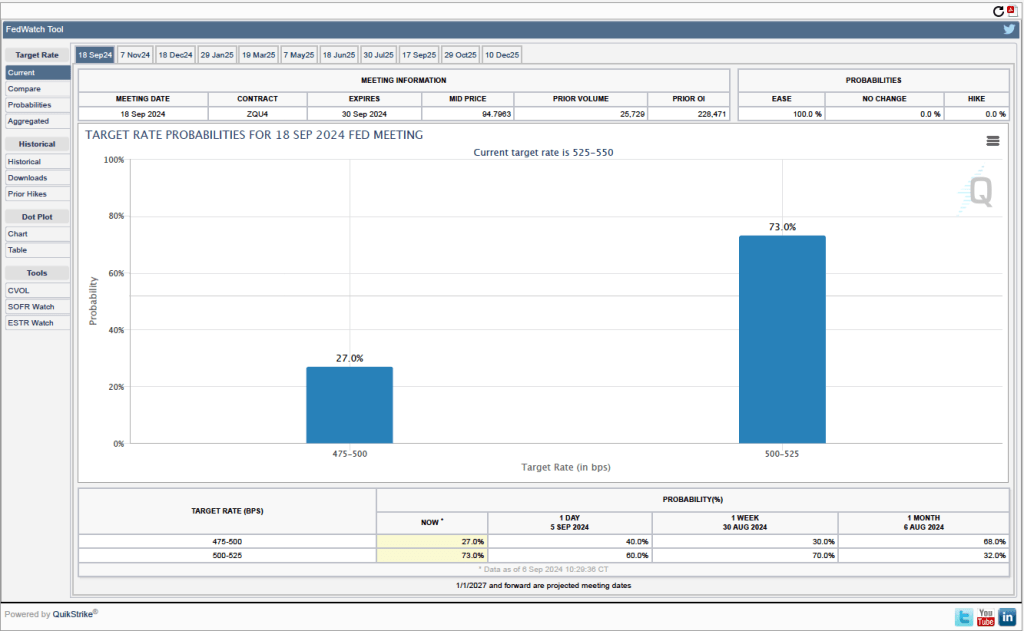
It seems most likely following today’s mixed job report that the FOMC will cut its target for the federal funds rate by 0.25 percent point from the current target range of 5.25 percent to 5.50 percent to a range of 5.00 percent to 5.25 percent. The report doesn’t indicate the significant weakening in the labor market that was probably needed to push the committee to cutting its target by 0.50 percent point.
