Technological Change Smacks Snacks

Photo from cnbc.com

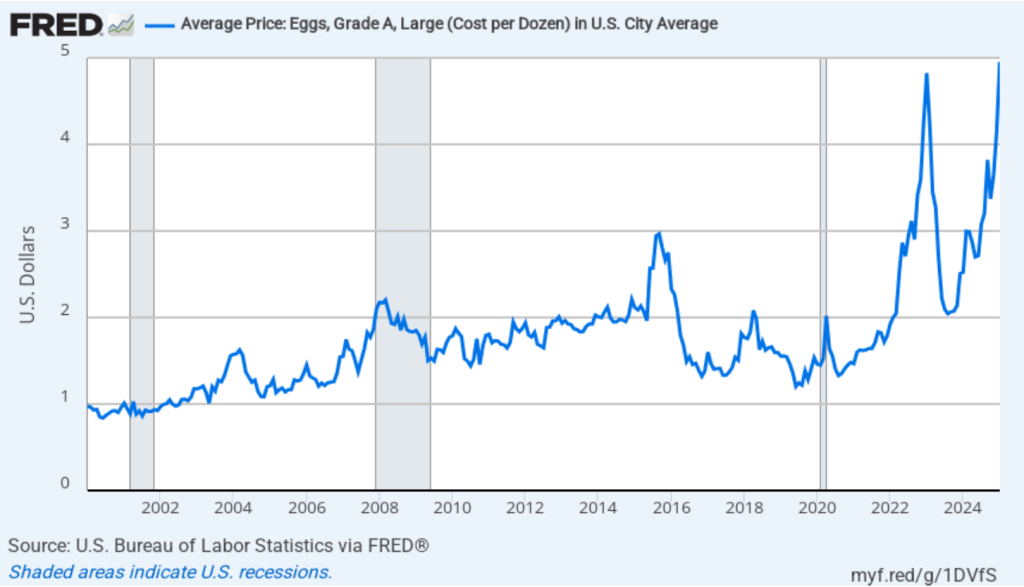
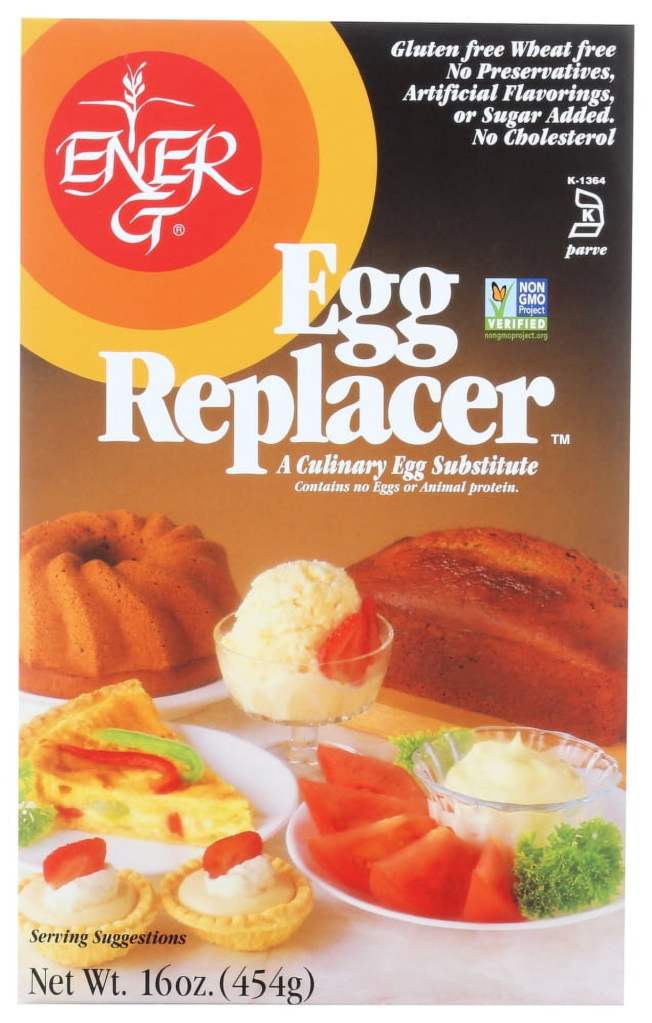
What causes consumer demand for a product to decline?  Why does demand for some products suddenly rise?  As we discuss in Chapter 3, changes in the relative price of a substitute or a complement cause the demand for a good to shift. For instance, the following figure shows the recent rapid increase in the price of eggs, due in part from the spread of bird flu. We would expect that the increase in the price of eggs will shift to the right the demand curve for egg substitutes, such as the product shown below the figure.

Sometimes a shift in the demand for a product represents a change in consumer tastes. For instance, as we discuss in an Apply the Concept in Chapter 3, for decades most people wore a hat while outdoors. The first photo below shows people walking down a street in New York City in the 1920s. Beginning in the 1960s, hats started to fall out of fashion. As the second photo shows, today few people wear hats—unless they’re walking outside during the winter in the Northeast or the Midwest!

Photo from the New York Daily News

Photo from the New York Times

Technological change can also affect the demand for goods. For example, the development of network television, beginning in the late 1940s, reduced the demand for tickets to movie theaters. Similarly, the development of the internet reduced the demand for physical newspapers.

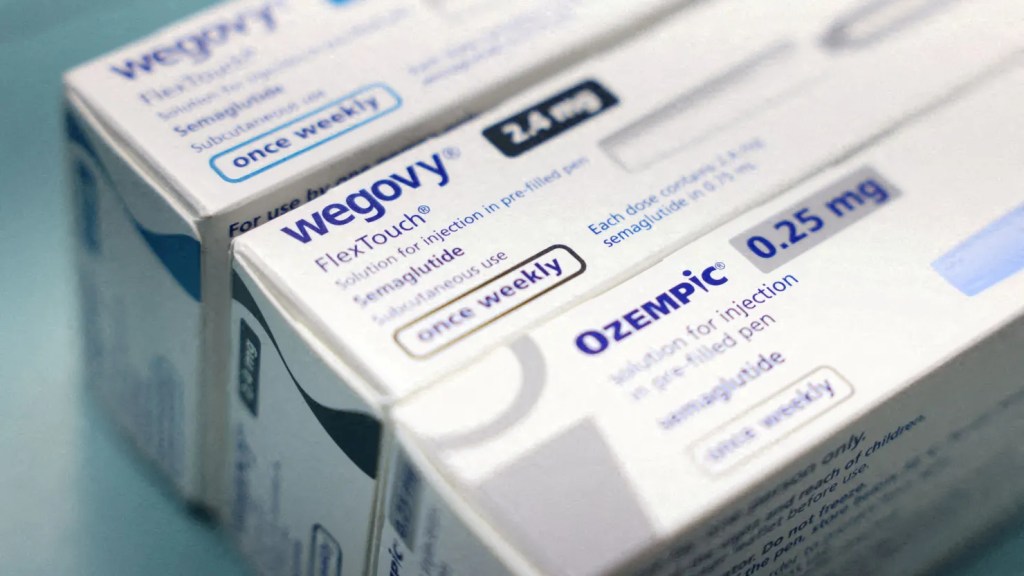
A recent example of technological change having a substantial effect on a number of consumer goods is the introduction of GLP–1 drugs, beginning in 2005. These drugs, such as Ozempic and Mounjaro, were first developed to treat type 2 diabetes. The drugs were found to significantly reduce appetite in most users, leading to users losing weight. Accordingly, doctors began to prescribe the drugs to treat obesity. By 2025, about half of the users of GLP–1 drugs were doing so to lose weight. A recent article in the Washington Post quoted Jan Hatzius, chief economist at Goldman Sachs, as predicting that by 2028, 60 million people in the United States will be taking a GLP–1 drug.

Many consumers who use these drugs decide to change the mix of foods they eat. Typically, users demand fewer ultra-processed foods, such as chips, cookies, and soft drinks. The percentage of people in the United States who are considered obese—having a body mass index (BMI) of 30 or greater—had been increasing for decades before declining slightly in 2023, the most recent year with available data. It seems likely that the increasing use of GLP–1 drugs helps to explain the decline in obesity.

People taking these drugs have also typically increased the share of foods they eat with higher levels of protein and fiber. These changes in diet are likely to lead to improved health, reducing the demand for some medical services. The number of people experiencing significant weight loss has already begun to reduce demand for extra-large clothing sizes and increase the demand for medium clothing sizes.

How much has the use of Ozempic and similar drugs reduced the demand for snacks? A recent study by Sylvia Hristakeva and Jura Liaukonyt of Cornell University and Leo Feler of Numerator, a market research firm, presents numerical estimates of changes in demand for different foods by users of GLP–1 drugs. The authors assembled a representative sample of 150,000 U.S. households and the households’ grocery purchases from July 2022 through September 2024. They estimate that the share of the U.S. population using a GLP–1 drug increased from 5.5% in October 2023 to 8.8% in July 2024.

The study finds that households with at least one person using a GLP–1 drug reduced their total grocery shopping by 5.5 percent or $416. The study gathered data on changes in the categories of food that households were buying six months after at least one person in the household began using one of these drugs. The figure below is compiled from data in the study.

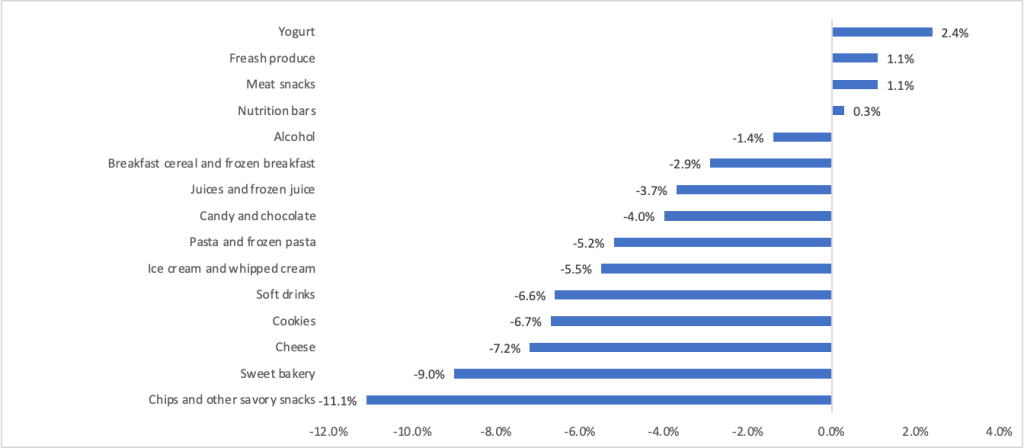
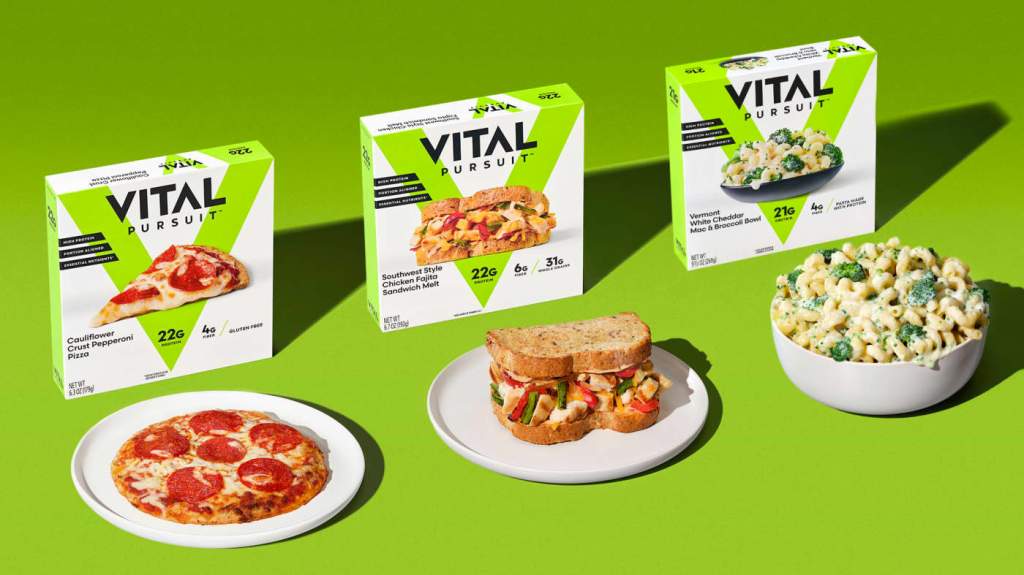
As expected, purchases of snacks declined. The category of “chips and other savor snacks” (bottom row in the figure) declined by more than 11 percent. Purchases of sweet bakery products, cheese, cookies, soft drinks, ice cream, and pasta all declined by more than 5 percent. Purchases of yogurt, fresh produce, meat snacks, and nutrition bars, all increased. An article in the Wall Street Journal noted that “food makers are starting to understand better and cater to, in some cases with products specifically designed for” users of this drug. The image below shows some of the new products that Nestle—a major candy producer—has introduced to appeal to users of GLP–1 drugs. Nestle’s Vital Pursuit line of frozen packaged foods contain high levels of protein and fiber.

It’s too early to gauge the full effects of GLP–1 drugs on consumer demand. But it’s already clear that GLP–1 drugs are a striking example of technological change affecting demand in a major industry

Solved Problem: The Houthis and the Price Elasticity of Demand for Shipping

Map from the Wall Street Journal.

Supports: Microeconomics and Economics Chapter 6, Section 6.2 and Esstentials of Economics, Chapter 7, Section 7.6.

The Houthis, a rebel group based in Yemen, have been attacking shipping in the Red Sea, which freighters sail through after exiting the Suez Canal. About 30 percent of global shipping travels through the Suez Canal. An article in the Financial Times noted that maritime insurance firms have increased their charges for insuring freight passing through the Suez Canal by about $6,000 per container.” The article also noted that: “Freight demand is price inelastic in the short run and transport isn’t a big part of overall costs.” And that “the average container holds about $100,000 worth of goods wholesale, which will be sold at destination for $300,000.”  

  1. Is there a connection between the observation that freight demand is price inelastic and the observation that the charge for transporting goods isn’t a large fraction of the price of the goods shipped by container? Briefly explain.
  2. The article notes that the main alternative to transporting freight by ship is to transport it by air, but if only 1 percent of freight sent by ship were to be sent by air instead, all the available flight capacity would be filled. Does this fact also have relevance to explaining the price inelasticity of demand for transporting freight by ship? Briefly explain.

Solving the Problem

Step 1: Review the chapter material. This problem is about the determinants of the price elasticity of demand, so you may want to review Microeconomics and Economics, Chapter 6, Section 6.2 (Essentials of Economics, Chapter 7, Section 7.6), “The Determinants of the Price Elasticity of Demand and Total Revenue.”

Step 2: Answer part a. by explaining why the small fraction that transportation is of the total price of the goods in a container of freight makes it more likely that the demand for shipping is price inelastic in the short run.  This section of the chapter notes that goods and services that are only a small fraction of a consumer’s budget tend to have less elastic demand than do goods and services that are a large faction. In this case, the consumer is a firm shipping freight. Because the $6,000 increase per container in the cost of shipping freight makes up only 2 percent of the dollar amount the freight can be sold for, shippers are likely not to significantly reduce the quantity of shipping services they demand. Note, though, that the article refers to the price elasticity of freight demand “in the short run.” It’s possible that over a longer period of time the market for transporting freight by ship may adjust by, for instance, firms offering to ship freight by air increasing their capacity and lowering their prices. In that case, the price elasticity of demand for transporting freight by ship will be higher in the long run than in the short tun.

Step 3: Answer part b. by explaining whether the limited amount of available capacity for sending freight by air may help explain why the demand for sending freight by ship is price inelastic.  This section of the chapter notes that the most important determinant of the price elasticity of demand for a good or service is the availability of close substitutes. That there is only a small amount of unused capacity to transport goods by air indicates that transporting goods by air is not a close substitute for transporting goods by sea. Therefore, we would expect that this factor contributes to the demand for transporting goods by sea being price inelastic in the short run.

The Price Elasticity of Demand for Subway and Bus Rides

Supports: Microeconomics, Chapter 6, Section 6.3, Economics, Chapter 6, Section 6.3, and Essentials of Economics, Chapter 7, Section 7.7.

New York City subway. (Photo from the New York Times.)

An article on Crain’s New York Business noted that the Metropolitan Transit Authority (MTA), which runs New York City’s public transportation system was increasing the fare for a bus or subway ride from $2.75 to $2.90. The article noted that: “Revenue generated by the fare increase is expected to cover the [MTA’s] operating expenses and help keep up with inflation.”

a.  What is the MTA assuming about the price elasticity of demand for subway and bus rides in New York City? How plausible do you find this assumption? Briefly explain.

b. What is the largest percentage decline in subway and bus rides that the MTA can experience and still meet its revenue expectations?

Solving the Problem

Step 1:  Review the chapter material. This problem is about the relationship between a price increase on quantity demanded and revenue, so you may want to review the section “The Relationship between Price Elasticity of Demand and Total Revenue.”

Step 2:  Answer part (a) by explaining what the MTA is assuming about the price elasticity of demand for subway and bus rides, and comment on the plausibility of this assumption. If the MTA is expecting that an increase in the price of a subway and bus ride will increase the total revenue it earns from these rides, it must be assuming that the demand for subway and bus rides is price inelastic. If the demand were price elastic, the MTA would earn less revenue following the price increase.

 As we saw in Chapter 6, Section 6.2, the most important determinant of elasticity is the existence of substitutes. In a big city, the most important substitutes to taking public transportation are: (1) people walking, (2) people driving their own cars, or (3) people using a ride-hailing service, such as Uber and Lyft.  People who live close to their destination and who were indifferent between walking and taking public transportation before the price increase, are likely to switch to walking. Given the size of a city like New York, we might expect the number of these people to be relatively small. Driving your own car in a big city has the drawback that heavy traffic may mean it takes longer to drive than to take the bus or subway and paying for parking can be expensive. Using Uber or Lyft is also much more expensive than taking public transportation and may also be slow. It seems likely that current users of public transportation in New York City don’t see these alternatives as close substitutes for the bus or subway. So, it’s plausible for the MTA to assume that the demand for subway and bus rides is price inelastic. 

Step 3:  Answer part (b) by calculating the largest percentage decline in bus and subway rides that the MTA can experience and still meet its revenue expectations. The MTA is increasing the price of subway and bus rides from $2.75 to $2.90 per ride. That is a ($0.15/$2.75) × 100 = 5.5 percent increase. (Note that we would get a somewhat different result if we used the midpoint formula described in Section 6.1.) For the MTA’s revenue to increase as a result of the price increase, the percentage decrease in the quantity demanded of subway rides must be less than the percentage increase in the price. Therefore, the price increase can’t result in a decline of more than 5.5 percent. 

Source:  Caroline Spivak, “Subway and Bus Fares Will Increase Starting Sunday,” crainesnewyork.com, August 18, 2023.