

Image created by ChatGPT
It’s not surprising that employment in health care has been increasing. The National Health Expenditure (NHE) Projections Model of the Centers for Medicare & Medicaid Services estimates that the long-run income elasticity of demand for private personal health care spending is 1.58. So, a 10 percent increase in U.S. disposable personal income will result in the long run in a 15.8 percent increase in private personal health care spending. In other words, we would expect personal health care spending to become an increasing fraction of total household spending. In addition, the median age of the U.S. population has increased from 32.9 years in 1990 to a projected 40.1 years in 2025. As people age, their demand for health care increases. Finally, holding income and age constant, demand for health care has also increased as a result of the increasing effectiveness of medical care in treating disease.
Despite these long-run trends, it’s surprising how dependent increases in U.S. employment have become recently on the growth in health care jobs. The following figure shows monthly changes in a broad measure of health care employment (the blue bars) and in total nonfarm employment (the red bars), using data from the establishment survey from the Bureau of Labor Statistics (BLS). (This blog post yesterday discussed the latest “Employment Situation” report from the BLS.)
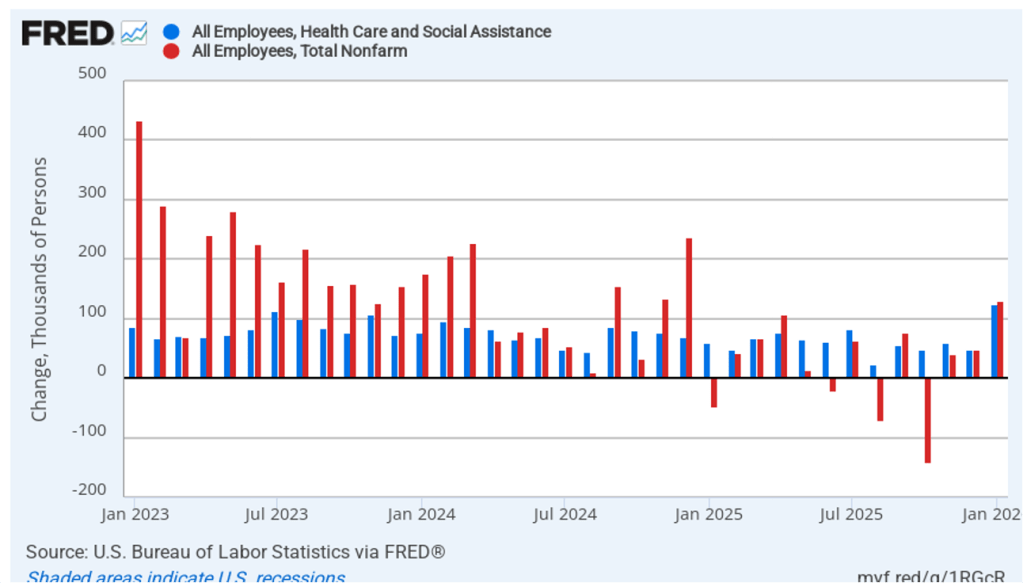
The values for January 2023 through December 2024 show what we might expect—the increase in total employment being significantly larger than the increase in health care employment. During this period, health care employment was about 48.5 percent of total employment. In other words, although health care employment was a key driver of increases in employment, non-health care employment was also steadily increasing. The situation since January 2025 is much different with health care employment increasing by 817,000, while total employment increased by only 311,000. In other words, since January 2025, employment outside of health care (again, broadly defined) has fallen by more than 500,000 jobs.
We can look at longer term trends in health care employment relative to employment in other industries. The following maps show the change over time in the industry with the most employment in each state, using data from the BLS’s “Quarterly Census of Employment and Wages.” The industries are grouped into four broad categories: manufacturing, retail trade, leisure and hospitality, and health care. (Industries are defined as follows using the North American Industry Classification System (NAICS): Manufacturing is NAICS 31–33, Retail trade is NAICS 44–45, Leisure and hospitality is NAICS 72, and health care is NAICS 62.)
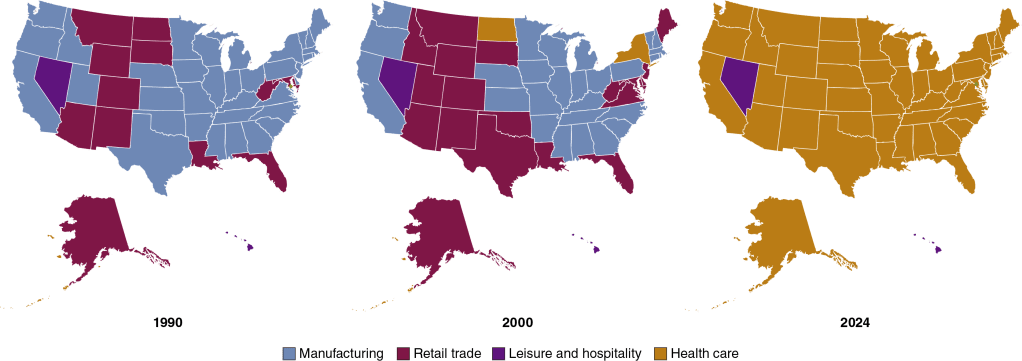
In 1990, manufacturing was the largest source of private employment in most states, and in no state was health care the largest employer. By 2000, manufacturing was still the largest employer in 27 states, but health care had become the largest employer in 2 states. The results for 2024 are strikingly different: Manufacturing was no longer the largest employer in any state, and health care was the largest employer in 48 states—every state except for Hawaii and Nevada.
In 1990, almost twice as many people in the United States worked in manufacturing as worked in health care. In 2024, employment in health care was 80 percent greater than employment in manufacturing. And these trends are likely to continue. The BLS forecast in 2025 that 12 of the 20 fastest-growing occupations over the next 10 years will be in health care.
