Image generated by GTP-4o.
The Bureau of Labor Statistics (BLS) releases the “Employment Situation” report (often called the “jobs report”) monthly. Economists and policymakers follow this report closely because it provides important insight into the current state of the U.S. economy. The October jobs report was released this morning, November 1 As sometimes happens, the data in the report were distorted by unusual events last month, primarily the effects of hurricanes and strikes. The BLS reported the results of its surveys without attempting to correct for these events. With respect to hurricanes, the BLS noted:
“No changes were made to either the establishment or household survey estimation procedures for the October data. It is likely that payroll employment estimates in some industries were affected by the hurricanes; however, it is not possible to quantify the net effect on the over-the-month change in national employment, hours, or earnings estimates because the establishment survey is not designed to isolate effects from extreme weather events. There was no discernible effect on the national unemployment rate from the household survey.”
Economists who participated in various surveys had forecast that payroll employment would increase by 117,500, with the unemployment rate—which is calculated from data in the household survey—being unchanged at 4.1 percent. The forecast of the unemployment rate was accurate, as the BLS reported a 4.1 percent unemployment rate in October. But the BLS reported that payroll employment had increased by only 12,000. In addition, the BLS revised downward its estimates of the employment increases in August and September by a total of 112,000. (The BLS notes that: “Monthly revisions result from additional reports received from businesses and government agencies since the last published estimates and from the recalculation of seasonal factors.”) The following figure, taken from the BLS report, shows the net changes in employment for each month during the past two years.
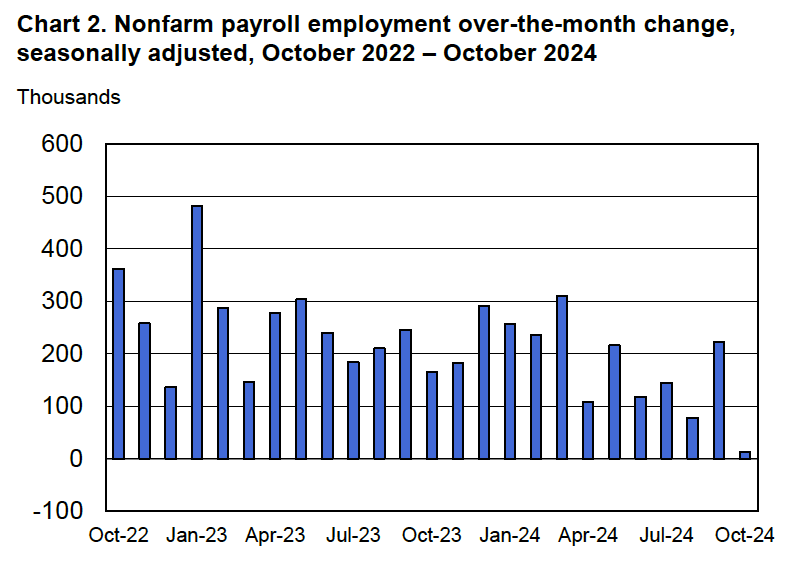
What had initially seemed to be particularly strong growth in employment in September, possibly indicating a significant increase in the demand for labor, has been partially reversed by the data revision.
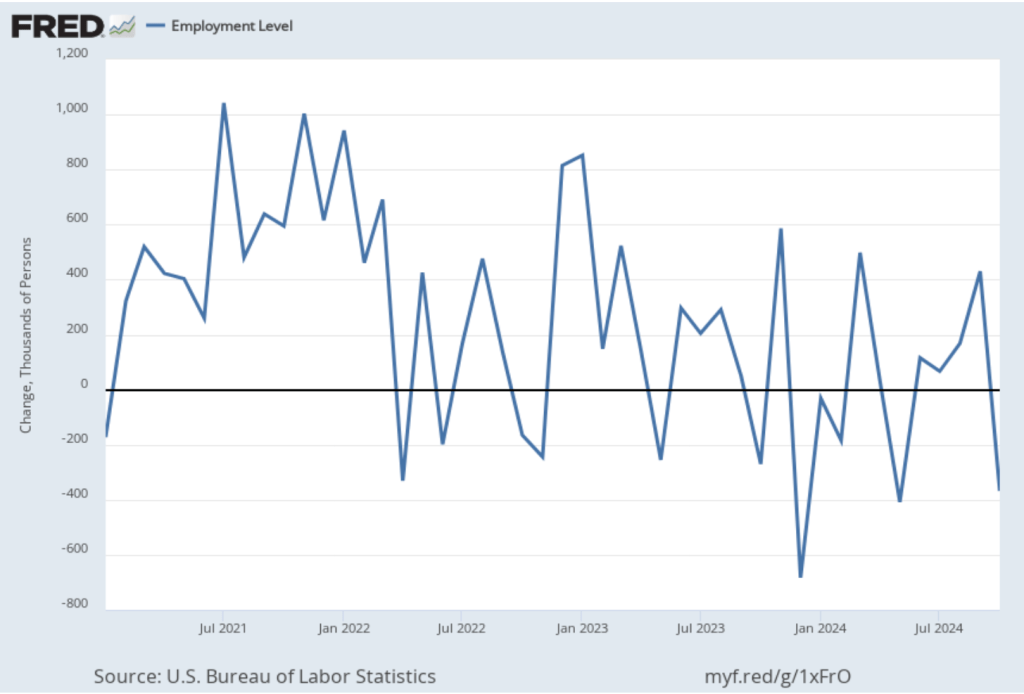
As the following figure shows, the net change in jobs from the household survey moves much more erratically than does the net change in jobs from the establishment survey. The net change in jobs as measured by the household survey for October was a decline of 368,000 jobs after an increase of 430,000 jobs in September. So, the story told by the two surveys was similar: significant weakening in the job market. But we need to keep in mind the important qualification that the job market in some areas of the country had been disrupted by unusual events during the month.
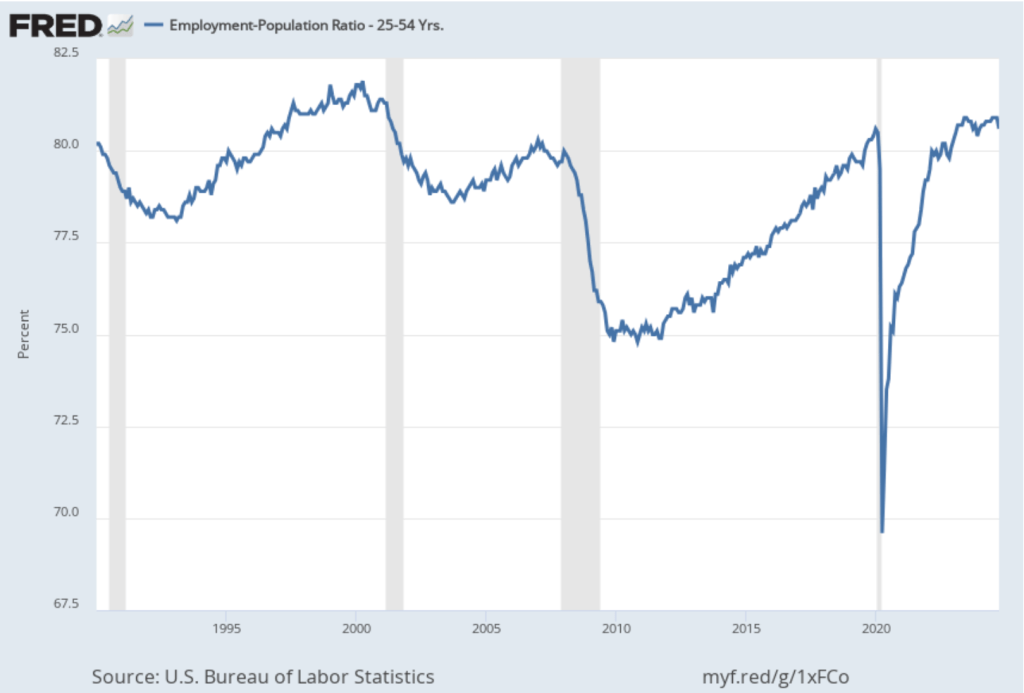
Other data in the jobs report told a more optimistic story of conditions in job market. The following figure shows the employment-population ratio for prime age workers—those aged 25 to 54. Although it declined from 80.9 percent to 80.6 percent, it remained high relative to levels seen since 2001.
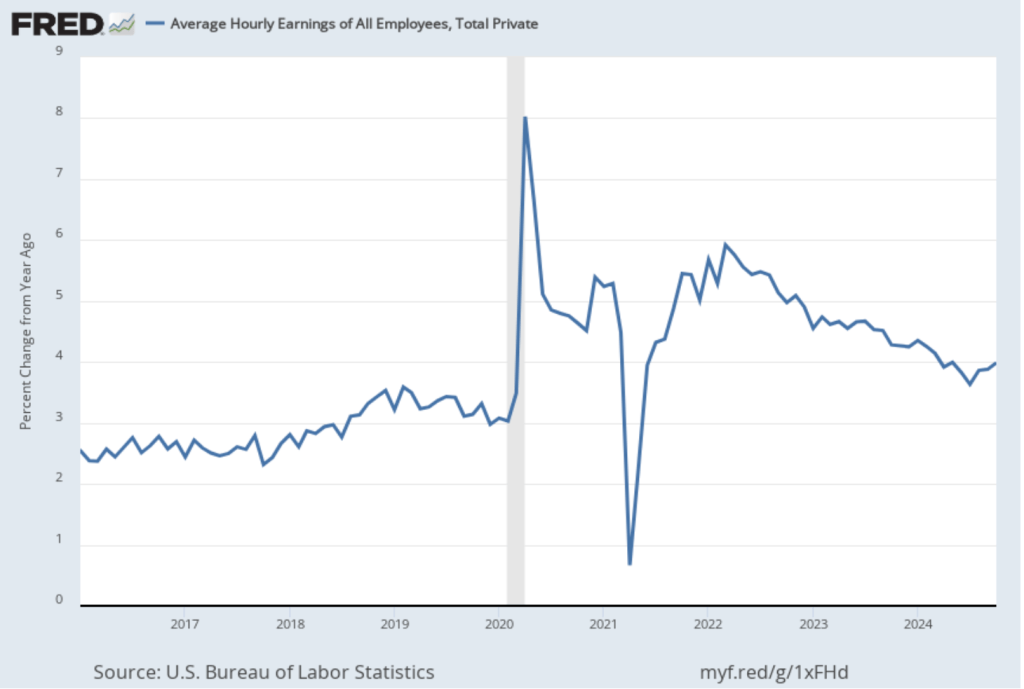
The establishment survey also includes data on average hourly earnings (AHE). As we noted in this post yesterday, many economists and policymakers believe the employment cost index (ECI) is a better measure of wage pressures in the economy than is the AHE. The AHE does have the important advantage that it is available monthly, whereas the ECI is only available quarterly. The following figure shows the percentage change in the AHE from the same month in the previous year. AHE increased 4.0 percent in October, up from a 3.9 percent increase in September.
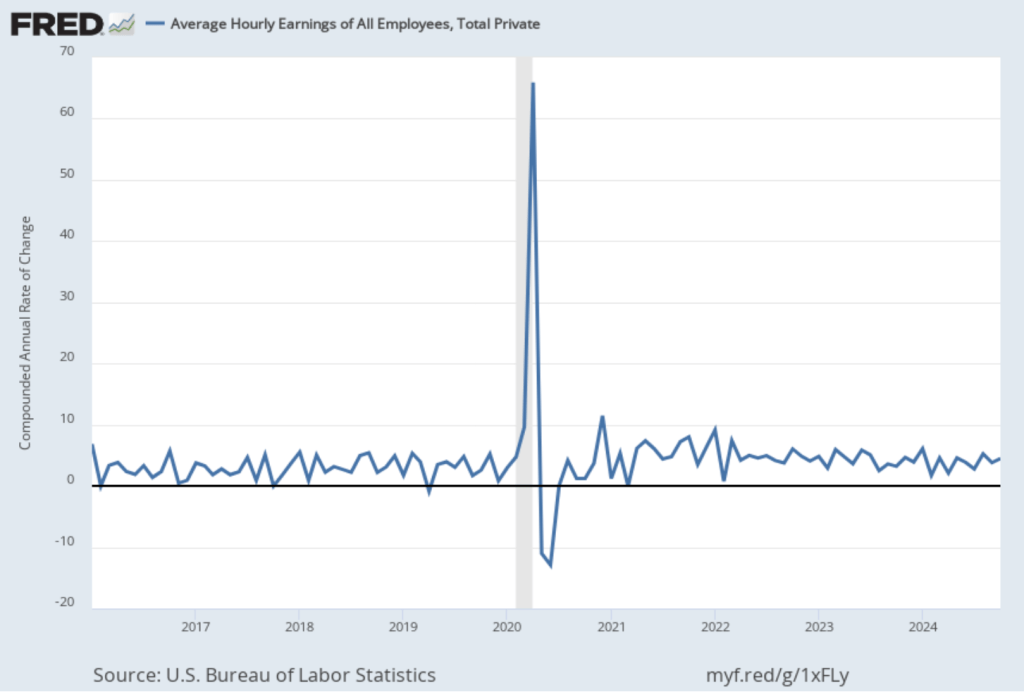
The following figure shows wage inflation calculated by compounding the current month’s rate over an entire year. (The figure above shows what is sometimes called 12-month wage inflation, whereas this figure shows 1-month wage inflation.) One-month wage inflation is much more volatile than 12-month wage inflation—note the very large swings in 1-month wage inflation in April and May 2020 during the business closures caused by the Covid pandemic.
The October 1-month rate of wage inflation was 4.5 percent, an increase from the 3.8 percent rate in September. Whether measured as a 12-month increase or as a 1-month increase, AHE is increasing more rapidly than is consistent with the Fed achieving its 2 percent target rate of price inflation.
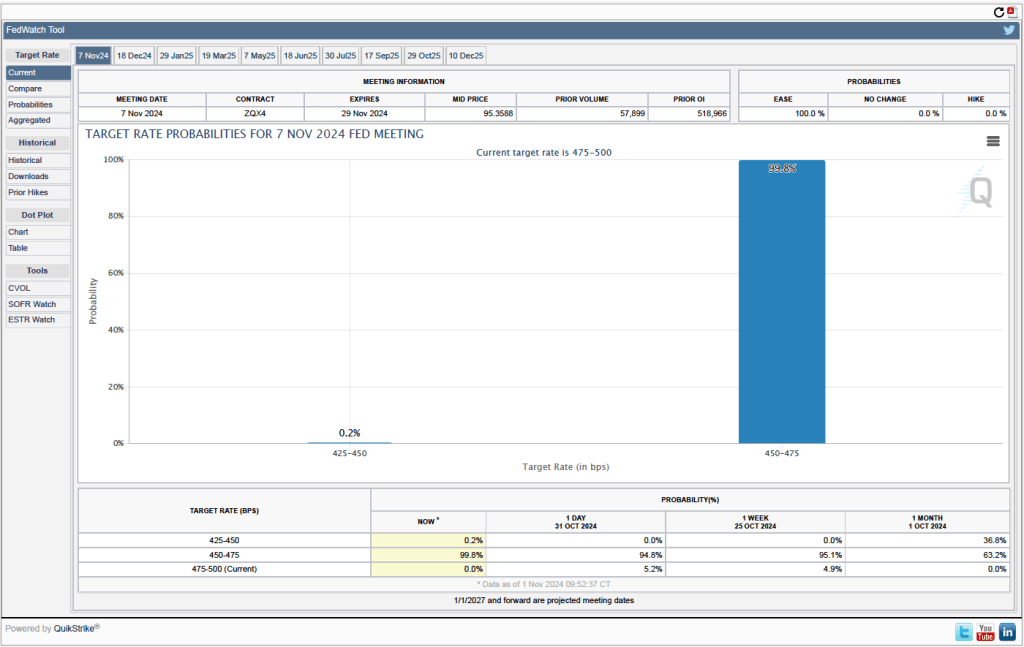
The Federal Reserve’s policy-making Federal Open Market Committee (FOMC) has its next meeting on November 6-7. What effect will this jobs report likely have on the committee’s actions at that meeting? One indication of expectations of future rate cuts comes from investors who buy and sell federal funds futures contracts. (We discuss the futures market for federal funds in this blog post.) As shown in the following figure, today these investors assign a probability of 99.8 percent to the FOMC cutting its target for the federal funds rate by 0.25 percentage point (25 basis points) at its next meeting. Investors see effectively no chance of the committee leaving its target range unchanged at the current 4.75 percent to 5.00 percent or of the committee cutting its target rate by 50 basis point cut.
Investors don’t appear to believe that the acceleration in wage growth indicated by today’s jobs report will cause the FOMC to pause its rate cutting. Nor do they appear to believe that the unexpectedly small increase in payroll employment will cause the committee to cut its target for the federal funds rate by 50 basis points.